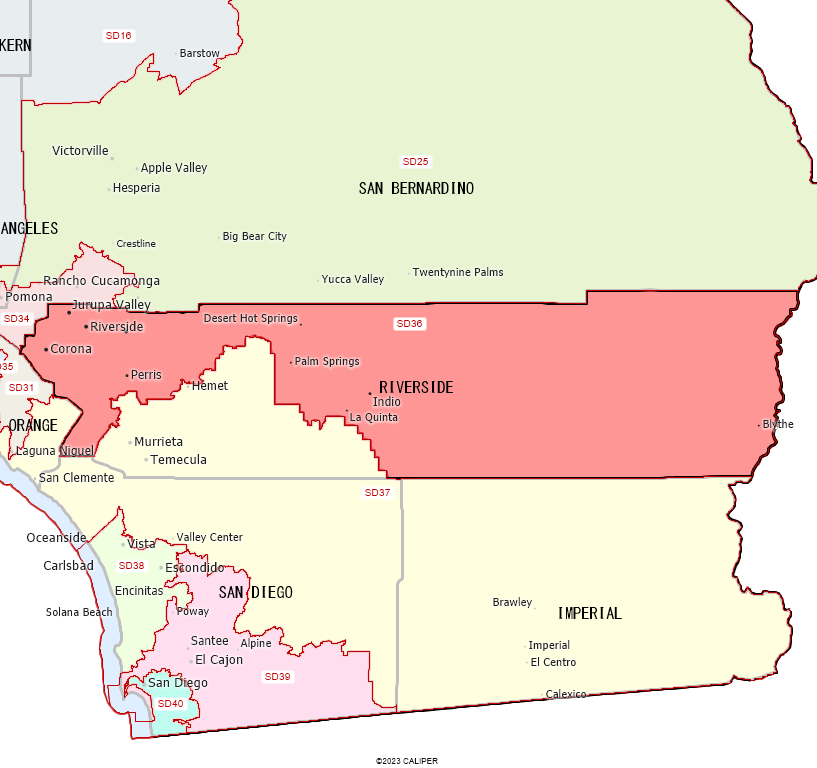
Senate District 36 (1983)

SD36_1983

Please Note: Boundaries are approximate.

DISTRICT SD36

1980 Census Population (Public Law 94-171)

POPULATIONCOUNTPERCENT
Total Persons586,759 
RACECOUNTPERCENT
White472,12780.5%
Black30,7465.2%
American Indian, Eskimo, and Aleut6,2441.1%
Asian and Pacific Islander8,7471.5%
Other (Race, n.e.c.)*68,89511.7%
SPANISH ORIGINCOUNTPERCENT
Hispanic or Latino*119,53620.4%
REDISTRICTING STATSCOUNTPERCENT
Ideal Population591,714 
Deviation from Ideal-4,955-0.8%
POLITICAL STATSCOUNTPERCENT
Democrats 51.6%
Republicans 38.6%
Decline to State 8.1%

* Nationally, in 1970, only 1 percent of Spanish origin persons were classified as "Other" race and 93 percent as "White." The 1980 census sample data showed that a much larger proportion, 38 percent, of Spanish origin persons reported their races as "Other" and only 58 percent reported "White." As a consequence of these differences, 1980 population totals for "White" and "Other (Race, n.e.c.)" are not comparable with corresponding 1970 figures.