This Congressional district was established by the voters of California with the passage of Proposition 50 (2025) on November 4, 2025 and will go into effect after the November 2026 elections and upon seating of the 120th Congress, January 3, 2027. This district will stay in use until the California Citizens Redistricting Commission draws new maps following the 2030 U.S. Census .
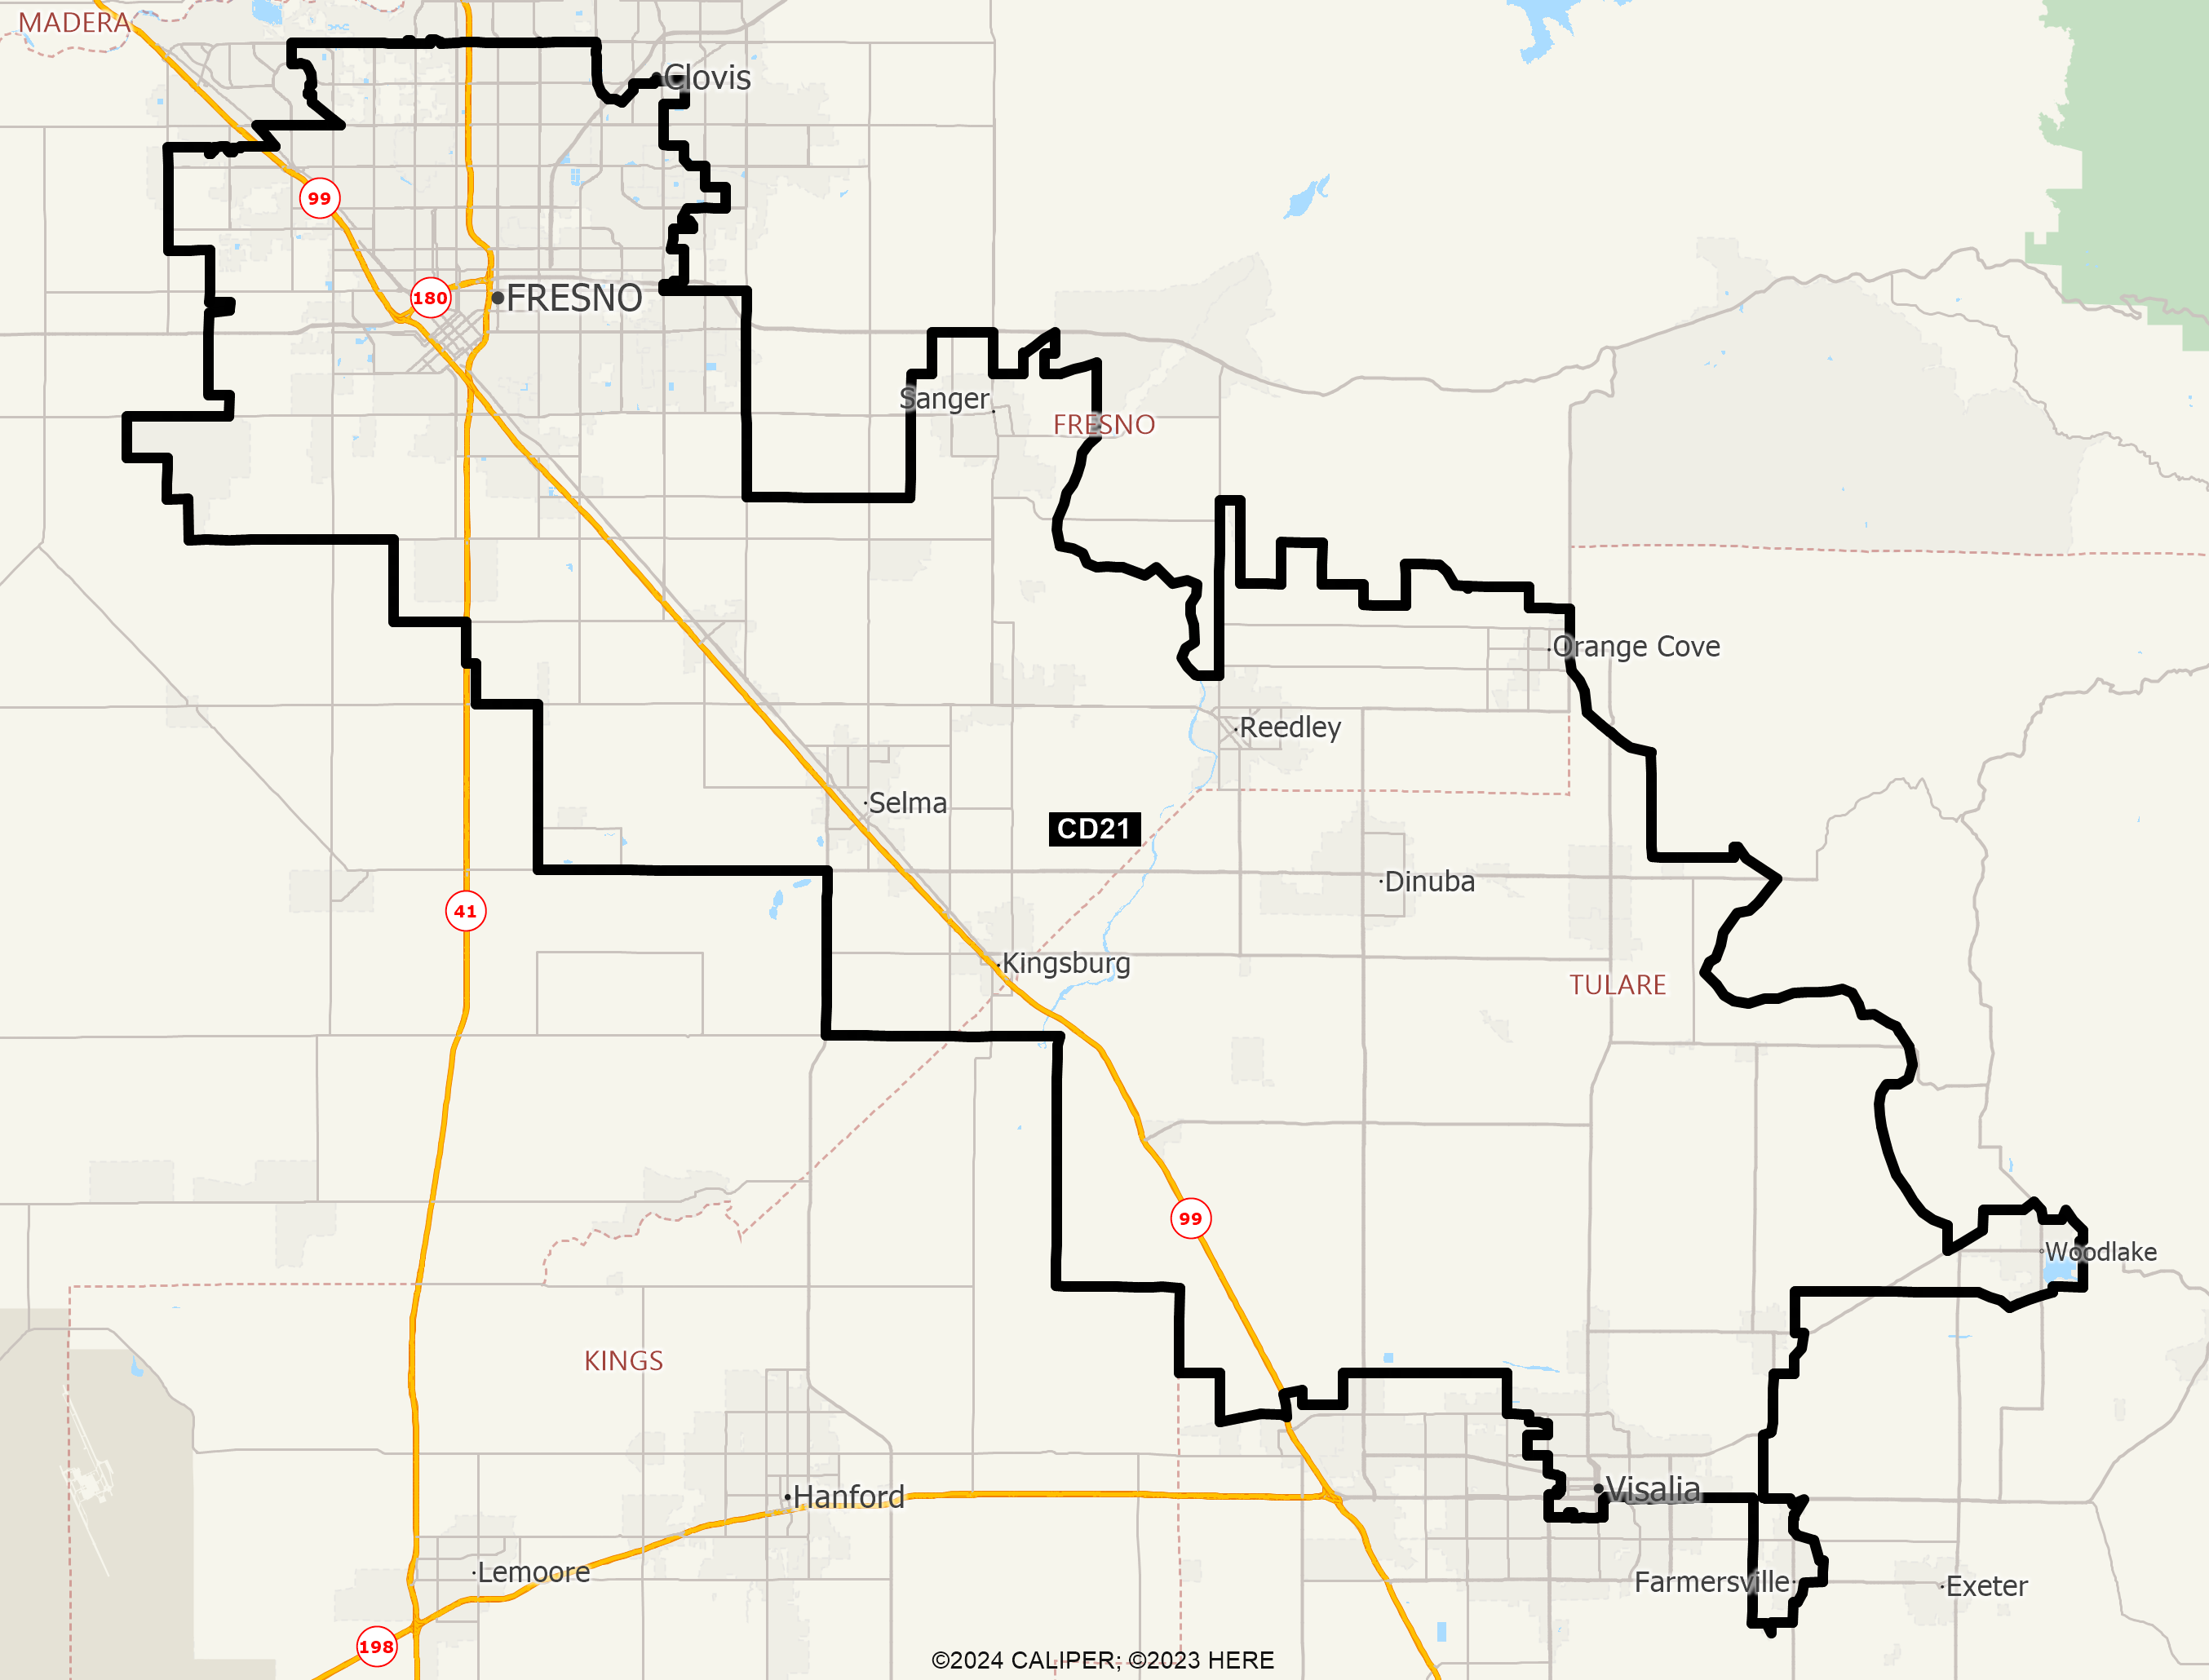
DISTRICT CD21
2020 Census Population (adj Elec. §21003 - SWDB 9/27/2021) Name Count Percent Total Population (POP) 760,067 100.00% POP Hispanic or Latino 482,325 63.46% POP Not Hispanic or Latino (NH) 277,742 36.54% POP NH Population of one race 260,039 34.21% POP NH White alone 144,585 19.02% POP NH Black or African American alone 35,075 4.61% POP NH Asian alone 71,545 9.41% POP NH American Indian and Alaska Native alone 4,291 0.56% POP NH Native Hawaiian and Other Pacific Islander alone 854 0.11% POP NH Some Other Race alone 3,689 0.49% POP NH Population of two or more races 17,703 2.33% POP DOJ NH Black or African American 38,150 5.02% POP DOJ NH Asian 75,125 9.88% POP DOJ NH American Indian and Alaska Native 8,995 1.18% POP DOJ NH Native Hawaiian and Other Pacific Islander 1,190 0.16% POP DOJ NH Some Other Race 5,871 0.77% POP DOJ NH Balance of Population of two or more races 3,826 0.50%
2020 Census Voting Age Population (adj Elec. §21003 - SWDB 9/27/2021) Name Count Percent Total Voting Age Population (VAP) 540,712 100.00% VAP Hispanic or Latino 322,418 59.63% VAP Not Hispanic or Latino (NH) 218,294 40.37% VAP NH Population of one race 206,390 38.17% VAP NH White alone 122,359 22.63% VAP NH Black or African American alone 25,462 4.71% VAP NH Asian alone 52,111 9.64% VAP NH American Indian and Alaska Native alone 3,204 0.59% VAP NH Native Hawaiian and Other Pacific Islander alone 673 0.12% VAP NH Some Other Race alone 2,581 0.48% VAP NH Population of two or more races 11,904 2.20% VAP DOJ NH Black or African American 27,075 5.01% VAP DOJ NH Asian 54,194 10.02% VAP DOJ NH American Indian and Alaska Native 7,053 1.30% VAP DOJ NH Native Hawaiian and Other Pacific Islander 900 0.17% VAP DOJ NH Some Other Race 4,283 0.79% VAP DOJ NH Balance of Population of two or more races 2,430 0.45%
2020 Census Housing Occupancy Status Name Count Percent Total Housing Units 240,976 100.00% Occupied 230,845 95.80% Vacant 10,131 4.20%
2020 Census Group Quarters Population (adj Elec. §21003 - SWDB 9/27/2021) Name Count Percent Total Group Quarters Population: 12,493 100.00% Institutionalized population: 6,264 50.14% Correctional facilities for adults 3,361 26.90% Juvenile facilities 261 2.09% Nursing facilities/Skilled-nursing facilities 2,600 20.81% Other institutional facilities 42 0.34% Noninstitutionalized population: 6,229 49.86% College/University student housing 1,754 14.04% Military quarters 0 0.00% Other noninstitutional facilities 4,475 35.82%
2019-2023 ACS Citizen Population (adj Elec. §21003 - SWDB 7/16/2025) Name Count Percent Total Citizen Population (CITZ) 676,613 100.00% CITZ Hispanic or Latino 406,017 60.01% CITZ Not Hispanic or Latino (NH) 270,482 39.98% CITZ NH White alone 154,335 22.81% CITZ NH Black or African American Alone 33,420 4.94% CITZ NH Asian Alone 62,640 9.26% CITZ NH American Indian and Alaska Native Alone 3,089 0.46% CITZ NH Native Hawaiian and Other Pacific Islander alone 1,027 0.15% CITZ NH Black or African American and White 5,268 0.78% CITZ NH American Indian or Alaska Native and White 3,120 0.46% CITZ NH Asian and White 3,877 0.57% CITZ NH American Indian or Alaska Native and Black or African American 1,060 0.16% CITZ NH Remainder of Two or More Race 2,766 0.41% CITZ DOJ NH Black or African American 38,688 5.72% CITZ DOJ NH Asian 65,760 9.72% CITZ DOJ NH American Indian and Alaska Native 6,966 1.03%
2019-2023 ACS Citizen Voting Age Population (adj Elec. §21003 - SWDB 7/16/2025) Name Count Percent Total Citizen Voting Age Population (CVAP) 458,902 100.00% CVAP Hispanic or Latino 249,611 54.39% CVAP Not Hispanic or Latino (NH) 209,057 45.56% CVAP NH White alone 129,039 28.12% CVAP NH Black or African American Alone 24,719 5.39% CVAP NH Asian Alone 42,916 9.35% CVAP NH American Indian and Alaska Native Alone 2,315 0.50% CVAP NH Native Hawaiian and Other Pacific Islander alone 656 0.14% CVAP NH Black or African American and White 2,589 0.56% CVAP NH Asian and White 1,908 0.42% CVAP NH American Indian or Alaska Native and White 3,012 0.66% CVAP NH American Indian or Alaska Native and Black or African American 545 0.12% CVAP NH Remainder of Two or More Race 1,295 0.28% CVAP DOJ NH Black or African American 27,308 5.95% CVAP DOJ NH Asian 44,824 9.77% CVAP DOJ NH American Indian and Alaska Native 5,327 1.16%
Counties In District Name Count Percent Fresno 630,233 62.49% Tulare 129,834 27.33%
Places In District Name Count Percent FRESNO: Bowles(U) 158 100.00% FRESNO: Calwa(U) 1,791 100.00% FRESNO: Clovis(C) 27,478 22.83% FRESNO: Del Rey(U) 1,362 100.00% FRESNO: Easton(U) 1,975 100.00% FRESNO: Fowler(C) 6,723 100.00% FRESNO: Fresno(C) 404,318 74.24% FRESNO: Kingsburg(C) 12,415 100.00% FRESNO: Malaga(U) 887 100.00% FRESNO: Mayfair(U) 4,862 100.00% FRESNO: Monmouth(U) 121 100.00% FRESNO: Old Fig Garden(U) 5,504 100.00% FRESNO: Orange Cove(C) 9,689 100.00% FRESNO: Parlier(C) 14,648 100.00% FRESNO: Reedley(C) 25,292 100.00% FRESNO: Sanger(C) 26,720 100.00% FRESNO: Selma(C) 24,768 100.00% FRESNO: Sunnyside(U) 4,641 100.00% FRESNO: Tarpey Village(U) 4,007 100.00% FRESNO: West Park(U) 1,058 100.00% FRESNO: Remainder of Fresno(R) 51,816 45.53% TULARE: Cutler(U) 4,506 100.00% TULARE: Delft Colony(U) 416 100.00% TULARE: Dinuba(C) 24,689 100.00% TULARE: East Orosi(U) 424 100.00% TULARE: El Monte Mobile Village(U) 157 100.00% TULARE: Farmersville(C) 10,455 100.00% TULARE: Ivanhoe(U) 4,497 100.00% TULARE: Linnell Camp(U) 700 100.00% TULARE: London(U) 1,526 100.00% TULARE: Monson(U) 153 100.00% TULARE: Orosi(U) 8,381 100.00% TULARE: Patterson Tract(U) 1,896 100.00% TULARE: Seville(U) 448 100.00% TULARE: Sultana(U) 781 100.00% TULARE: Traver(U) 734 100.00% TULARE: Visalia(C) 47,429 33.44% TULARE: Woodlake(C) 7,463 100.00% TULARE: Yettem(U) 202 100.00% TULARE: Remainder of Tulare(R) 14,977 24.54%
Senate Office of Demographics 02/2026