This Congressional district was established by the voters of California with the passage of Proposition 50 (2025) on November 4, 2025 and will go into effect after the November 2026 elections and upon seating of the 120th Congress, January 3, 2027. This district will stay in use until the California Citizens Redistricting Commission draws new maps following the 2030 U.S. Census .
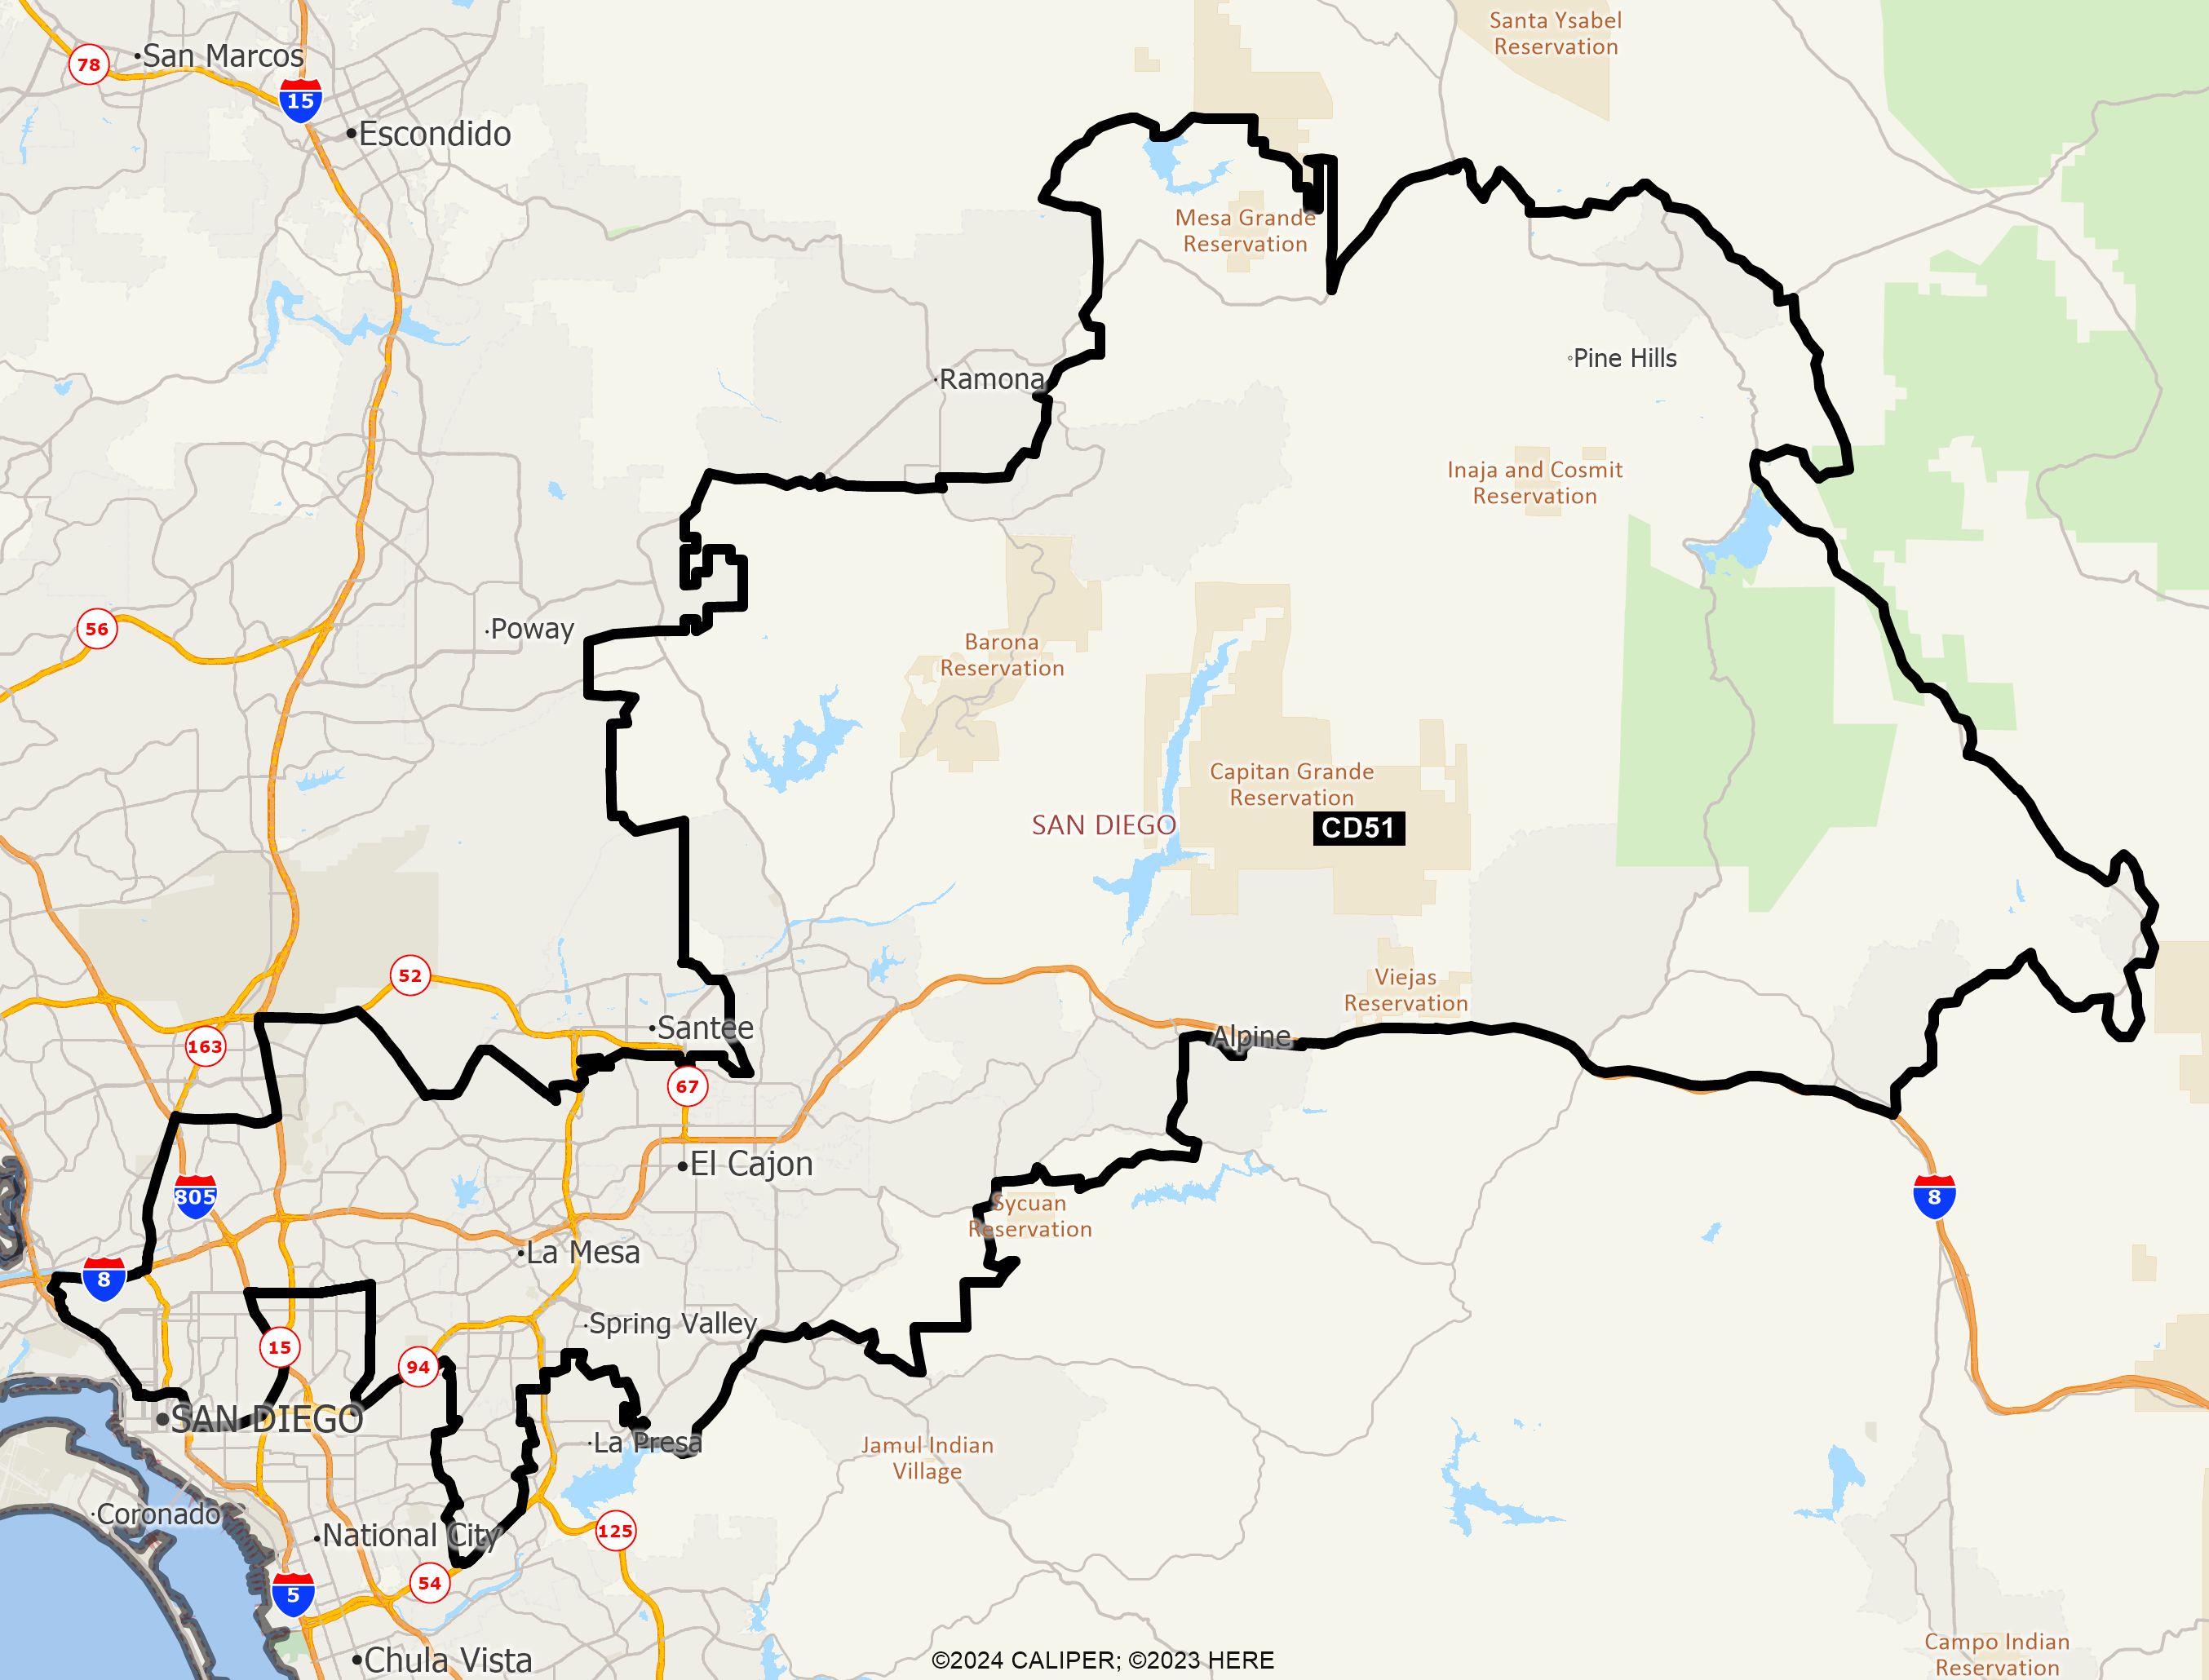
DISTRICT CD51
2020 Census Population (adj Elec. §21003 - SWDB 9/27/2021) Name Count Percent Total Population (POP) 760,067 100.00% POP Hispanic or Latino 205,434 27.03% POP Not Hispanic or Latino (NH) 554,633 72.97% POP NH Population of one race 510,314 67.14% POP NH White alone 385,587 50.73% POP NH Black or African American alone 50,707 6.67% POP NH Asian alone 62,598 8.24% POP NH American Indian and Alaska Native alone 3,392 0.45% POP NH Native Hawaiian and Other Pacific Islander alone 3,380 0.44% POP NH Some Other Race alone 4,650 0.61% POP NH Population of two or more races 44,319 5.83% POP DOJ NH Black or African American 57,802 7.60% POP DOJ NH Asian 77,884 10.25% POP DOJ NH American Indian and Alaska Native 9,917 1.30% POP DOJ NH Native Hawaiian and Other Pacific Islander 4,824 0.63% POP DOJ NH Some Other Race 10,532 1.39% POP DOJ NH Balance of Population of two or more races 8,087 1.06%
2020 Census Voting Age Population (adj Elec. §21003 - SWDB 9/27/2021) Name Count Percent Total Voting Age Population (VAP) 610,811 100.00% VAP Hispanic or Latino 149,165 24.42% VAP Not Hispanic or Latino (NH) 461,646 75.58% VAP NH Population of one race 431,704 70.68% VAP NH White alone 329,272 53.91% VAP NH Black or African American alone 39,729 6.50% VAP NH Asian alone 53,668 8.79% VAP NH American Indian and Alaska Native alone 2,719 0.45% VAP NH Native Hawaiian and Other Pacific Islander alone 2,798 0.46% VAP NH Some Other Race alone 3,518 0.58% VAP NH Population of two or more races 29,942 4.90% VAP DOJ NH Black or African American 43,905 7.19% VAP DOJ NH Asian 63,337 10.37% VAP DOJ NH American Indian and Alaska Native 8,089 1.32% VAP DOJ NH Native Hawaiian and Other Pacific Islander 3,773 0.62% VAP DOJ NH Some Other Race 8,172 1.34% VAP DOJ NH Balance of Population of two or more races 5,098 0.83%
2020 Census Housing Occupancy Status Name Count Percent Total Housing Units 305,483 100.00% Occupied 291,396 95.39% Vacant 14,087 4.61%
2020 Census Group Quarters Population (adj Elec. §21003 - SWDB 9/27/2021) Name Count Percent Total Group Quarters Population: 15,706 100.00% Institutionalized population: 4,803 30.58% Correctional facilities for adults 58 0.37% Juvenile facilities 235 1.50% Nursing facilities/Skilled-nursing facilities 4,334 27.59% Other institutional facilities 176 1.12% Noninstitutionalized population: 10,903 69.42% College/University student housing 6,414 40.84% Military quarters 358 2.28% Other noninstitutional facilities 4,131 26.30%
2019-2023 ACS Citizen Population (adj Elec. §21003 - SWDB 7/16/2025) Name Count Percent Total Citizen Population (CITZ) 721,400 100.00% CITZ Hispanic or Latino 189,752 26.30% CITZ Not Hispanic or Latino (NH) 531,805 73.72% CITZ NH White alone 389,912 54.05% CITZ NH Black or African American Alone 49,906 6.92% CITZ NH Asian Alone 52,265 7.24% CITZ NH American Indian and Alaska Native Alone 1,833 0.25% CITZ NH Native Hawaiian and Other Pacific Islander alone 3,195 0.44% CITZ NH Black or African American and White 8,639 1.20% CITZ NH American Indian or Alaska Native and White 13,727 1.90% CITZ NH Asian and White 3,976 0.55% CITZ NH American Indian or Alaska Native and Black or African American 611 0.08% CITZ NH Remainder of Two or More Race 7,630 1.06% CITZ DOJ NH Black or African American 58,545 8.12% CITZ DOJ NH Asian 65,992 9.15% CITZ DOJ NH American Indian and Alaska Native 5,809 0.81%
2019-2023 ACS Citizen Voting Age Population (adj Elec. §21003 - SWDB 7/16/2025) Name Count Percent Total Citizen Voting Age Population (CVAP) 573,012 100.00% CVAP Hispanic or Latino 132,681 23.16% CVAP Not Hispanic or Latino (NH) 440,454 76.87% CVAP NH White alone 330,267 57.64% CVAP NH Black or African American Alone 39,237 6.85% CVAP NH Asian Alone 45,036 7.86% CVAP NH American Indian and Alaska Native Alone 1,449 0.25% CVAP NH Native Hawaiian and Other Pacific Islander alone 2,586 0.45% CVAP NH Black or African American and White 4,841 0.84% CVAP NH Asian and White 8,533 1.49% CVAP NH American Indian or Alaska Native and White 3,272 0.57% CVAP NH American Indian or Alaska Native and Black or African American 511 0.09% CVAP NH Remainder of Two or More Race 4,547 0.79% CVAP DOJ NH Black or African American 44,078 7.69% CVAP DOJ NH Asian 53,569 9.35% CVAP DOJ NH American Indian and Alaska Native 4,721 0.82%
Counties In District Name Count Percent San Diego 760,064 23.02%
Places In District Name Count Percent SAN DIEGO: Alpine(U) 10,217 69.38% SAN DIEGO: Bostonia(U) 16,942 100.00% SAN DIEGO: Casa de Oro-Mount Helix(U) 19,612 100.00% SAN DIEGO: Crest(U) 2,840 100.00% SAN DIEGO: Descanso(U) 1,502 100.00% SAN DIEGO: El Cajon(C) 106,584 100.00% SAN DIEGO: Eucalyptus Hills(U) 5,526 100.00% SAN DIEGO: Granite Hills(U) 3,276 100.00% SAN DIEGO: Harbison Canyon(U) 4,061 100.00% SAN DIEGO: Julian(U) 1,775 100.00% SAN DIEGO: Lakeside(U) 21,234 100.00% SAN DIEGO: La Mesa(C) 61,266 100.00% SAN DIEGO: Lemon Grove(C) 27,743 100.00% SAN DIEGO: Mount Laguna(U) 74 100.00% SAN DIEGO: Pine Valley(U) 1,649 100.00% SAN DIEGO: Ramona(U) 116 0.54% SAN DIEGO: Rancho San Diego(U) 21,895 100.00% SAN DIEGO: San Diego(C) 369,198 26.56% SAN DIEGO: San Diego Country Estates(U) 10,416 100.00% SAN DIEGO: Spring Valley(U) 31,085 100.00% SAN DIEGO: Winter Gardens(U) 22,436 100.00% SAN DIEGO: Remainder of San Diego(R) 20,617 12.82%
Senate Office of Demographics 02/2026