This Congressional district was established by the voters of California with the passage of Proposition 50 (2025) on November 4, 2025 and will go into effect after the November 2026 elections and upon seating of the 120th Congress, January 3, 2027. This district will stay in use until the California Citizens Redistricting Commission draws new maps following the 2030 U.S. Census .
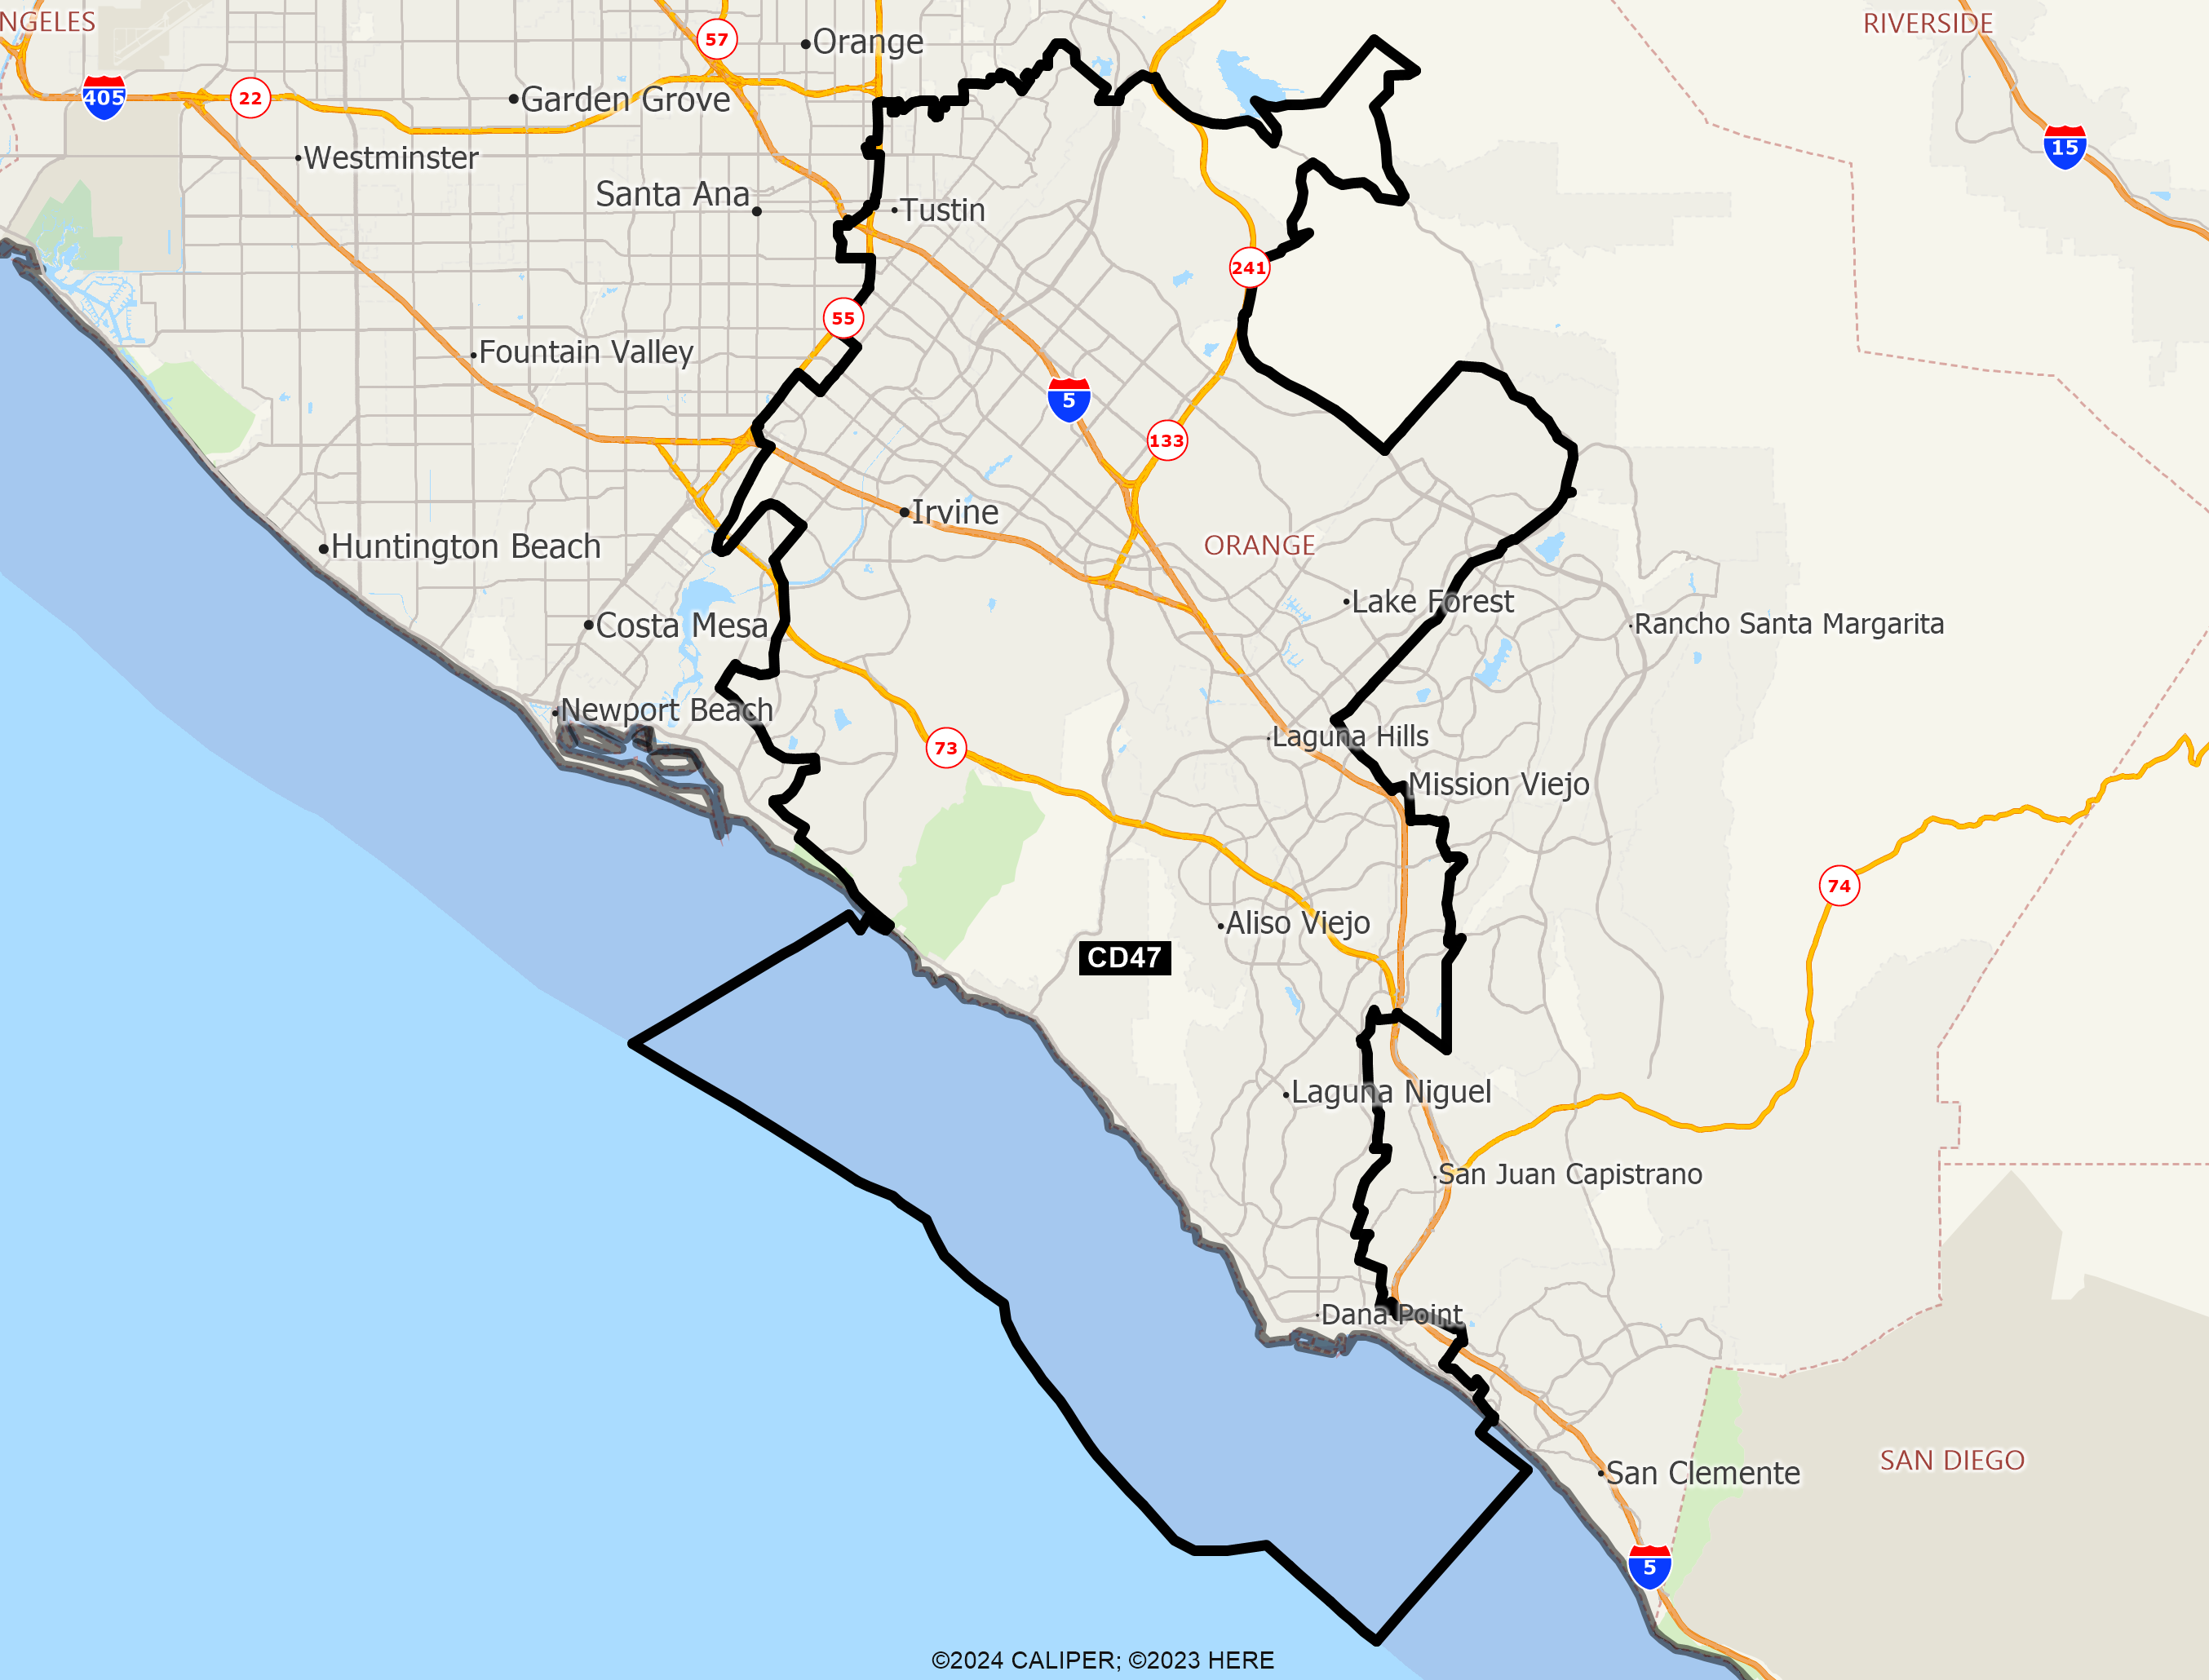
DISTRICT CD47
2020 Census Population (adj Elec. §21003 - SWDB 9/27/2021) Name Count Percent Total Population (POP) 760,065 100.00% POP Hispanic or Latino 137,878 18.14% POP Not Hispanic or Latino (NH) 622,187 81.86% POP NH Population of one race 582,123 76.59% POP NH White alone 353,573 46.52% POP NH Black or African American alone 12,993 1.71% POP NH Asian alone 209,399 27.55% POP NH American Indian and Alaska Native alone 894 0.12% POP NH Native Hawaiian and Other Pacific Islander alone 1,089 0.14% POP NH Some Other Race alone 4,175 0.55% POP NH Population of two or more races 40,064 5.27% POP DOJ NH Black or African American 17,134 2.25% POP DOJ NH Asian 230,971 30.39% POP DOJ NH American Indian and Alaska Native 4,770 0.63% POP DOJ NH Native Hawaiian and Other Pacific Islander 1,820 0.24% POP DOJ NH Some Other Race 9,585 1.26% POP DOJ NH Balance of Population of two or more races 4,334 0.57%
2020 Census Voting Age Population (adj Elec. §21003 - SWDB 9/27/2021) Name Count Percent Total Voting Age Population (VAP) 608,036 100.00% VAP Hispanic or Latino 101,931 16.76% VAP Not Hispanic or Latino (NH) 506,105 83.24% VAP NH Population of one race 480,507 79.03% VAP NH White alone 299,841 49.31% VAP NH Black or African American alone 10,747 1.77% VAP NH Asian alone 165,367 27.20% VAP NH American Indian and Alaska Native alone 704 0.12% VAP NH Native Hawaiian and Other Pacific Islander alone 838 0.14% VAP NH Some Other Race alone 3,010 0.50% VAP NH Population of two or more races 25,598 4.21% VAP DOJ NH Black or African American 13,575 2.23% VAP DOJ NH Asian 177,503 29.19% VAP DOJ NH American Indian and Alaska Native 3,899 0.64% VAP DOJ NH Native Hawaiian and Other Pacific Islander 1,331 0.22% VAP DOJ NH Some Other Race 7,074 1.16% VAP DOJ NH Balance of Population of two or more races 2,882 0.47%
2020 Census Housing Occupancy Status Name Count Percent Total Housing Units 304,569 100.00% Occupied 283,482 93.08% Vacant 21,087 6.92%
2020 Census Group Quarters Population (adj Elec. §21003 - SWDB 9/27/2021) Name Count Percent Total Group Quarters Population: 20,184 100.00% Institutionalized population: 740 3.67% Correctional facilities for adults 0 0.00% Juvenile facilities 31 0.15% Nursing facilities/Skilled-nursing facilities 709 3.51% Other institutional facilities 0 0.00% Noninstitutionalized population: 19,444 96.33% College/University student housing 17,072 84.58% Military quarters 0 0.00% Other noninstitutional facilities 2,372 11.75%
2019-2023 ACS Citizen Population (adj Elec. §21003 - SWDB 7/16/2025) Name Count Percent Total Citizen Population (CITZ) 658,982 100.00% CITZ Hispanic or Latino 114,017 17.30% CITZ Not Hispanic or Latino (NH) 544,961 82.70% CITZ NH White alone 337,496 51.21% CITZ NH Black or African American Alone 12,965 1.97% CITZ NH Asian Alone 157,296 23.87% CITZ NH American Indian and Alaska Native Alone 882 0.13% CITZ NH Native Hawaiian and Other Pacific Islander alone 1,959 0.30% CITZ NH Black or African American and White 3,828 0.58% CITZ NH American Indian or Alaska Native and White 21,638 3.28% CITZ NH Asian and White 2,660 0.40% CITZ NH American Indian or Alaska Native and Black or African American 248 0.04% CITZ NH Remainder of Two or More Race 5,949 0.90% CITZ DOJ NH Black or African American 16,793 2.55% CITZ DOJ NH Asian 178,934 27.15% CITZ DOJ NH American Indian and Alaska Native 3,542 0.54%
2019-2023 ACS Citizen Voting Age Population (adj Elec. §21003 - SWDB 7/16/2025) Name Count Percent Total Citizen Voting Age Population (CVAP) 514,402 100.00% CVAP Hispanic or Latino 78,502 15.26% CVAP Not Hispanic or Latino (NH) 435,981 84.75% CVAP NH White alone 284,408 55.29% CVAP NH Black or African American Alone 10,734 2.09% CVAP NH Asian Alone 119,522 23.24% CVAP NH American Indian and Alaska Native Alone 656 0.13% CVAP NH Native Hawaiian and Other Pacific Islander alone 1,463 0.28% CVAP NH Black or African American and White 2,453 0.48% CVAP NH Asian and White 10,732 2.09% CVAP NH American Indian or Alaska Native and White 2,156 0.42% CVAP NH American Indian or Alaska Native and Black or African American 248 0.05% CVAP NH Remainder of Two or More Race 3,450 0.67% CVAP DOJ NH Black or African American 13,187 2.56% CVAP DOJ NH Asian 130,254 25.32% CVAP DOJ NH American Indian and Alaska Native 2,812 0.55%
Counties In District Name Count Percent Orange 760,065 23.80%
Places In District Name Count Percent ORANGE: Aliso Viejo(C) 52,222 100.00% ORANGE: Dana Point(C) 33,144 100.00% ORANGE: Irvine(C) 307,959 100.00% ORANGE: Laguna Beach(C) 23,062 100.00% ORANGE: Laguna Hills(C) 31,398 100.00% ORANGE: Laguna Niguel(C) 64,417 100.00% ORANGE: Laguna Woods(C) 17,658 100.00% ORANGE: Lake Forest(C) 85,964 100.00% ORANGE: Mission Viejo(C) 14,715 15.69% ORANGE: Newport Beach(C) 22,109 25.91% ORANGE: North Tustin(U) 25,387 98.59% ORANGE: Tustin(C) 80,412 100.00% ORANGE: Remainder of Orange(R) 1,618 5.81%
Senate Office of Demographics 02/2026