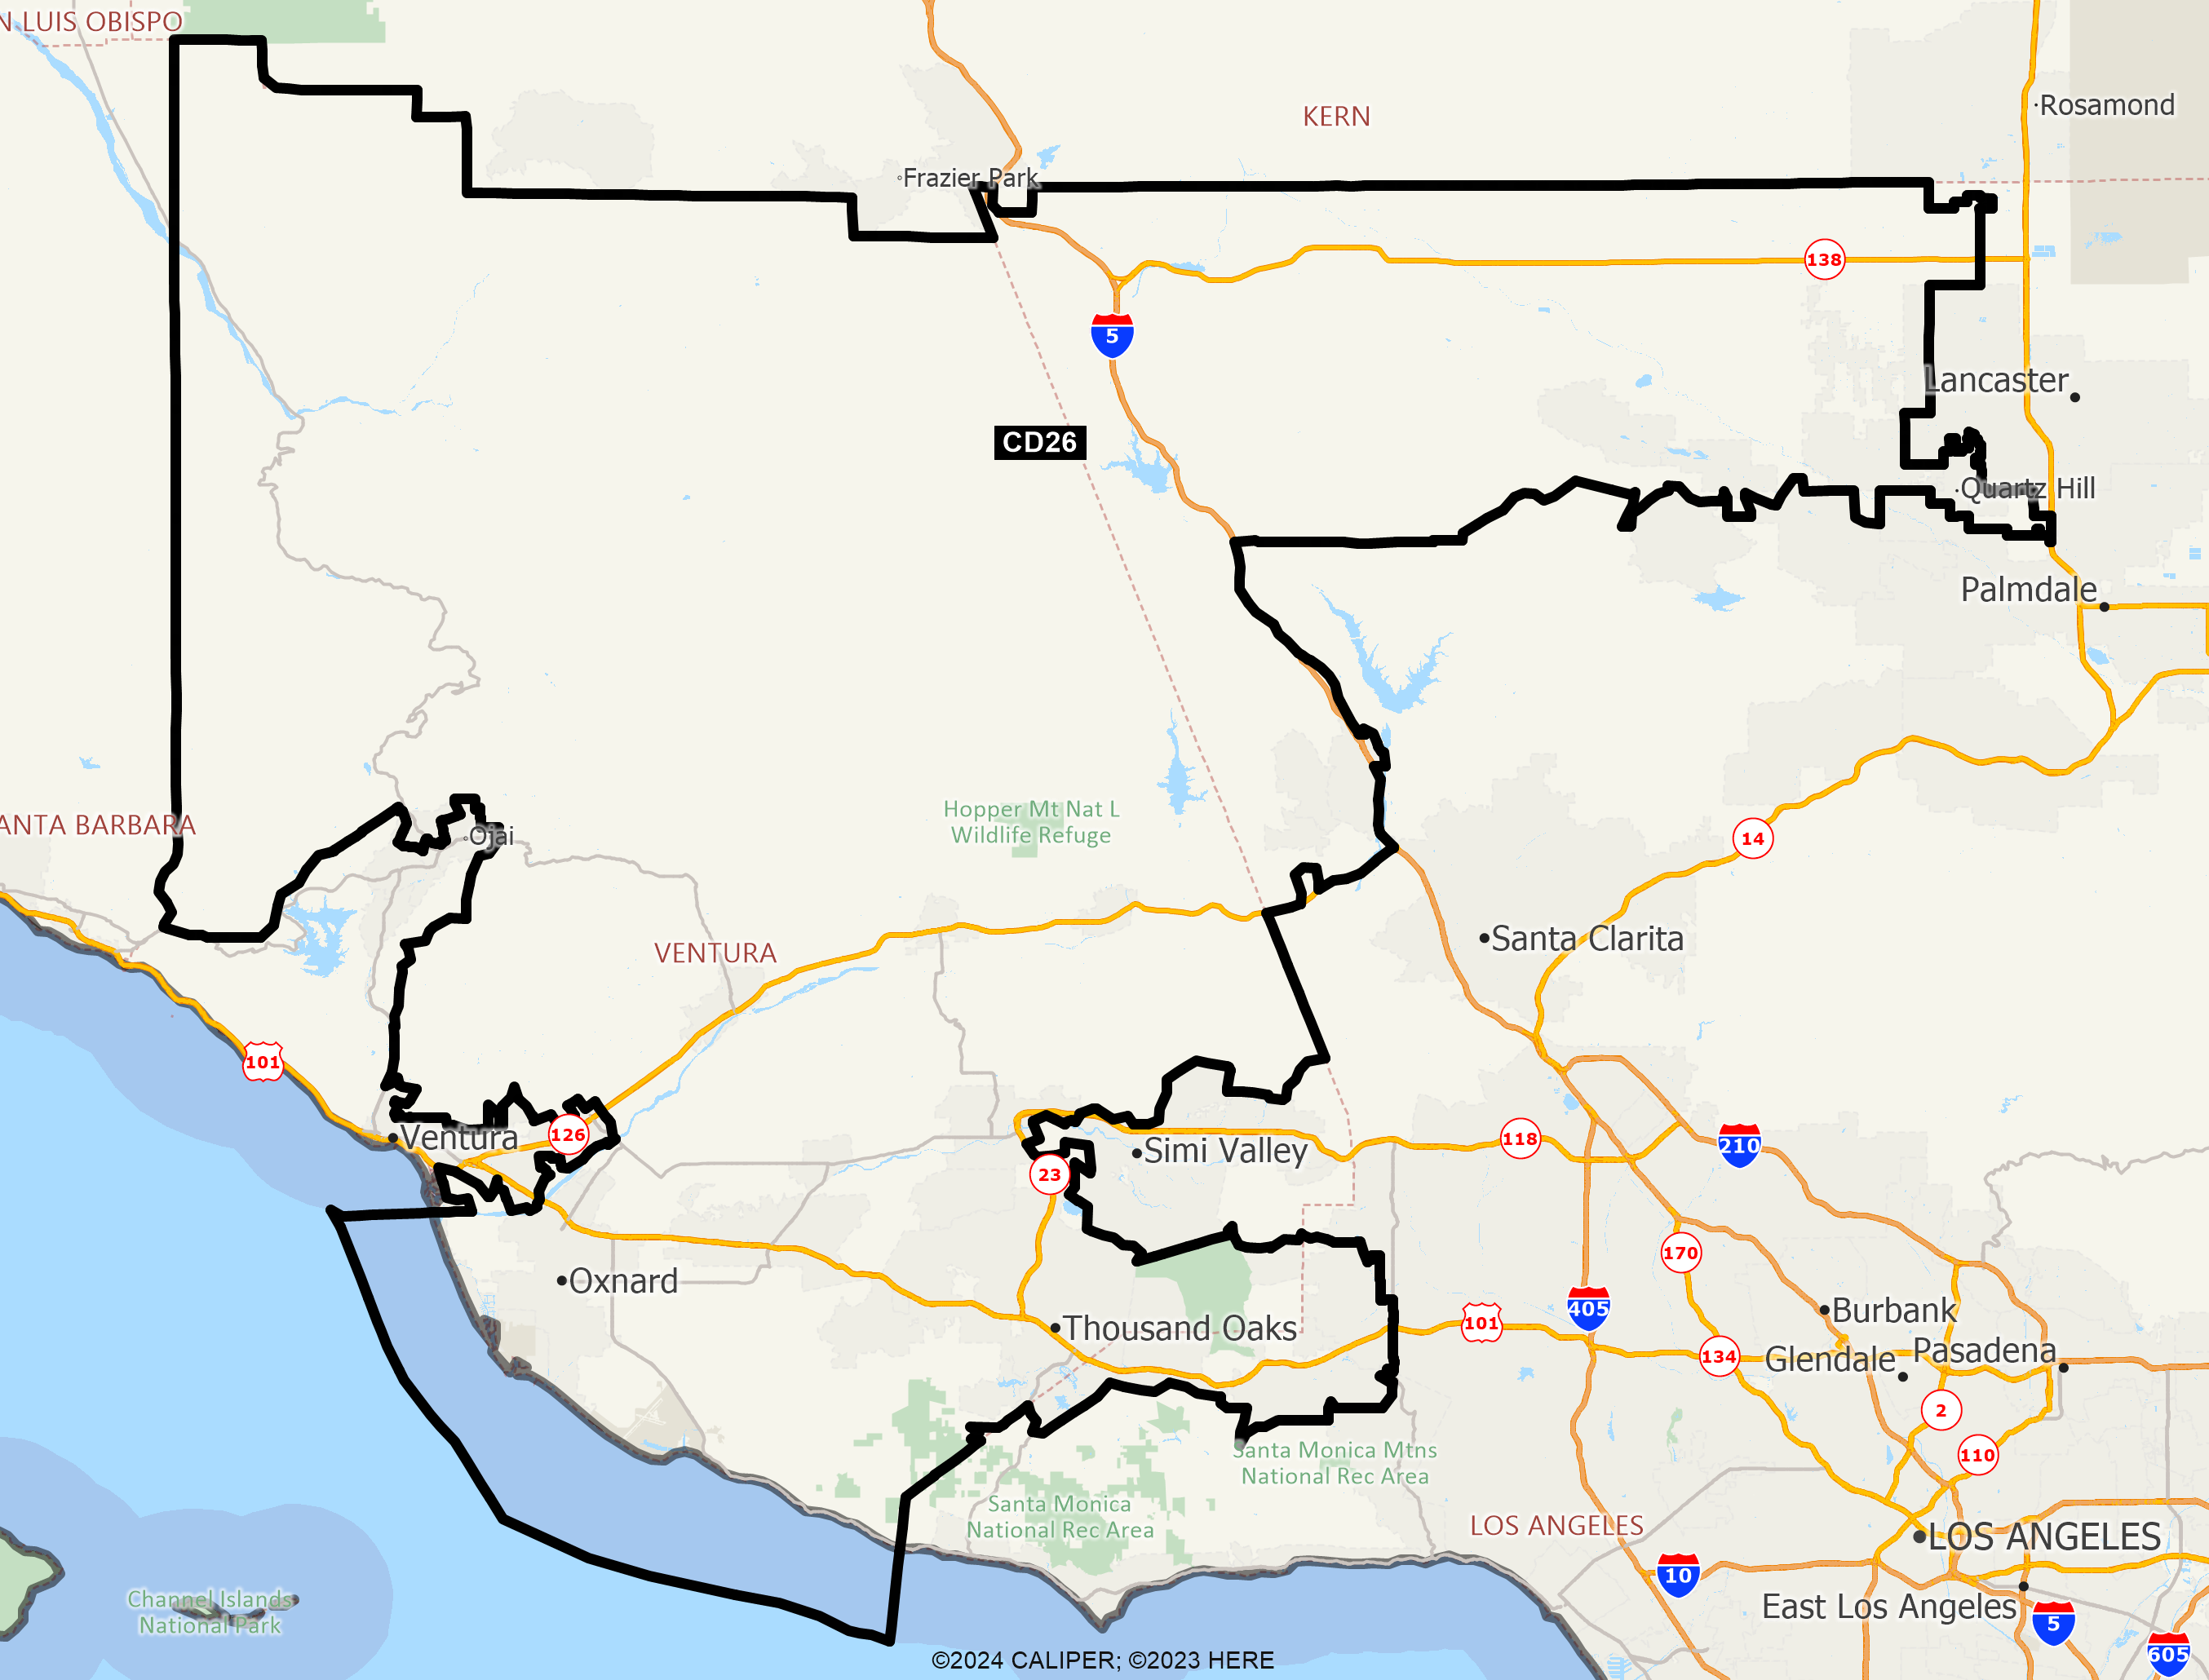
This Congressional district was established by the voters of California with the passage of Proposition 50 (2025) on November 4, 2025 and will go into effect after the November 2026 elections and upon seating of the 120th Congress, January 3, 2027. This district will stay in use until the California Citizens Redistricting Commission draws new maps following the 2030 U.S. Census .
DISTRICT CD26
2020 Census Population (adj Elec. §21003 - SWDB 9/27/2021) Name Count Percent Total Population (POP) 760,067 100.00% POP Hispanic or Latino 317,496 41.77% POP Not Hispanic or Latino (NH) 442,571 58.23% POP NH Population of one race 412,726 54.30% POP NH White alone 325,269 42.79% POP NH Black or African American alone 16,531 2.17% POP NH Asian alone 63,926 8.41% POP NH American Indian and Alaska Native alone 1,567 0.21% POP NH Native Hawaiian and Other Pacific Islander alone 1,214 0.16% POP NH Some Other Race alone 4,219 0.56% POP NH Population of two or more races 29,845 3.93% POP DOJ NH Black or African American 20,287 2.67% POP DOJ NH Asian 75,416 9.92% POP DOJ NH American Indian and Alaska Native 6,300 0.83% POP DOJ NH Native Hawaiian and Other Pacific Islander 1,909 0.25% POP DOJ NH Some Other Race 9,095 1.20% POP DOJ NH Balance of Population of two or more races 4,295 0.57%
2020 Census Voting Age Population (adj Elec. §21003 - SWDB 9/27/2021) Name Count Percent Total Voting Age Population (VAP) 587,825 100.00% VAP Hispanic or Latino 223,811 38.07% VAP Not Hispanic or Latino (NH) 364,014 61.93% VAP NH Population of one race 344,685 58.64% VAP NH White alone 273,542 46.53% VAP NH Black or African American alone 13,452 2.29% VAP NH Asian alone 52,372 8.91% VAP NH American Indian and Alaska Native alone 1,282 0.22% VAP NH Native Hawaiian and Other Pacific Islander alone 989 0.17% VAP NH Some Other Race alone 3,048 0.52% VAP NH Population of two or more races 19,329 3.29% VAP DOJ NH Black or African American 15,622 2.66% VAP DOJ NH Asian 58,761 10.00% VAP DOJ NH American Indian and Alaska Native 5,155 0.88% VAP DOJ NH Native Hawaiian and Other Pacific Islander 1,437 0.24% VAP DOJ NH Some Other Race 6,661 1.13% VAP DOJ NH Balance of Population of two or more races 2,836 0.48%
2020 Census Housing Occupancy Status Name Count Percent Total Housing Units 260,797 100.00% Occupied 248,737 95.38% Vacant 12,060 4.62%
2020 Census Group Quarters Population (adj Elec. §21003 - SWDB 9/27/2021) Name Count Percent Total Group Quarters Population: 8,941 100.00% Institutionalized population: 1,909 21.35% Correctional facilities for adults 0 0.00% Juvenile facilities 355 3.97% Nursing facilities/Skilled-nursing facilities 1,550 17.34% Other institutional facilities 4 0.04% Noninstitutionalized population: 7,032 78.65% College/University student housing 3,044 34.05% Military quarters 998 11.16% Other noninstitutional facilities 2,990 33.44%
2019-2023 ACS Citizen Population (adj Elec. §21003 - SWDB 7/16/2025) Name Count Percent Total Citizen Population (CITZ) 672,352 100.00% CITZ Hispanic or Latino 262,661 39.07% CITZ Not Hispanic or Latino (NH) 409,610 60.92% CITZ NH White alone 317,108 47.16% CITZ NH Black or African American Alone 17,946 2.67% CITZ NH Asian Alone 48,123 7.16% CITZ NH American Indian and Alaska Native Alone 1,165 0.17% CITZ NH Native Hawaiian and Other Pacific Islander alone 882 0.13% CITZ NH Black or African American and White 4,115 0.61% CITZ NH American Indian or Alaska Native and White 12,064 1.79% CITZ NH Asian and White 3,465 0.52% CITZ NH American Indian or Alaska Native and Black or African American 176 0.03% CITZ NH Remainder of Two or More Race 4,324 0.64% CITZ DOJ NH Black or African American 22,061 3.28% CITZ DOJ NH Asian 60,187 8.95% CITZ DOJ NH American Indian and Alaska Native 4,630 0.69%
2019-2023 ACS Citizen Voting Age Population (adj Elec. §21003 - SWDB 7/16/2025) Name Count Percent Total Citizen Voting Age Population (CVAP) 503,784 100.00% CVAP Hispanic or Latino 170,702 33.88% CVAP Not Hispanic or Latino (NH) 333,048 66.11% CVAP NH White alone 264,351 52.47% CVAP NH Black or African American Alone 14,010 2.78% CVAP NH Asian Alone 37,977 7.54% CVAP NH American Indian and Alaska Native Alone 1,030 0.20% CVAP NH Native Hawaiian and Other Pacific Islander alone 644 0.13% CVAP NH Black or African American and White 2,265 0.45% CVAP NH Asian and White 6,679 1.33% CVAP NH American Indian or Alaska Native and White 2,831 0.56% CVAP NH American Indian or Alaska Native and Black or African American 161 0.03% CVAP NH Remainder of Two or More Race 2,844 0.56% CVAP DOJ NH Black or African American 16,275 3.23% CVAP DOJ NH Asian 44,656 8.86% CVAP DOJ NH American Indian and Alaska Native 3,861 0.77%
Counties In District Name Count Percent Los Angeles 179,462 1.79% Ventura 580,607 68.68%
Places In District Name Count Percent LOS ANGELES: Agoura Hills(C) 20,346 100.00% LOS ANGELES: Calabasas(C) 23,280 100.00% LOS ANGELES: Castaic(U) 18,970 100.00% LOS ANGELES: Elizabeth Lake(U) 1,652 100.00% LOS ANGELES: Hasley Canyon(U) 1,196 100.00% LOS ANGELES: Hidden Hills(C) 1,732 100.00% LOS ANGELES: Lake Hughes(U) 551 100.00% LOS ANGELES: Lancaster(C) 8,782 5.12% LOS ANGELES: Los Angeles(C) 70,515 1.80% LOS ANGELES: Quartz Hill(U) 11,482 100.00% LOS ANGELES: Val Verde(U) 2,411 100.00% LOS ANGELES: Westlake Village(C) 8,047 100.00% LOS ANGELES: Remainder of Los Angeles(R) 10,498 11.98% VENTURA: Bell Canyon(U) 1,947 100.00% VENTURA: Camarillo(C) 70,850 100.00% VENTURA: Casa Conejo(U) 3,270 100.00% VENTURA: Channel Islands Beach(U) 2,878 100.00% VENTURA: El Rio(U) 7,069 100.00% VENTURA: Fillmore(C) 16,462 100.00% VENTURA: Lake Sherwood(U) 1,760 100.00% VENTURA: Meiners Oaks(U) 3,921 100.00% VENTURA: Moorpark(C) 36,326 100.00% VENTURA: Oak Park(U) 13,913 100.00% VENTURA: Oxnard(C) 202,614 100.00% VENTURA: Piru(U) 2,592 100.00% VENTURA: Port Hueneme(C) 22,029 100.00% VENTURA: Santa Paula(C) 30,772 100.00% VENTURA: Santa Rosa Valley(U) 3,314 100.00% VENTURA: Somis(U) 1,432 100.00% VENTURA: Thousand Oaks(C) 127,134 100.00% VENTURA: Remainder of Ventura(R) 32,324 87.53%
Senate Office of Demographics 02/2026