This Congressional district was established by the voters of California with the passage of Proposition 50 (2025) on November 4, 2025 and will go into effect after the November 2026 elections and upon seating of the 120th Congress, January 3, 2027. This district will stay in use until the California Citizens Redistricting Commission draws new maps following the 2030 U.S. Census .
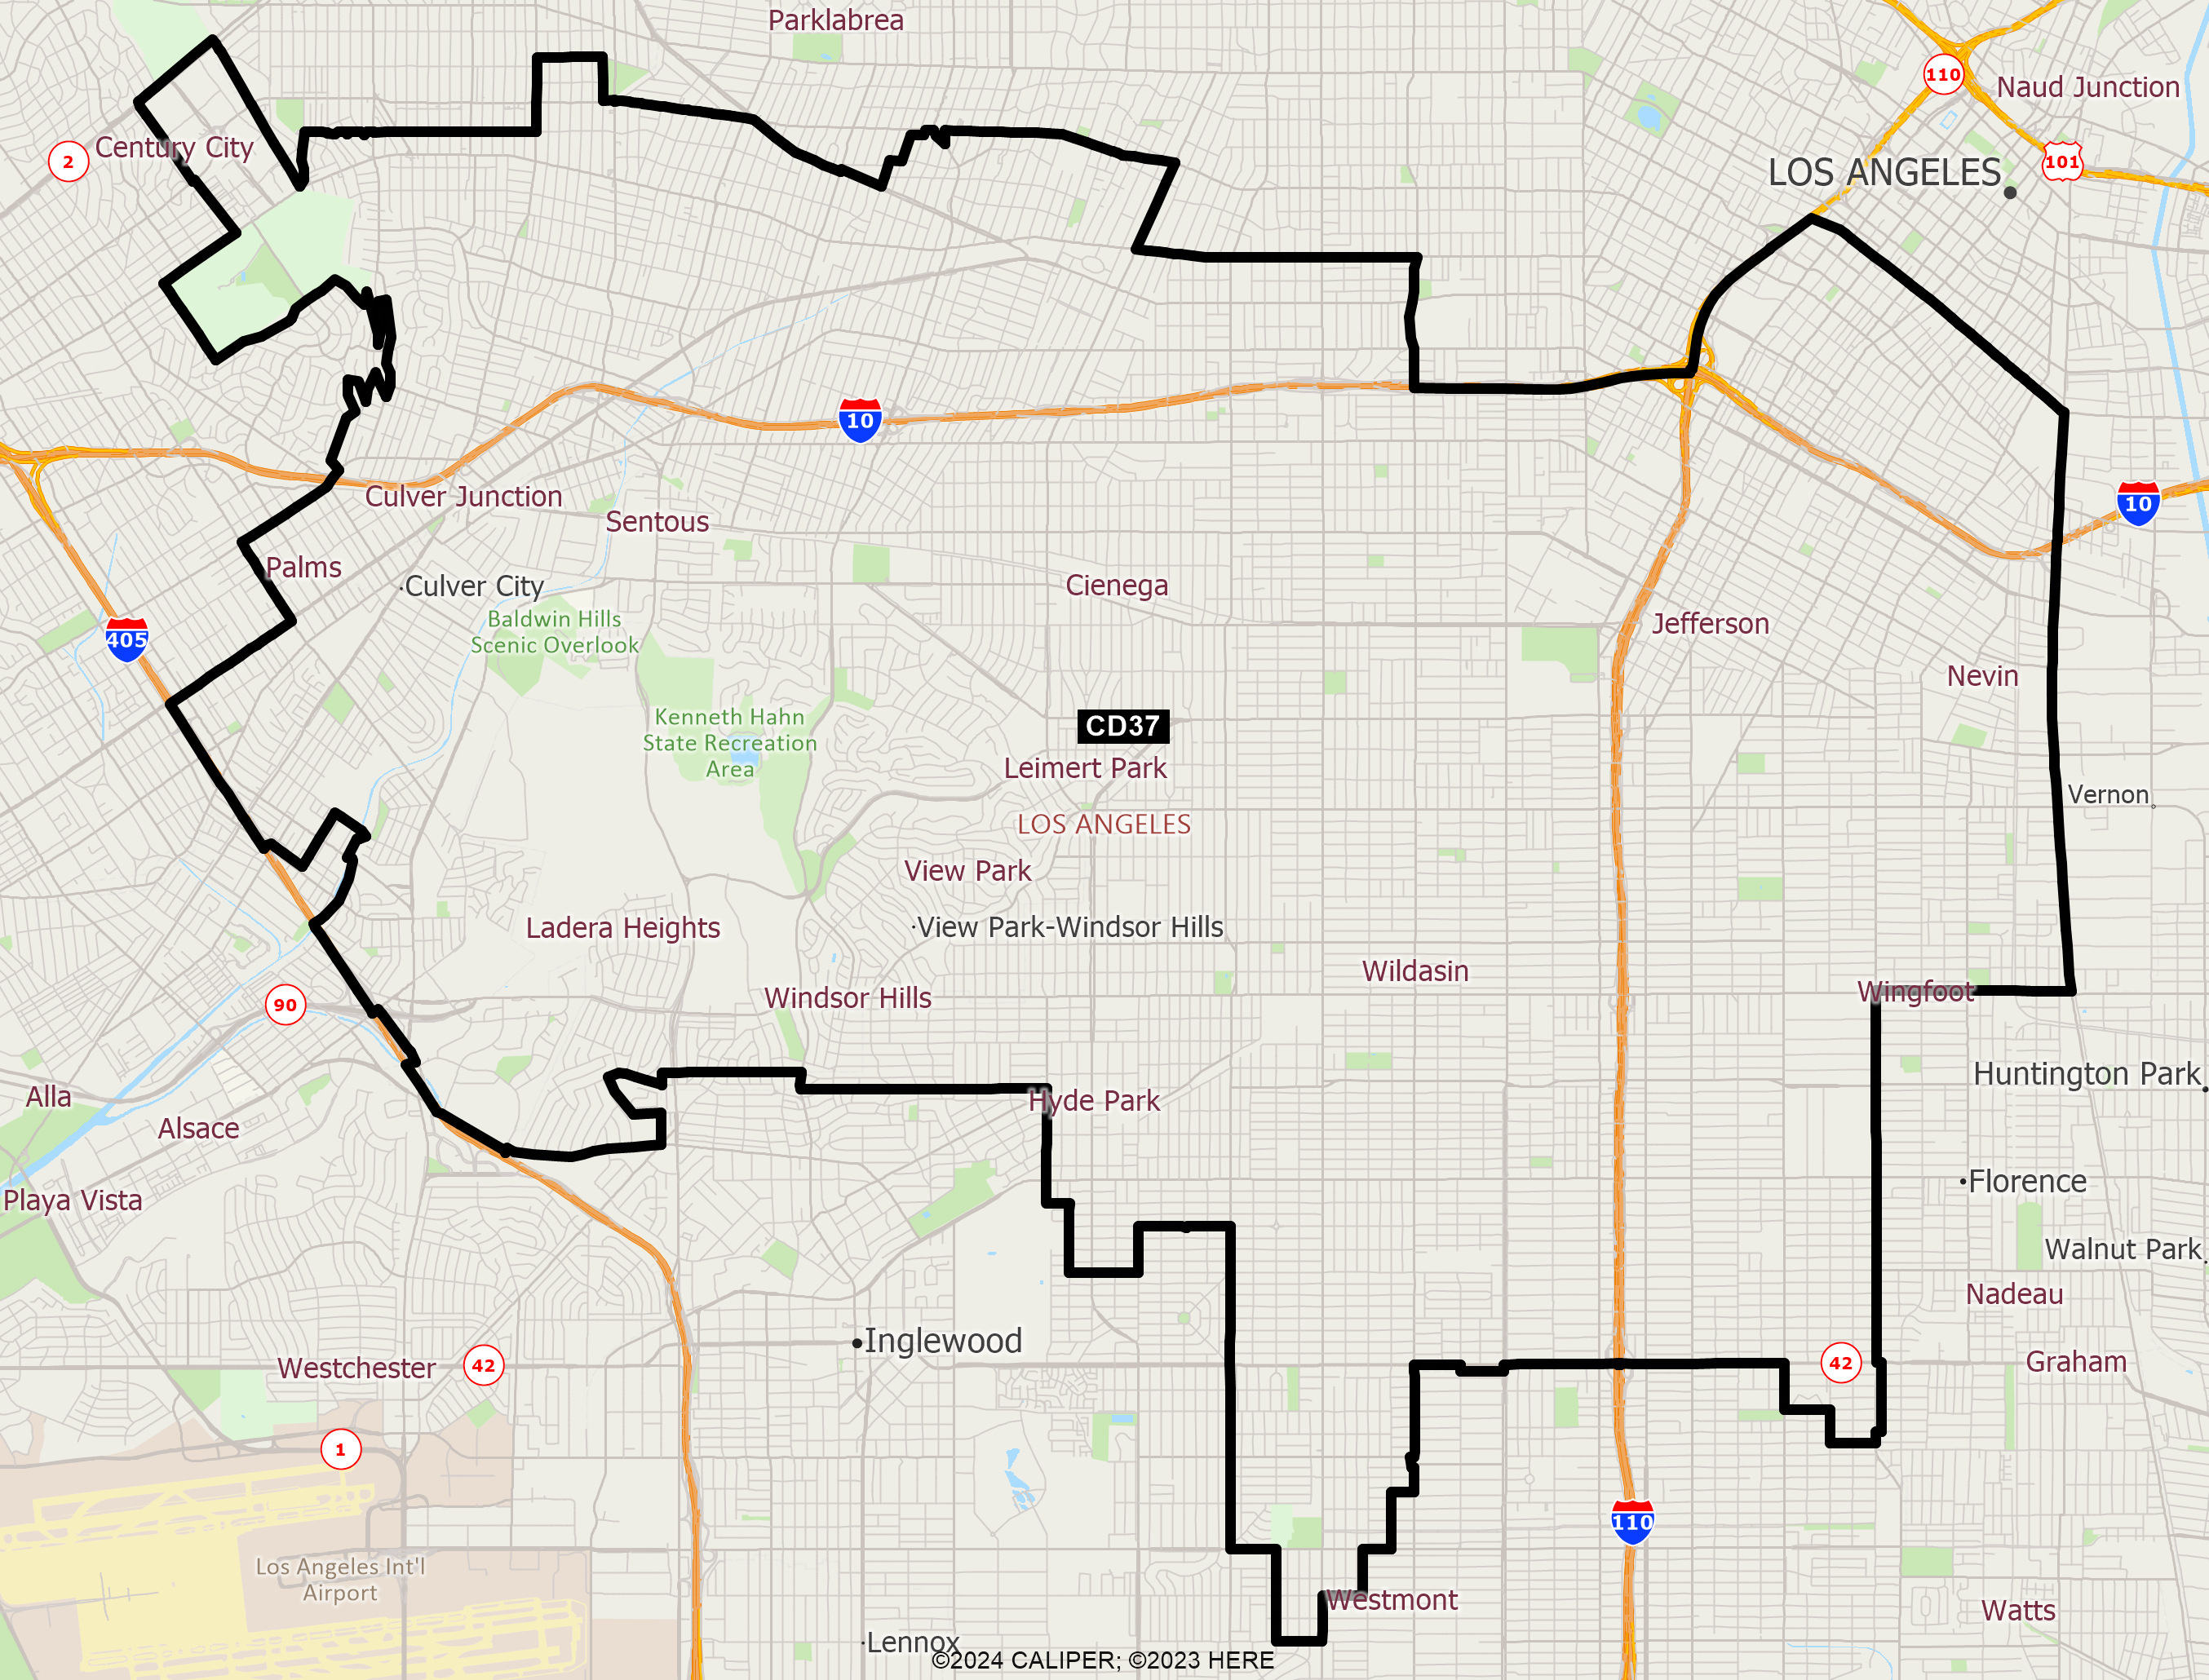
DISTRICT CD37
2020 Census Population (adj Elec. §21003 - SWDB 9/27/2021) Name Count Percent Total Population (POP) 760,066 100.00% POP Hispanic or Latino 409,691 53.90% POP Not Hispanic or Latino (NH) 350,375 46.10% POP NH Population of one race 326,347 42.94% POP NH White alone 99,490 13.09% POP NH Black or African American alone 171,387 22.55% POP NH Asian alone 47,245 6.22% POP NH American Indian and Alaska Native alone 1,227 0.16% POP NH Native Hawaiian and Other Pacific Islander alone 698 0.09% POP NH Some Other Race alone 6,300 0.83% POP NH Population of two or more races 24,028 3.16% POP DOJ NH Black or African American 176,482 23.22% POP DOJ NH Asian 52,502 6.91% POP DOJ NH American Indian and Alaska Native 2,362 0.31% POP DOJ NH Native Hawaiian and Other Pacific Islander 911 0.12% POP DOJ NH Some Other Race 8,255 1.09% POP DOJ NH Balance of Population of two or more races 10,373 1.36%
2020 Census Voting Age Population (adj Elec. §21003 - SWDB 9/27/2021) Name Count Percent Total Voting Age Population (VAP) 597,024 100.00% VAP Hispanic or Latino 299,770 50.21% VAP Not Hispanic or Latino (NH) 297,254 49.79% VAP NH Population of one race 279,002 46.73% VAP NH White alone 86,609 14.51% VAP NH Black or African American alone 142,690 23.90% VAP NH Asian alone 43,366 7.26% VAP NH American Indian and Alaska Native alone 1,047 0.18% VAP NH Native Hawaiian and Other Pacific Islander alone 570 0.10% VAP NH Some Other Race alone 4,720 0.79% VAP NH Population of two or more races 18,252 3.06% VAP DOJ NH Black or African American 146,583 24.55% VAP DOJ NH Asian 46,872 7.85% VAP DOJ NH American Indian and Alaska Native 1,993 0.33% VAP DOJ NH Native Hawaiian and Other Pacific Islander 727 0.12% VAP DOJ NH Some Other Race 6,213 1.04% VAP DOJ NH Balance of Population of two or more races 8,257 1.38%
2020 Census Housing Occupancy Status Name Count Percent Total Housing Units 269,162 100.00% Occupied 251,800 93.55% Vacant 17,362 6.45%
2020 Census Group Quarters Population (adj Elec. §21003 - SWDB 9/27/2021) Name Count Percent Total Group Quarters Population: 22,008 100.00% Institutionalized population: 2,552 11.60% Correctional facilities for adults 97 0.44% Juvenile facilities 214 0.97% Nursing facilities/Skilled-nursing facilities 2,135 9.70% Other institutional facilities 106 0.48% Noninstitutionalized population: 19,456 88.40% College/University student housing 8,209 37.30% Military quarters 0 0.00% Other noninstitutional facilities 11,247 51.10%
2019-2023 ACS Citizen Population (adj Elec. §21003 - SWDB 7/16/2025) Name Count Percent Total Citizen Population (CITZ) 592,625 100.00% CITZ Hispanic or Latino 279,148 47.10% CITZ Not Hispanic or Latino (NH) 313,435 52.89% CITZ NH White alone 92,747 15.65% CITZ NH Black or African American Alone 168,031 28.35% CITZ NH Asian Alone 33,385 5.63% CITZ NH American Indian and Alaska Native Alone 804 0.14% CITZ NH Native Hawaiian and Other Pacific Islander alone 816 0.14% CITZ NH Black or African American and White 5,322 0.90% CITZ NH American Indian or Alaska Native and White 5,901 1.00% CITZ NH Asian and White 875 0.15% CITZ NH American Indian or Alaska Native and Black or African American 1,513 0.26% CITZ NH Remainder of Two or More Race 4,098 0.69% CITZ DOJ NH Black or African American 173,353 29.25% CITZ DOJ NH Asian 39,286 6.63% CITZ DOJ NH American Indian and Alaska Native 1,679 0.28%
2019-2023 ACS Citizen Voting Age Population (adj Elec. §21003 - SWDB 7/16/2025) Name Count Percent Total Citizen Voting Age Population (CVAP) 438,620 100.00% CVAP Hispanic or Latino 174,716 39.83% CVAP Not Hispanic or Latino (NH) 263,963 60.18% CVAP NH White alone 79,761 18.18% CVAP NH Black or African American Alone 140,332 31.99% CVAP NH Asian Alone 29,765 6.79% CVAP NH American Indian and Alaska Native Alone 684 0.16% CVAP NH Native Hawaiian and Other Pacific Islander alone 788 0.18% CVAP NH Black or African American and White 3,543 0.81% CVAP NH Asian and White 4,003 0.91% CVAP NH American Indian or Alaska Native and White 776 0.18% CVAP NH American Indian or Alaska Native and Black or African American 1,329 0.30% CVAP NH Remainder of Two or More Race 2,959 0.67% CVAP DOJ NH Black or African American 143,875 32.80% CVAP DOJ NH Asian 33,768 7.70% CVAP DOJ NH American Indian and Alaska Native 1,460 0.33%
Counties In District Name Count Percent Los Angeles 760,070 7.56%
Places In District Name Count Percent LOS ANGELES: Culver City(C) 34,959 85.49% LOS ANGELES: Ladera Heights(U) 6,673 100.00% LOS ANGELES: Los Angeles(C) 706,973 18.07% LOS ANGELES: View Park-Windsor Hills(U) 11,465 100.00% LOS ANGELES: Remainder of Los Angeles(R) 0 0.00%
Senate Office of Demographics 02/2026