This Congressional district was established by the voters of California with the passage of Proposition 50 (2025) on November 4, 2025 and will go into effect after the November 2026 elections and upon seating of the 120th Congress, January 3, 2027. This district will stay in use until the California Citizens Redistricting Commission draws new maps following the 2030 U.S. Census .
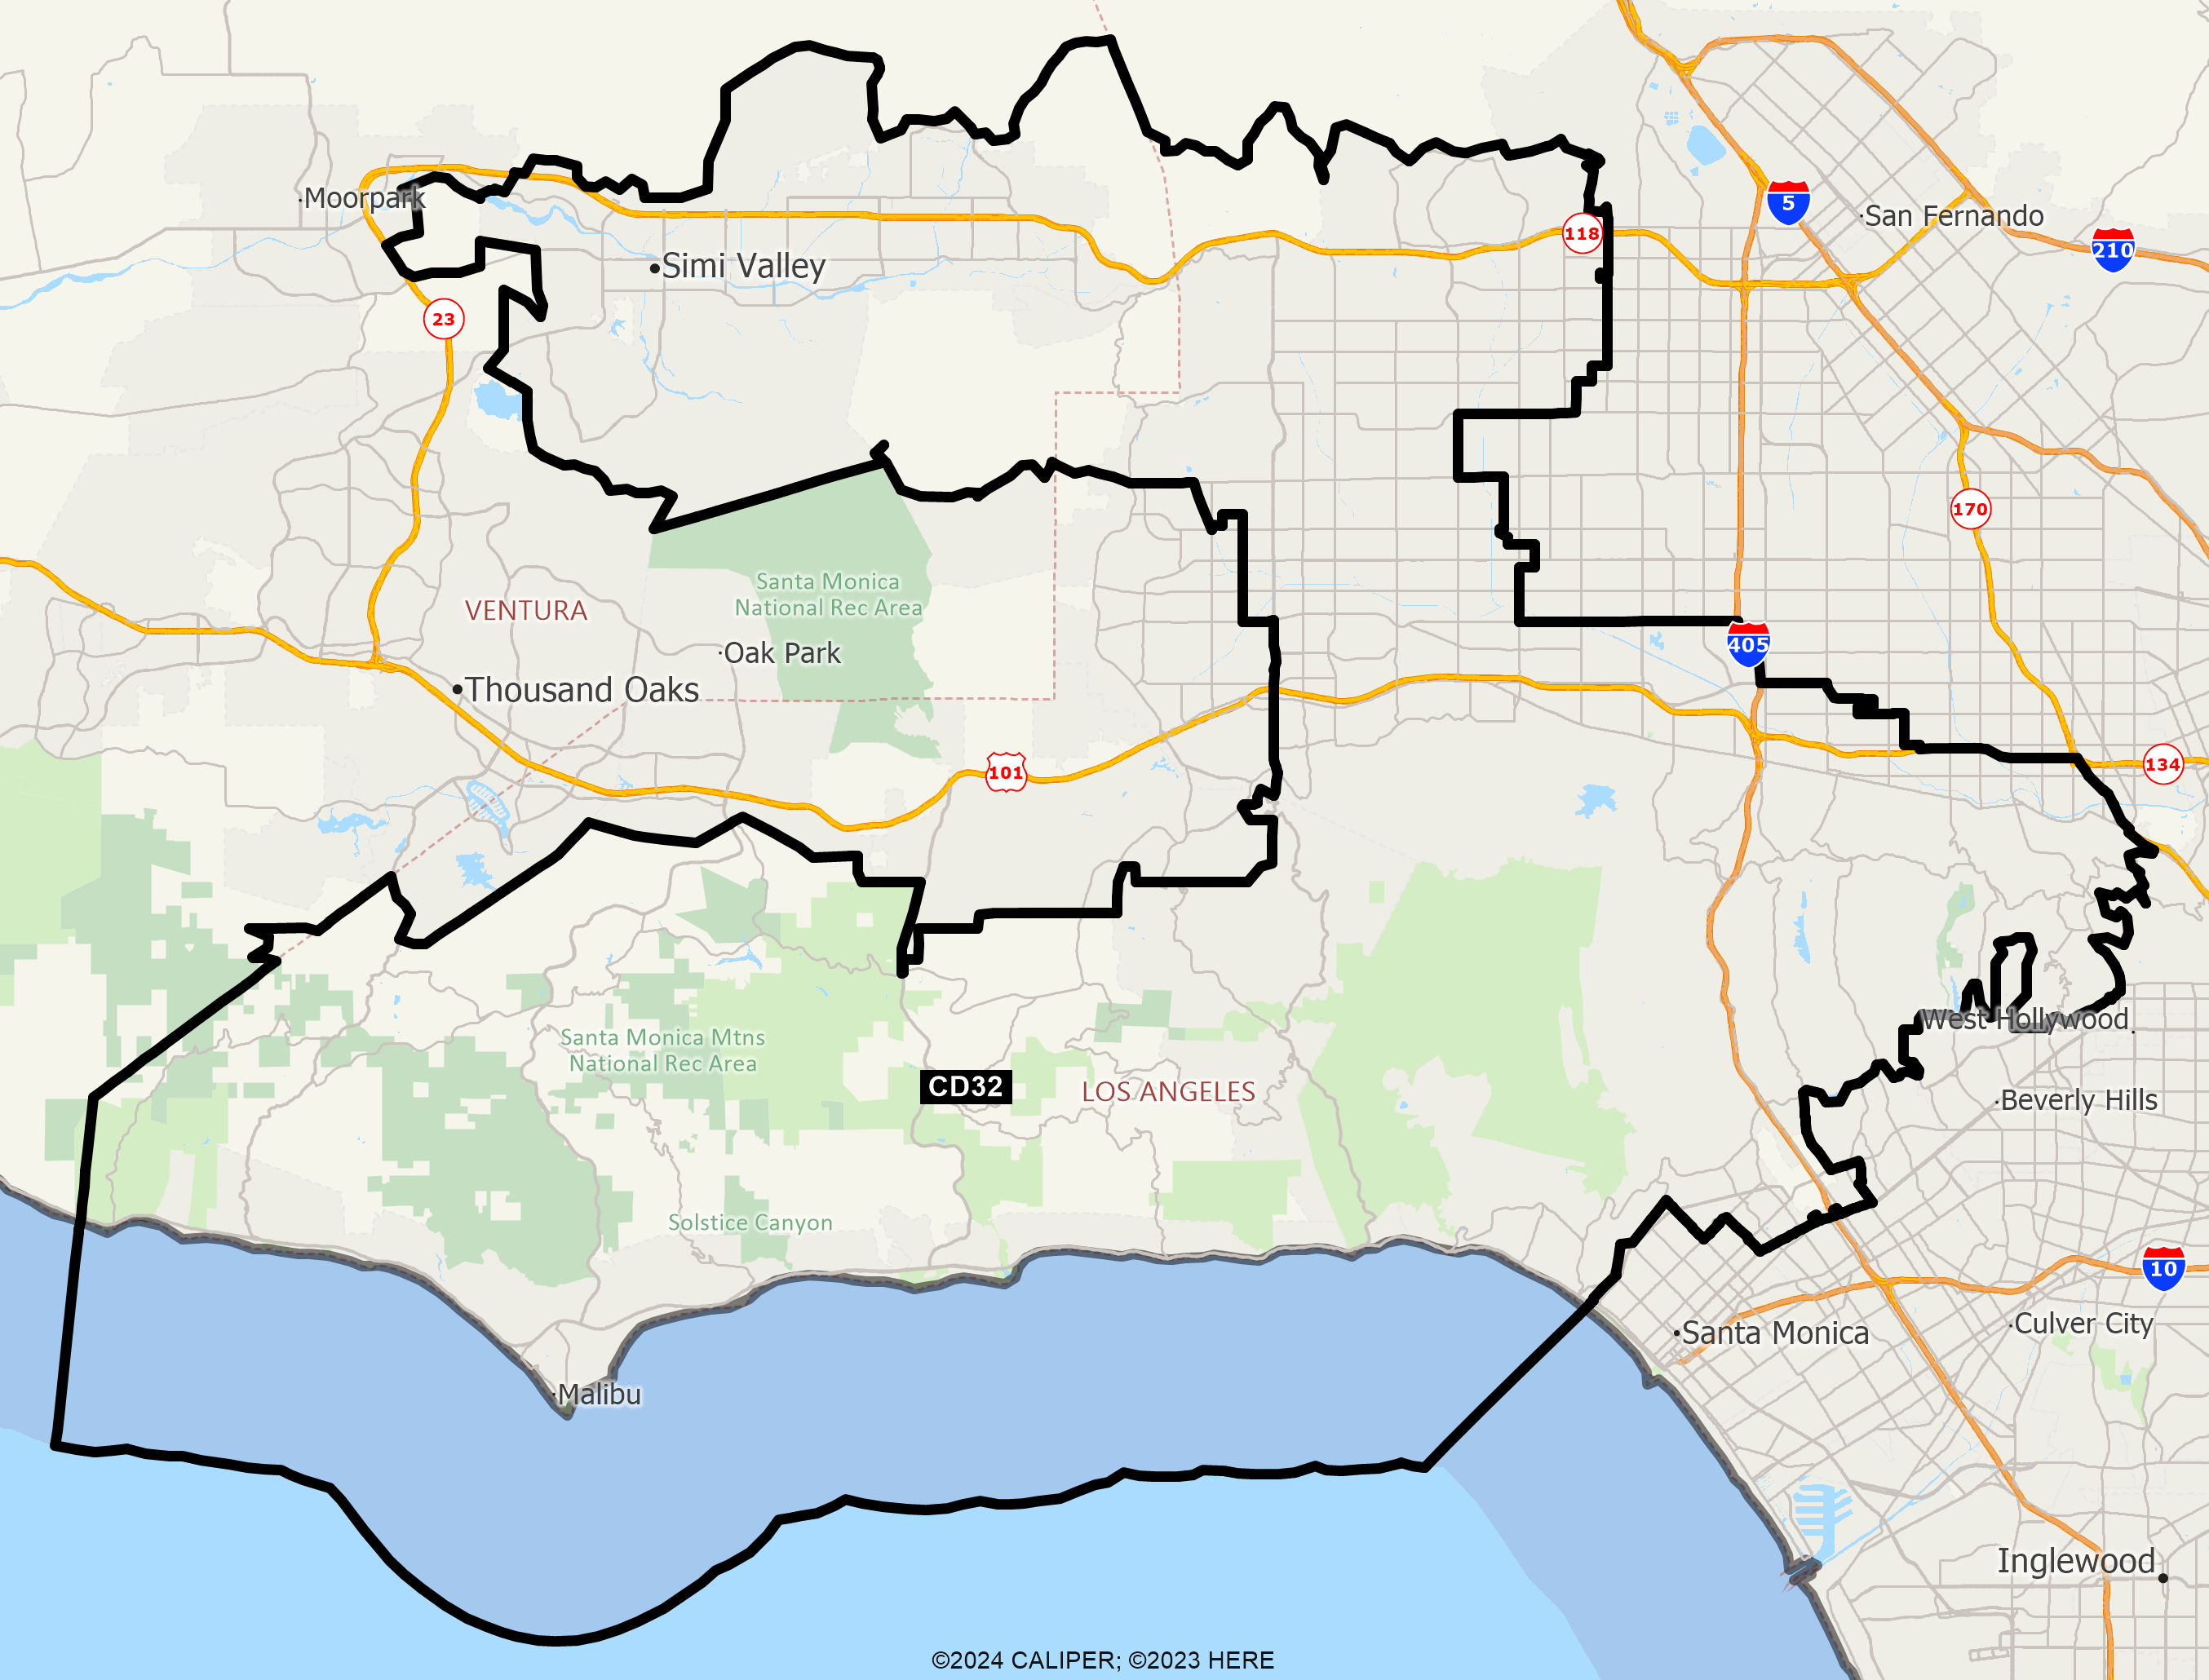
DISTRICT CD32
2020 Census Population (adj Elec. §21003 - SWDB 9/27/2021) Name Count Percent Total Population (POP) 760,065 100.00% POP Hispanic or Latino 189,453 24.93% POP Not Hispanic or Latino (NH) 570,612 75.07% POP NH Population of one race 535,474 70.45% POP NH White alone 405,502 53.35% POP NH Black or African American alone 27,986 3.68% POP NH Asian alone 94,693 12.46% POP NH American Indian and Alaska Native alone 1,231 0.16% POP NH Native Hawaiian and Other Pacific Islander alone 775 0.10% POP NH Some Other Race alone 5,287 0.70% POP NH Population of two or more races 35,138 4.62% POP DOJ NH Black or African American 33,155 4.36% POP DOJ NH Asian 109,936 14.46% POP DOJ NH American Indian and Alaska Native 4,730 0.62% POP DOJ NH Native Hawaiian and Other Pacific Islander 1,247 0.16% POP DOJ NH Some Other Race 10,925 1.44% POP DOJ NH Balance of Population of two or more races 5,117 0.67%
2020 Census Voting Age Population (adj Elec. §21003 - SWDB 9/27/2021) Name Count Percent Total Voting Age Population (VAP) 620,583 100.00% VAP Hispanic or Latino 141,770 22.84% VAP Not Hispanic or Latino (NH) 478,813 77.16% VAP NH Population of one race 454,693 73.27% VAP NH White alone 345,901 55.74% VAP NH Black or African American alone 23,730 3.82% VAP NH Asian alone 79,592 12.83% VAP NH American Indian and Alaska Native alone 1,013 0.16% VAP NH Native Hawaiian and Other Pacific Islander alone 621 0.10% VAP NH Some Other Race alone 3,836 0.62% VAP NH Population of two or more races 24,120 3.89% VAP DOJ NH Black or African American 27,104 4.37% VAP DOJ NH Asian 89,091 14.36% VAP DOJ NH American Indian and Alaska Native 3,939 0.63% VAP DOJ NH Native Hawaiian and Other Pacific Islander 975 0.16% VAP DOJ NH Some Other Race 8,208 1.32% VAP DOJ NH Balance of Population of two or more races 3,595 0.58%
2020 Census Housing Occupancy Status Name Count Percent Total Housing Units 307,617 100.00% Occupied 290,618 94.47% Vacant 16,999 5.53%
2020 Census Group Quarters Population (adj Elec. §21003 - SWDB 9/27/2021) Name Count Percent Total Group Quarters Population: 12,165 100.00% Institutionalized population: 3,426 28.16% Correctional facilities for adults 22 0.18% Juvenile facilities 103 0.85% Nursing facilities/Skilled-nursing facilities 3,138 25.80% Other institutional facilities 163 1.34% Noninstitutionalized population: 8,739 71.84% College/University student housing 4,947 40.67% Military quarters 0 0.00% Other noninstitutional facilities 3,792 31.17%
2019-2023 ACS Citizen Population (adj Elec. §21003 - SWDB 7/16/2025) Name Count Percent Total Citizen Population (CITZ) 686,989 100.00% CITZ Hispanic or Latino 153,295 22.31% CITZ Not Hispanic or Latino (NH) 533,861 77.71% CITZ NH White alone 392,641 57.15% CITZ NH Black or African American Alone 29,505 4.29% CITZ NH Asian Alone 79,215 11.53% CITZ NH American Indian and Alaska Native Alone 1,120 0.16% CITZ NH Native Hawaiian and Other Pacific Islander alone 752 0.11% CITZ NH Black or African American and White 7,716 1.12% CITZ NH American Indian or Alaska Native and White 15,931 2.32% CITZ NH Asian and White 2,681 0.39% CITZ NH American Indian or Alaska Native and Black or African American 367 0.05% CITZ NH Remainder of Two or More Race 3,948 0.57% CITZ DOJ NH Black or African American 37,221 5.42% CITZ DOJ NH Asian 95,146 13.85% CITZ DOJ NH American Indian and Alaska Native 3,801 0.55%
2019-2023 ACS Citizen Voting Age Population (adj Elec. §21003 - SWDB 7/16/2025) Name Count Percent Total Citizen Voting Age Population (CVAP) 548,661 100.00% CVAP Hispanic or Latino 110,131 20.07% CVAP Not Hispanic or Latino (NH) 438,626 79.94% CVAP NH White alone 329,549 60.06% CVAP NH Black or African American Alone 24,884 4.54% CVAP NH Asian Alone 64,245 11.71% CVAP NH American Indian and Alaska Native Alone 1,010 0.18% CVAP NH Native Hawaiian and Other Pacific Islander alone 647 0.12% CVAP NH Black or African American and White 4,501 0.82% CVAP NH Asian and White 9,039 1.65% CVAP NH American Indian or Alaska Native and White 2,216 0.40% CVAP NH American Indian or Alaska Native and Black or African American 308 0.06% CVAP NH Remainder of Two or More Race 2,336 0.43% CVAP DOJ NH Black or African American 29,385 5.36% CVAP DOJ NH Asian 73,284 13.36% CVAP DOJ NH American Indian and Alaska Native 3,226 0.59%
Counties In District Name Count Percent Los Angeles 630,481 6.27% Ventura 129,590 15.33%
Places In District Name Count Percent LOS ANGELES: Los Angeles(C) 598,272 15.29% LOS ANGELES: Malibu(C) 10,674 100.00% LOS ANGELES: Pepperdine University(U) 2,748 100.00% LOS ANGELES: Topanga(U) 8,576 100.00% LOS ANGELES: Remainder of Los Angeles(R) 10,211 11.65% VENTURA: Santa Susana(U) 1,162 100.00% VENTURA: Simi Valley(C) 126,360 100.00% VENTURA: Remainder of Ventura(R) 2,068 5.60%
Senate Office of Demographics 02/2026