This Congressional district was established by the voters of California with the passage of Proposition 50 (2025) on November 4, 2025 and will go into effect after the November 2026 elections and upon seating of the 120th Congress, January 3, 2027. This district will stay in use until the California Citizens Redistricting Commission draws new maps following the 2030 U.S. Census .
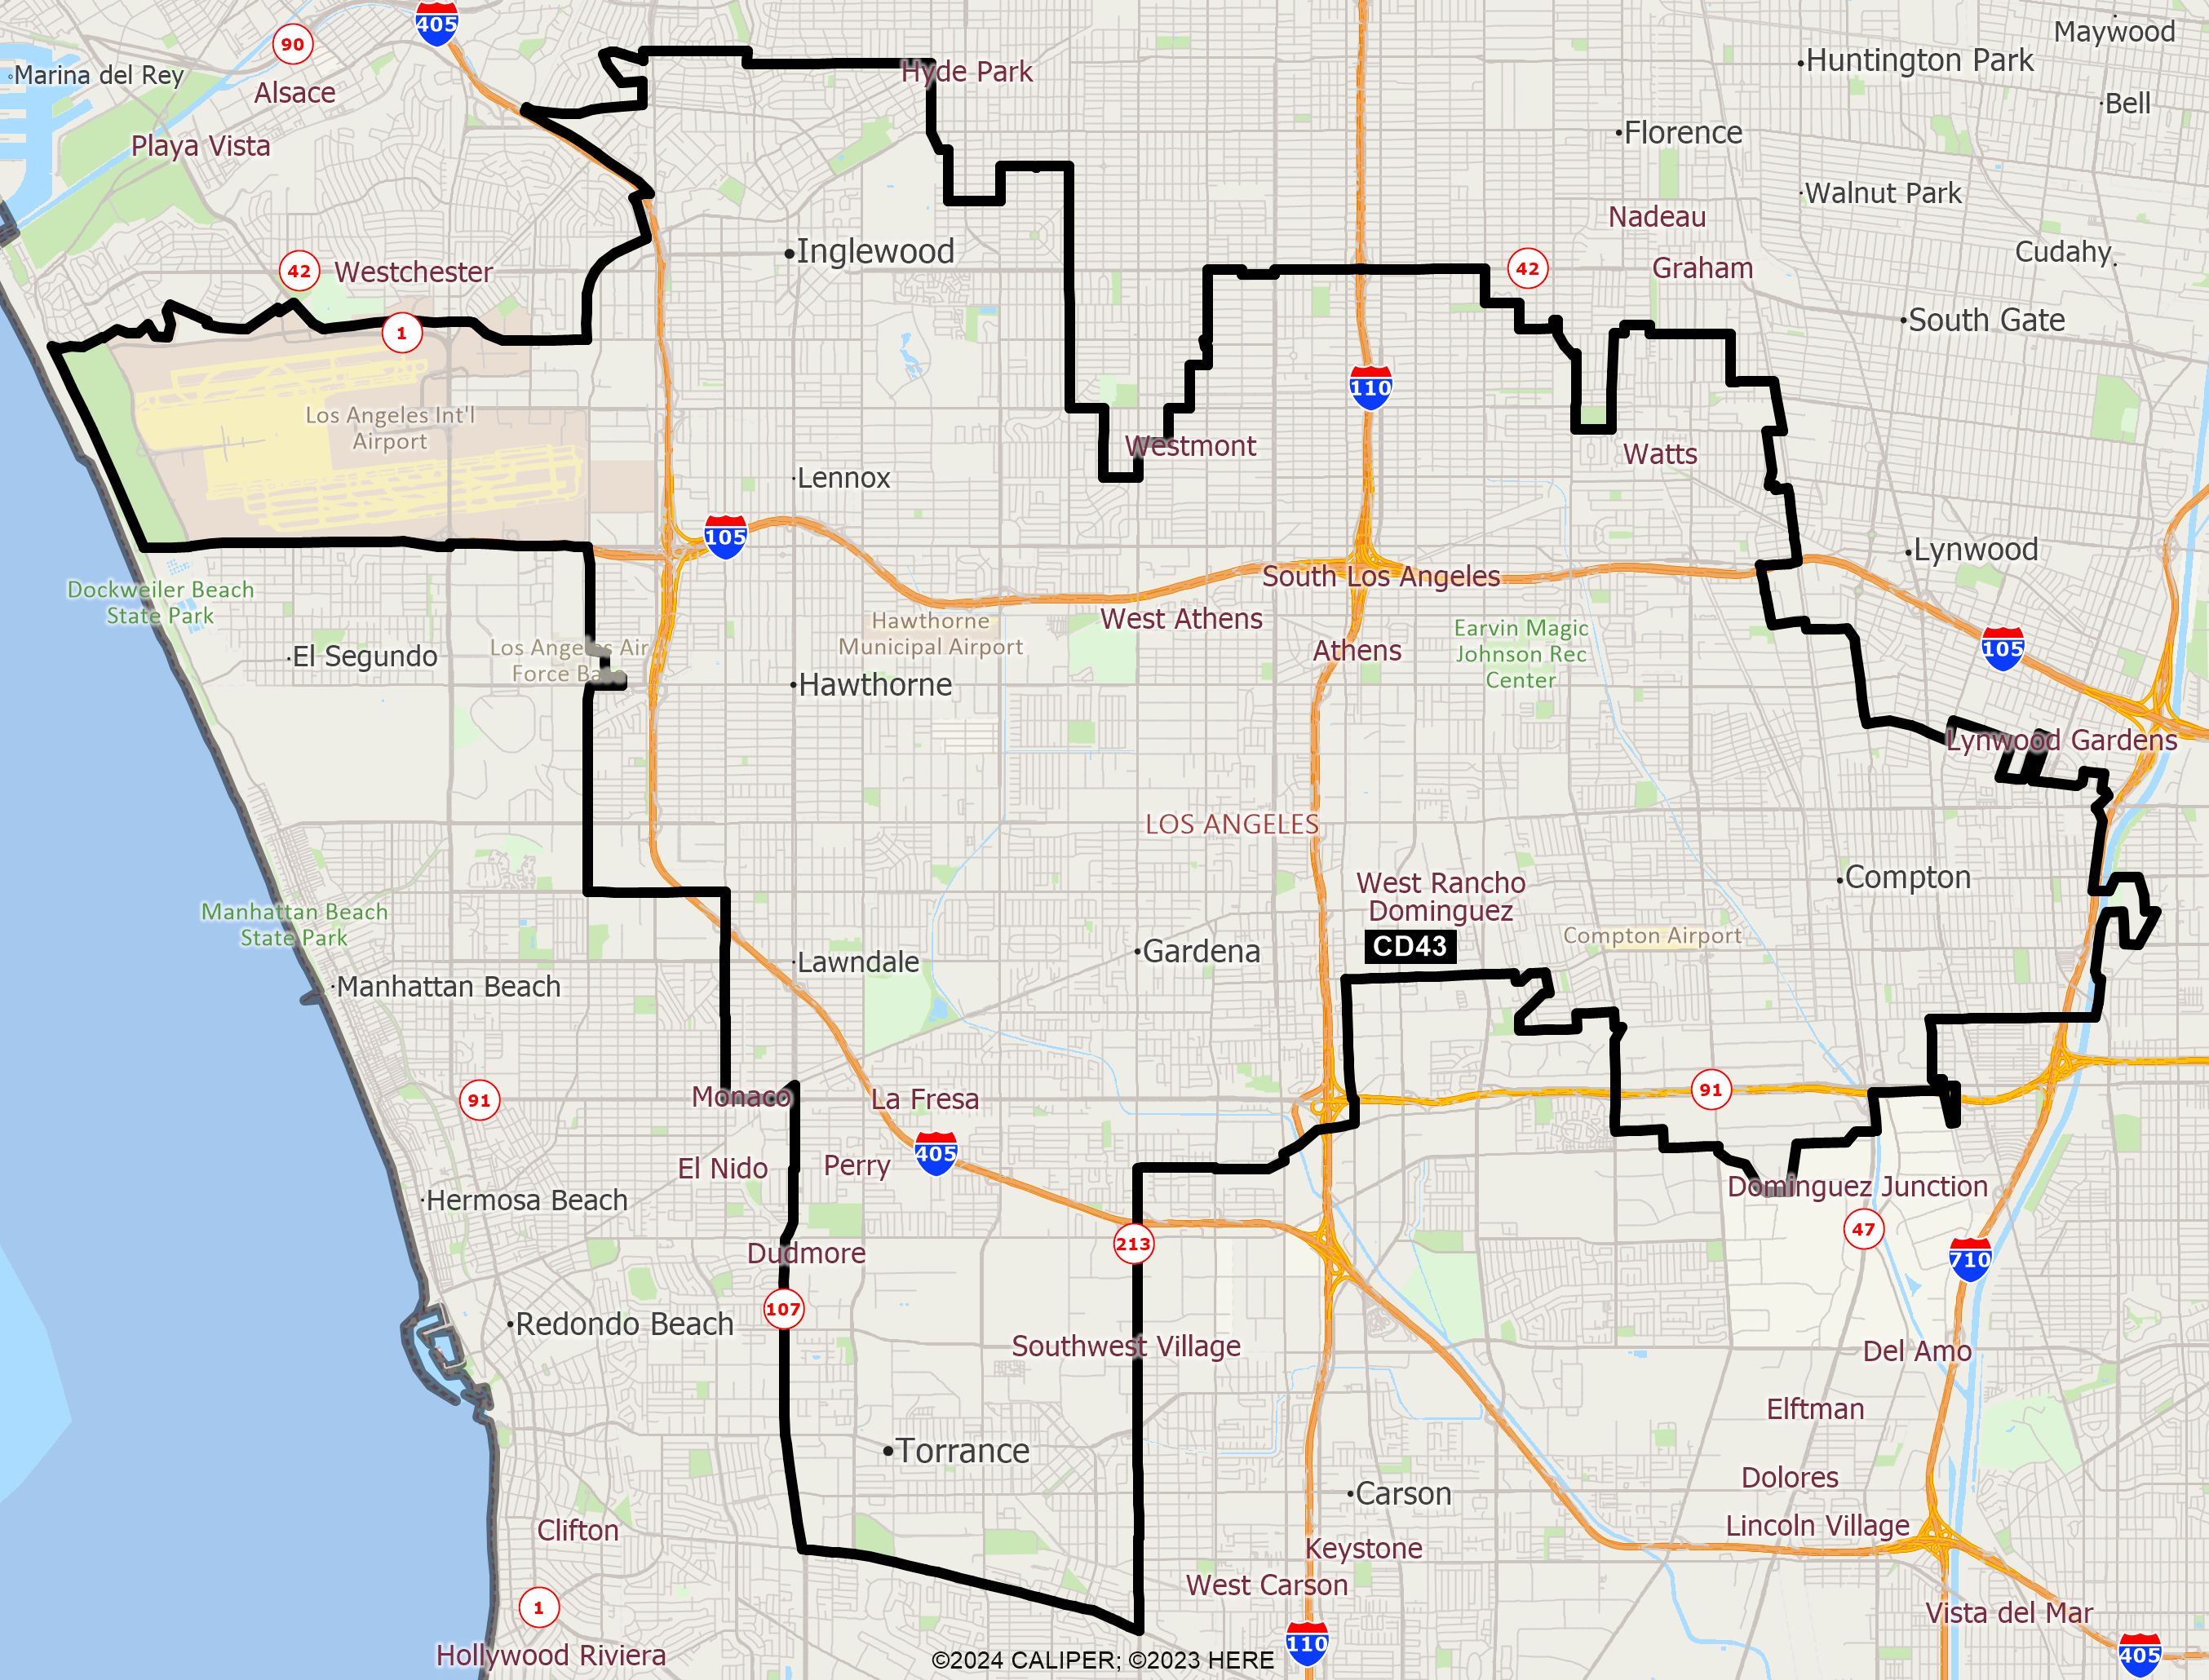
DISTRICT CD43
2020 Census Population (adj Elec. §21003 - SWDB 9/27/2021) Name Count Percent Total Population (POP) 760,067 100.00% POP Hispanic or Latino 433,512 57.04% POP Not Hispanic or Latino (NH) 326,555 42.96% POP NH Population of one race 306,715 40.35% POP NH White alone 52,450 6.90% POP NH Black or African American alone 182,478 24.01% POP NH Asian alone 62,451 8.22% POP NH American Indian and Alaska Native alone 1,174 0.15% POP NH Native Hawaiian and Other Pacific Islander alone 3,138 0.41% POP NH Some Other Race alone 5,024 0.66% POP NH Population of two or more races 19,840 2.61% POP DOJ NH Black or African American 186,476 24.53% POP DOJ NH Asian 66,639 8.77% POP DOJ NH American Indian and Alaska Native 2,191 0.29% POP DOJ NH Native Hawaiian and Other Pacific Islander 3,422 0.45% POP DOJ NH Some Other Race 6,421 0.84% POP DOJ NH Balance of Population of two or more races 8,956 1.18%
2020 Census Voting Age Population (adj Elec. §21003 - SWDB 9/27/2021) Name Count Percent Total Voting Age Population (VAP) 574,835 100.00% VAP Hispanic or Latino 309,772 53.89% VAP Not Hispanic or Latino (NH) 265,063 46.11% VAP NH Population of one race 250,927 43.65% VAP NH White alone 45,569 7.93% VAP NH Black or African American alone 145,342 25.28% VAP NH Asian alone 53,186 9.25% VAP NH American Indian and Alaska Native alone 900 0.16% VAP NH Native Hawaiian and Other Pacific Islander alone 2,433 0.42% VAP NH Some Other Race alone 3,497 0.61% VAP NH Population of two or more races 14,136 2.46% VAP DOJ NH Black or African American 148,139 25.77% VAP DOJ NH Asian 55,683 9.69% VAP DOJ NH American Indian and Alaska Native 1,745 0.30% VAP DOJ NH Native Hawaiian and Other Pacific Islander 2,630 0.46% VAP DOJ NH Some Other Race 4,586 0.80% VAP DOJ NH Balance of Population of two or more races 6,711 1.17%
2020 Census Housing Occupancy Status Name Count Percent Total Housing Units 241,137 100.00% Occupied 232,686 96.50% Vacant 8,451 3.50%
2020 Census Group Quarters Population (adj Elec. §21003 - SWDB 9/27/2021) Name Count Percent Total Group Quarters Population: 6,991 100.00% Institutionalized population: 2,554 36.53% Correctional facilities for adults 16 0.23% Juvenile facilities 185 2.65% Nursing facilities/Skilled-nursing facilities 2,304 32.96% Other institutional facilities 49 0.70% Noninstitutionalized population: 4,437 63.47% College/University student housing 65 0.93% Military quarters 0 0.00% Other noninstitutional facilities 4,372 62.54%
2019-2023 ACS Citizen Population (adj Elec. §21003 - SWDB 7/16/2025) Name Count Percent Total Citizen Population (CITZ) 606,401 100.00% CITZ Hispanic or Latino 319,116 52.62% CITZ Not Hispanic or Latino (NH) 287,411 47.40% CITZ NH White alone 50,397 8.31% CITZ NH Black or African American Alone 168,883 27.85% CITZ NH Asian Alone 49,374 8.14% CITZ NH American Indian and Alaska Native Alone 1,299 0.21% CITZ NH Native Hawaiian and Other Pacific Islander alone 1,615 0.27% CITZ NH Black or African American and White 4,287 0.71% CITZ NH American Indian or Alaska Native and White 4,664 0.77% CITZ NH Asian and White 725 0.12% CITZ NH American Indian or Alaska Native and Black or African American 1,024 0.17% CITZ NH Remainder of Two or More Race 5,101 0.84% CITZ DOJ NH Black or African American 173,170 28.56% CITZ DOJ NH Asian 54,038 8.91% CITZ DOJ NH American Indian and Alaska Native 2,024 0.33%
2019-2023 ACS Citizen Voting Age Population (adj Elec. §21003 - SWDB 7/16/2025) Name Count Percent Total Citizen Voting Age Population (CVAP) 434,357 100.00% CVAP Hispanic or Latino 201,766 46.45% CVAP Not Hispanic or Latino (NH) 232,619 53.55% CVAP NH White alone 43,711 10.06% CVAP NH Black or African American Alone 135,297 31.15% CVAP NH Asian Alone 40,643 9.36% CVAP NH American Indian and Alaska Native Alone 956 0.22% CVAP NH Native Hawaiian and Other Pacific Islander alone 1,170 0.27% CVAP NH Black or African American and White 2,891 0.67% CVAP NH Asian and White 2,916 0.67% CVAP NH American Indian or Alaska Native and White 574 0.13% CVAP NH American Indian or Alaska Native and Black or African American 895 0.21% CVAP NH Remainder of Two or More Race 3,441 0.79% CVAP DOJ NH Black or African American 138,188 31.81% CVAP DOJ NH Asian 43,559 10.03% CVAP DOJ NH American Indian and Alaska Native 1,530 0.35%
Counties In District Name Count Percent Los Angeles 760,070 7.56%
Places In District Name Count Percent LOS ANGELES: Alondra Park(U) 8,597 100.00% LOS ANGELES: Compton(C) 96,687 100.00% LOS ANGELES: Del Aire(U) 10,371 100.00% LOS ANGELES: East Rancho Dominguez(U) 15,221 100.00% LOS ANGELES: Gardena(C) 61,297 100.00% LOS ANGELES: Hawthorne(C) 88,501 100.00% LOS ANGELES: Inglewood(C) 108,396 100.00% LOS ANGELES: Lawndale(C) 31,930 100.00% LOS ANGELES: Lennox(U) 20,423 100.00% LOS ANGELES: Los Angeles(C) 156,201 3.99% LOS ANGELES: Torrance(C) 67,157 45.57% LOS ANGELES: West Athens(U) 9,477 100.00% LOS ANGELES: Westmont(U) 34,276 100.00% LOS ANGELES: West Rancho Dominguez(U) 24,572 100.00% LOS ANGELES: Willowbrook(U) 24,514 100.00% LOS ANGELES: Remainder of Los Angeles(R) 2,450 2.80%
Senate Office of Demographics 02/2026