This Congressional district was established by the voters of California with the passage of Proposition 50 (2025) on November 4, 2025 and will go into effect after the November 2026 elections and upon seating of the 120th Congress, January 3, 2027. This district will stay in use until the California Citizens Redistricting Commission draws new maps following the 2030 U.S. Census .
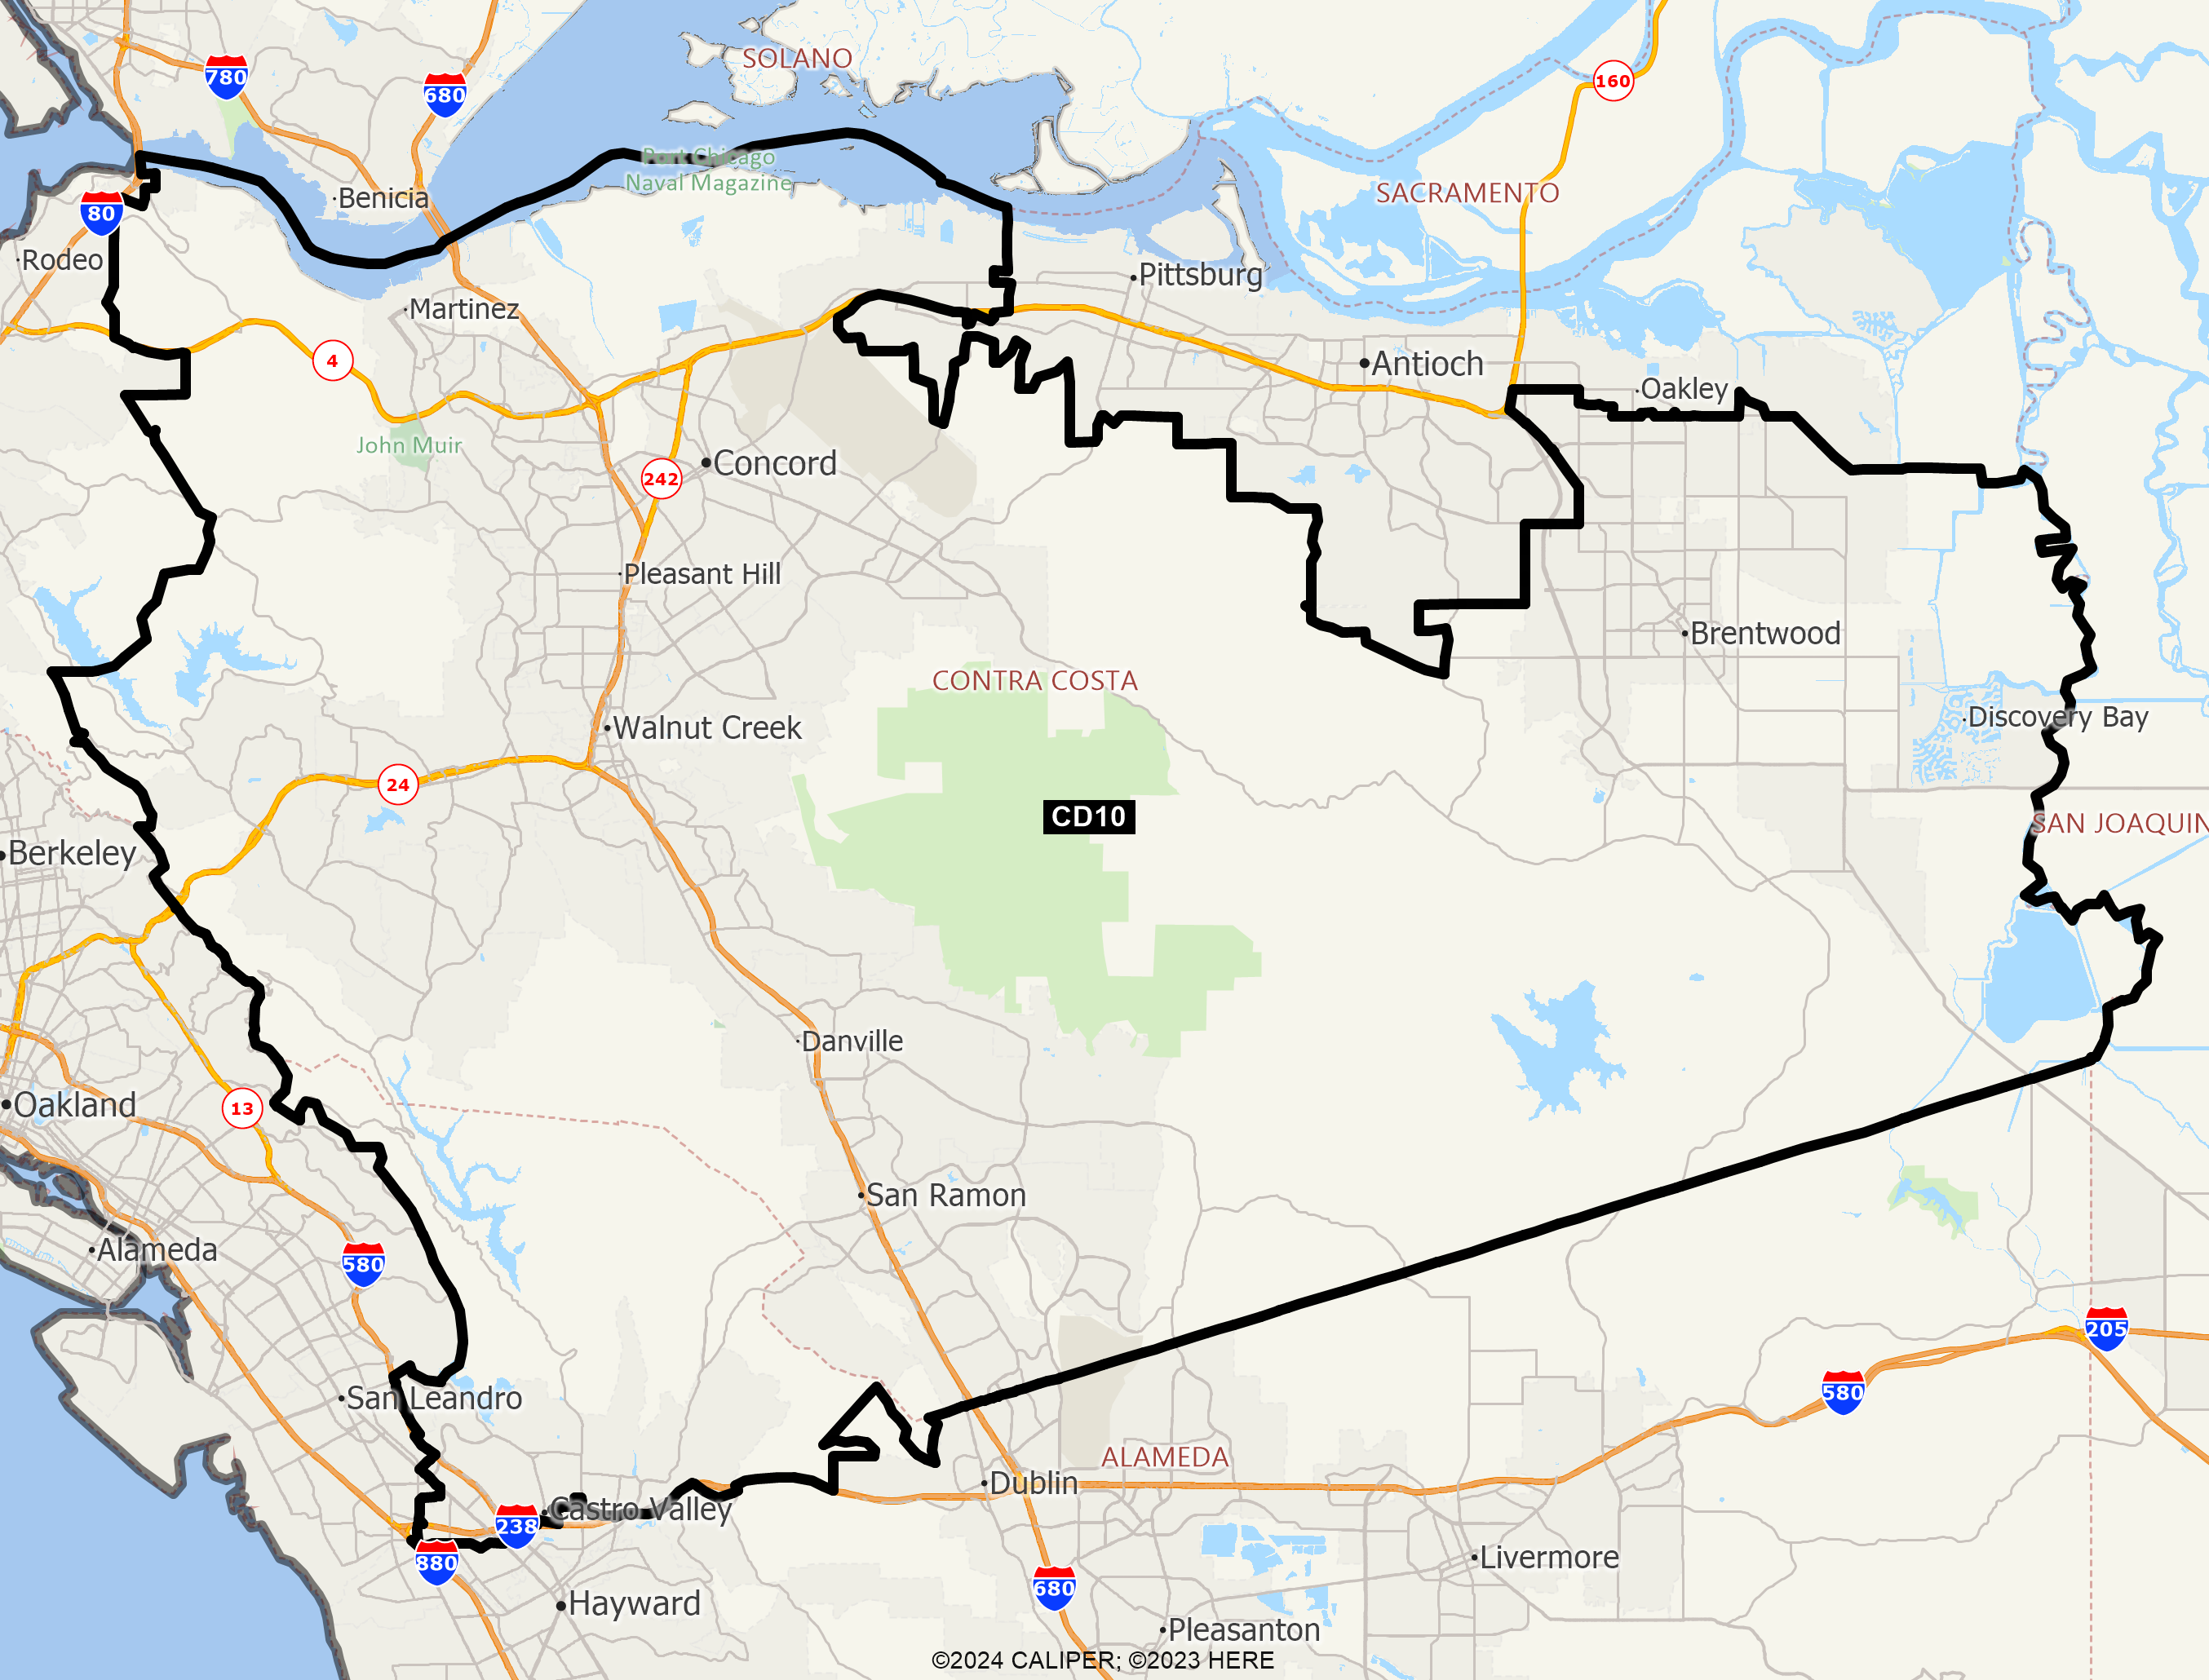
DISTRICT CD10
2020 Census Population (adj Elec. §21003 - SWDB 9/27/2021) Name Count Percent Total Population (POP) 760,066 100.00% POP Hispanic or Latino 151,209 19.89% POP Not Hispanic or Latino (NH) 608,857 80.11% POP NH Population of one race 563,022 74.08% POP NH White alone 374,313 49.25% POP NH Black or African American alone 29,209 3.84% POP NH Asian alone 150,844 19.85% POP NH American Indian and Alaska Native alone 1,463 0.19% POP NH Native Hawaiian and Other Pacific Islander alone 2,520 0.33% POP NH Some Other Race alone 4,673 0.61% POP NH Population of two or more races 45,835 6.03% POP DOJ NH Black or African American 33,965 4.47% POP DOJ NH Asian 171,698 22.59% POP DOJ NH American Indian and Alaska Native 7,366 0.97% POP DOJ NH Native Hawaiian and Other Pacific Islander 3,671 0.48% POP DOJ NH Some Other Race 10,791 1.42% POP DOJ NH Balance of Population of two or more races 7,053 0.93%
2020 Census Voting Age Population (adj Elec. §21003 - SWDB 9/27/2021) Name Count Percent Total Voting Age Population (VAP) 589,128 100.00% VAP Hispanic or Latino 105,666 17.94% VAP Not Hispanic or Latino (NH) 483,462 82.06% VAP NH Population of one race 456,487 77.49% VAP NH White alone 311,110 52.81% VAP NH Black or African American alone 22,821 3.87% VAP NH Asian alone 116,013 19.69% VAP NH American Indian and Alaska Native alone 1,184 0.20% VAP NH Native Hawaiian and Other Pacific Islander alone 2,031 0.34% VAP NH Some Other Race alone 3,328 0.56% VAP NH Population of two or more races 26,975 4.58% VAP DOJ NH Black or African American 25,468 4.32% VAP DOJ NH Asian 126,119 21.41% VAP DOJ NH American Indian and Alaska Native 5,855 0.99% VAP DOJ NH Native Hawaiian and Other Pacific Islander 2,871 0.49% VAP DOJ NH Some Other Race 7,771 1.32% VAP DOJ NH Balance of Population of two or more races 4,268 0.72%
2020 Census Housing Occupancy Status Name Count Percent Total Housing Units 286,215 100.00% Occupied 275,421 96.23% Vacant 10,794 3.77%
2020 Census Group Quarters Population (adj Elec. §21003 - SWDB 9/27/2021) Name Count Percent Total Group Quarters Population: 7,602 100.00% Institutionalized population: 3,533 46.47% Correctional facilities for adults 645 8.48% Juvenile facilities 136 1.79% Nursing facilities/Skilled-nursing facilities 2,651 34.87% Other institutional facilities 101 1.33% Noninstitutionalized population: 4,069 53.53% College/University student housing 1,419 18.67% Military quarters 0 0.00% Other noninstitutional facilities 2,650 34.86%
2019-2023 ACS Citizen Population (adj Elec. §21003 - SWDB 7/16/2025) Name Count Percent Total Citizen Population (CITZ) 685,275 100.00% CITZ Hispanic or Latino 124,550 18.18% CITZ Not Hispanic or Latino (NH) 560,790 81.83% CITZ NH White alone 363,609 53.06% CITZ NH Black or African American Alone 31,932 4.66% CITZ NH Asian Alone 125,505 18.31% CITZ NH American Indian and Alaska Native Alone 1,275 0.19% CITZ NH Native Hawaiian and Other Pacific Islander alone 1,666 0.24% CITZ NH Black or African American and White 4,993 0.73% CITZ NH American Indian or Alaska Native and White 20,374 2.97% CITZ NH Asian and White 3,567 0.52% CITZ NH American Indian or Alaska Native and Black or African American 820 0.12% CITZ NH Remainder of Two or More Race 7,079 1.03% CITZ DOJ NH Black or African American 36,925 5.39% CITZ DOJ NH Asian 145,879 21.29% CITZ DOJ NH American Indian and Alaska Native 4,842 0.71%
2019-2023 ACS Citizen Voting Age Population (adj Elec. §21003 - SWDB 7/16/2025) Name Count Percent Total Citizen Voting Age Population (CVAP) 524,308 100.00% CVAP Hispanic or Latino 80,445 15.34% CVAP Not Hispanic or Latino (NH) 443,884 84.66% CVAP NH White alone 301,874 57.58% CVAP NH Black or African American Alone 25,914 4.94% CVAP NH Asian Alone 93,541 17.84% CVAP NH American Indian and Alaska Native Alone 1,052 0.20% CVAP NH Native Hawaiian and Other Pacific Islander alone 1,501 0.29% CVAP NH Black or African American and White 2,804 0.53% CVAP NH Asian and White 9,573 1.83% CVAP NH American Indian or Alaska Native and White 2,677 0.51% CVAP NH American Indian or Alaska Native and Black or African American 630 0.12% CVAP NH Remainder of Two or More Race 4,289 0.82% CVAP DOJ NH Black or African American 28,718 5.48% CVAP DOJ NH Asian 103,114 19.67% CVAP DOJ NH American Indian and Alaska Native 3,729 0.71%
Counties In District Name Count Percent Alameda 79,642 4.73% Contra Costa 680,423 58.25%
Places In District Name Count Percent ALAMEDA: Ashland(U) 23,837 100.00% ALAMEDA: Castro Valley(U) 52,817 79.43% ALAMEDA: San Leandro(C) 2,548 2.80% ALAMEDA: Remainder of Alameda(R) 440 10.50% CONTRA COSTA: Acalanes Ridge(U) 1,287 100.00% CONTRA COSTA: Alamo(U) 15,325 100.00% CONTRA COSTA: Alhambra Valley(U) 807 100.00% CONTRA COSTA: Bay Point(U) 23,971 100.00% CONTRA COSTA: Blackhawk(U) 9,649 100.00% CONTRA COSTA: Brentwood(C) 64,381 100.00% CONTRA COSTA: Byron(U) 1,142 100.00% CONTRA COSTA: Camino Tassajara(U) 4,960 100.00% CONTRA COSTA: Castle Hill(U) 1,273 100.00% CONTRA COSTA: Clayton(C) 11,085 100.00% CONTRA COSTA: Clyde(U) 729 100.00% CONTRA COSTA: Concord(C) 125,615 100.00% CONTRA COSTA: Contra Costa Centre(U) 6,813 100.00% CONTRA COSTA: Crockett(U) 2,011 61.86% CONTRA COSTA: Danville(C) 43,617 100.00% CONTRA COSTA: Diablo(U) 1,257 100.00% CONTRA COSTA: Discovery Bay(U) 15,379 100.00% CONTRA COSTA: Knightsen(U) 1,602 100.00% CONTRA COSTA: Lafayette(C) 25,413 100.00% CONTRA COSTA: Martinez(C) 37,349 100.00% CONTRA COSTA: Moraga(C) 16,880 100.00% CONTRA COSTA: Mountain View(U) 2,636 100.00% CONTRA COSTA: Norris Canyon(U) 1,315 100.00% CONTRA COSTA: North Gate(U) 669 100.00% CONTRA COSTA: Oakley(C) 24,262 55.85% CONTRA COSTA: Orinda(C) 19,529 100.00% CONTRA COSTA: Pacheco(U) 4,190 100.00% CONTRA COSTA: Pleasant Hill(C) 34,650 100.00% CONTRA COSTA: Port Costa(U) 190 100.00% CONTRA COSTA: Reliez Valley(U) 3,354 100.00% CONTRA COSTA: San Miguel(U) 3,596 100.00% CONTRA COSTA: San Ramon(C) 84,682 100.00% CONTRA COSTA: Saranap(U) 5,837 100.00% CONTRA COSTA: Shell Ridge(U) 1,015 100.00% CONTRA COSTA: Vine Hill(U) 4,329 100.00% CONTRA COSTA: Walnut Creek(C) 70,199 100.00% CONTRA COSTA: Remainder of Contra Costa(R) 9,425 89.42%
Senate Office of Demographics 02/2026