This Congressional district was established by the voters of California with the passage of Proposition 50 (2025) on November 4, 2025 and will go into effect after the November 2026 elections and upon seating of the 120th Congress, January 3, 2027. This district will stay in use until the California Citizens Redistricting Commission draws new maps following the 2030 U.S. Census .
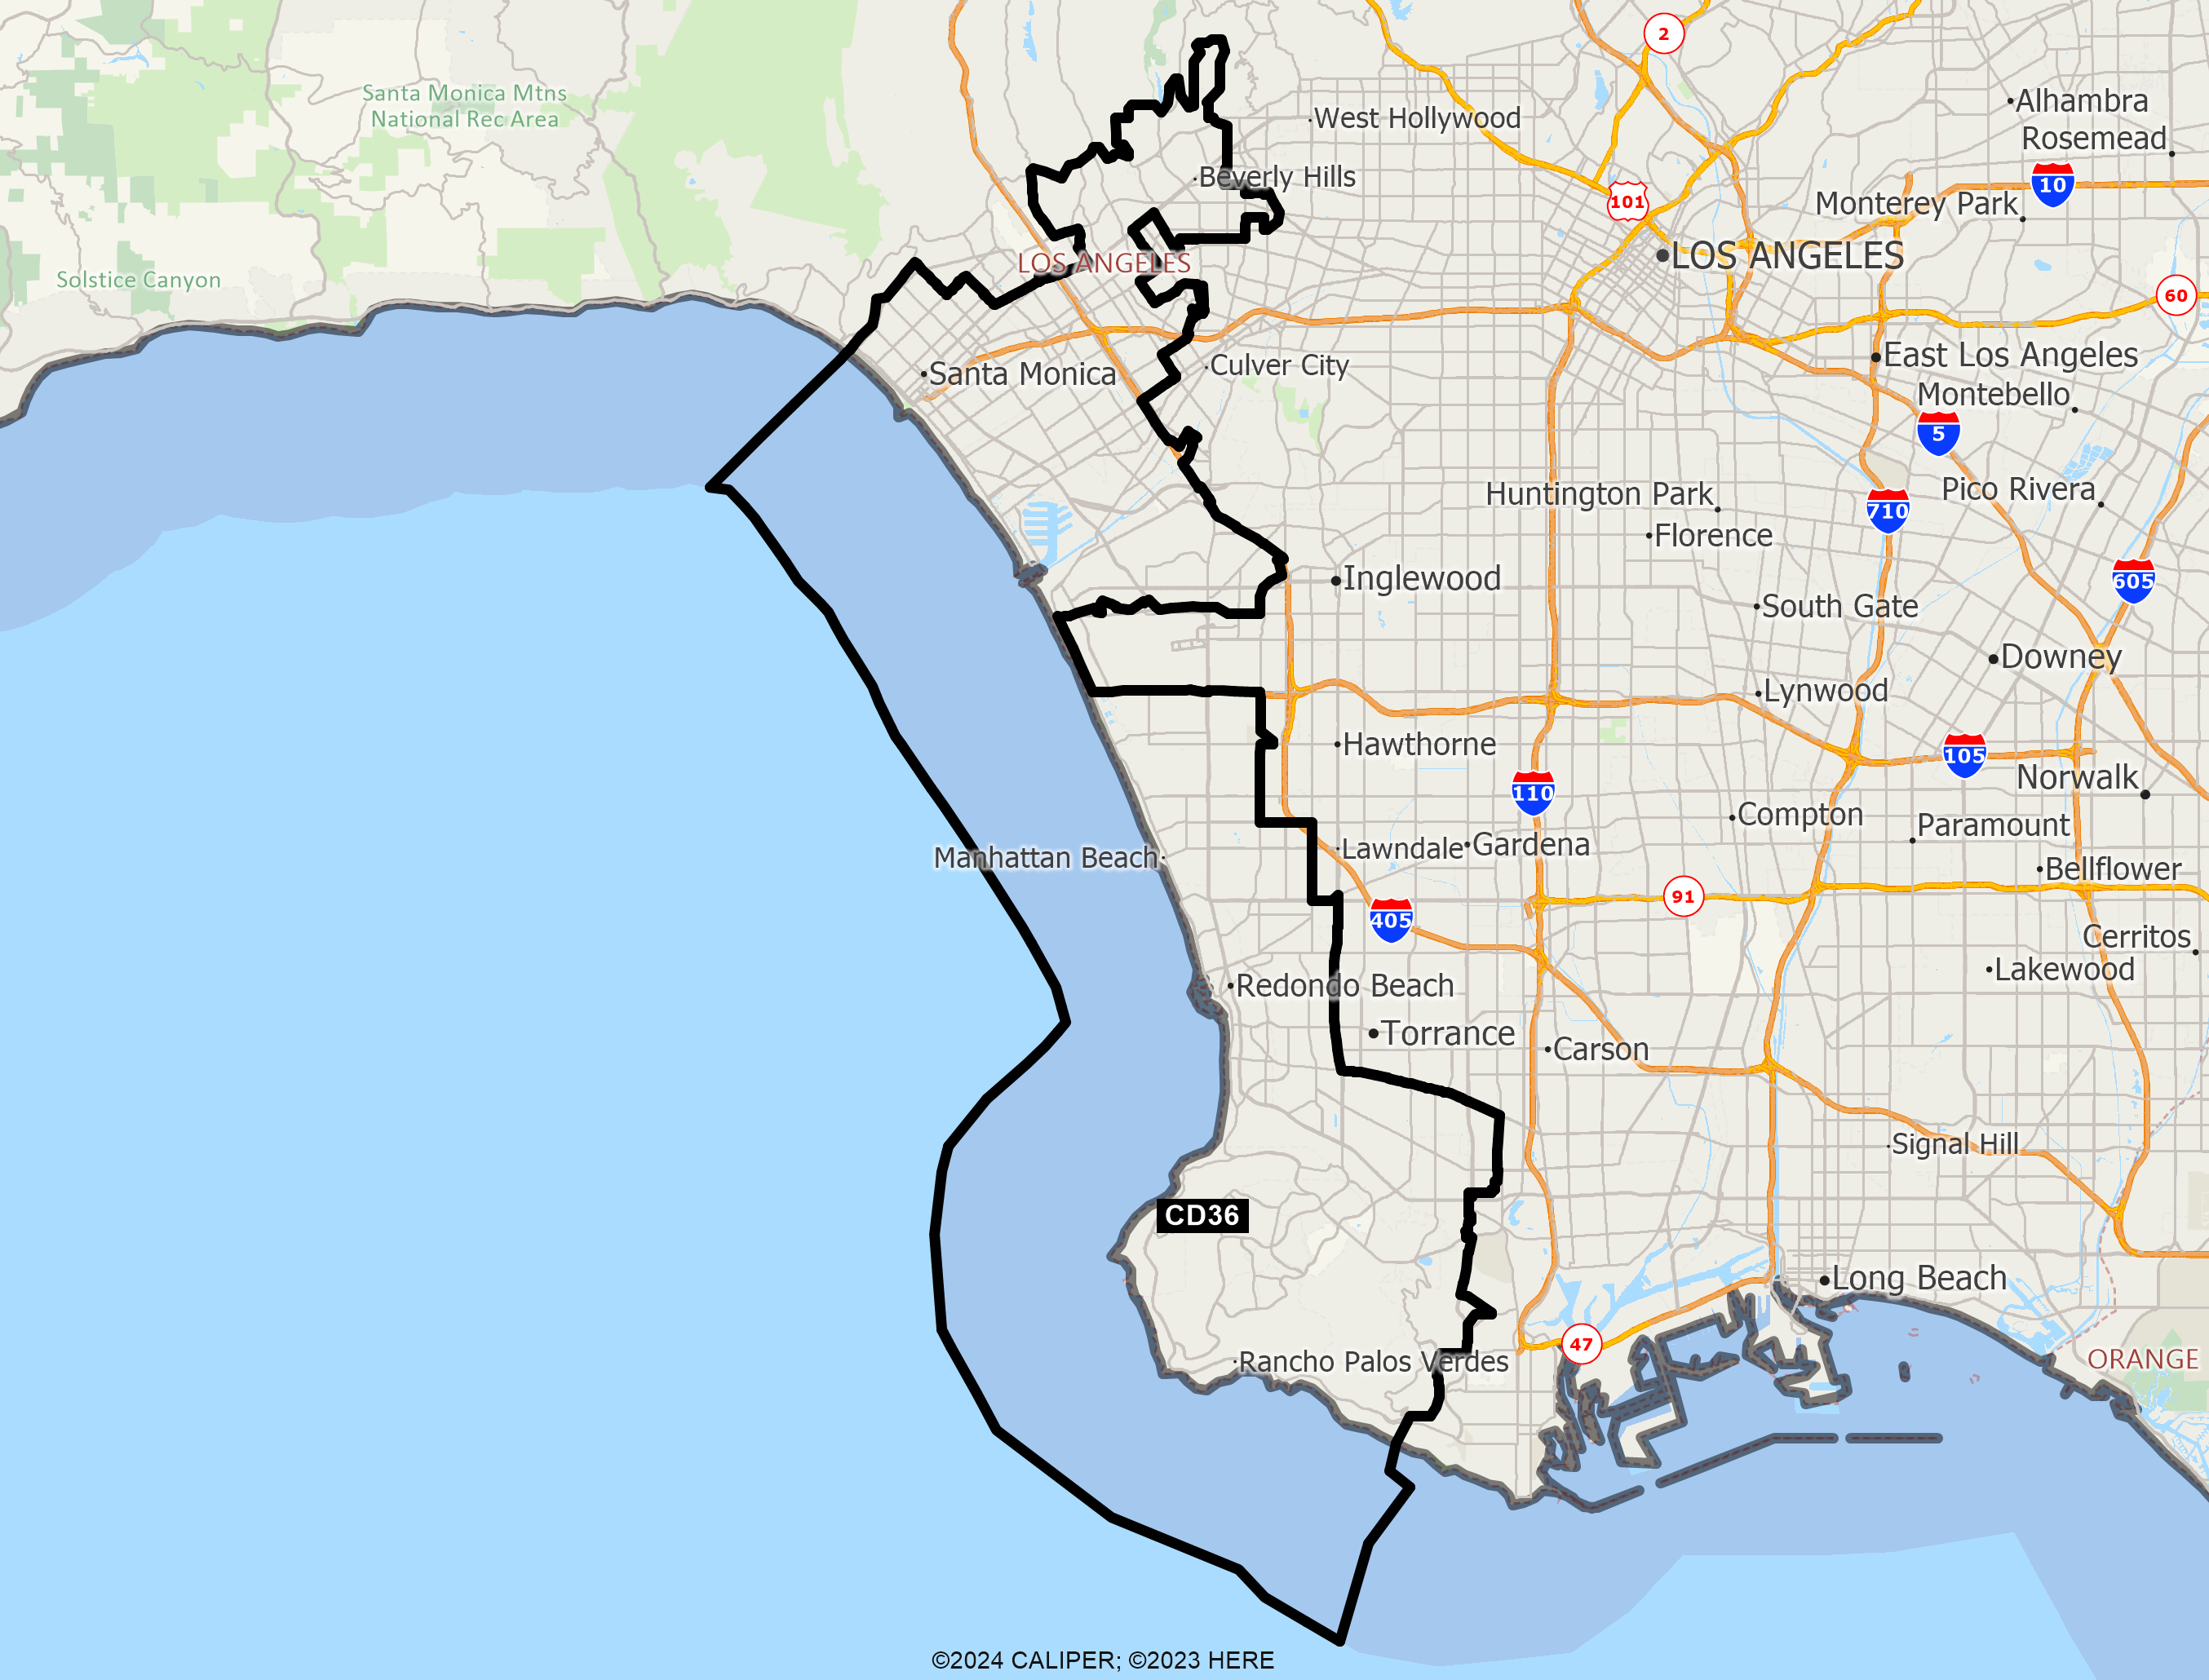
DISTRICT CD36
2020 Census Population (adj Elec. §21003 - SWDB 9/27/2021) Name Count Percent Total Population (POP) 760,066 100.00% POP Hispanic or Latino 126,932 16.70% POP Not Hispanic or Latino (NH) 633,134 83.30% POP NH Population of one race 587,448 77.29% POP NH White alone 420,849 55.37% POP NH Black or African American alone 26,663 3.51% POP NH Asian alone 131,473 17.30% POP NH American Indian and Alaska Native alone 1,221 0.16% POP NH Native Hawaiian and Other Pacific Islander alone 1,404 0.18% POP NH Some Other Race alone 5,838 0.77% POP NH Population of two or more races 45,686 6.01% POP DOJ NH Black or African American 32,304 4.25% POP DOJ NH Asian 153,884 20.25% POP DOJ NH American Indian and Alaska Native 4,945 0.65% POP DOJ NH Native Hawaiian and Other Pacific Islander 2,128 0.28% POP DOJ NH Some Other Race 12,985 1.71% POP DOJ NH Balance of Population of two or more races 6,039 0.79%
2020 Census Voting Age Population (adj Elec. §21003 - SWDB 9/27/2021) Name Count Percent Total Voting Age Population (VAP) 636,444 100.00% VAP Hispanic or Latino 98,903 15.54% VAP Not Hispanic or Latino (NH) 537,541 84.46% VAP NH Population of one race 507,671 79.77% VAP NH White alone 365,480 57.43% VAP NH Black or African American alone 22,870 3.59% VAP NH Asian alone 112,551 17.68% VAP NH American Indian and Alaska Native alone 1,030 0.16% VAP NH Native Hawaiian and Other Pacific Islander alone 1,152 0.18% VAP NH Some Other Race alone 4,588 0.72% VAP NH Population of two or more races 29,870 4.69% VAP DOJ NH Black or African American 26,664 4.19% VAP DOJ NH Asian 124,991 19.64% VAP DOJ NH American Indian and Alaska Native 4,276 0.67% VAP DOJ NH Native Hawaiian and Other Pacific Islander 1,681 0.26% VAP DOJ NH Some Other Race 10,167 1.60% VAP DOJ NH Balance of Population of two or more races 4,282 0.67%
2020 Census Housing Occupancy Status Name Count Percent Total Housing Units 350,334 100.00% Occupied 323,746 92.41% Vacant 26,588 7.59%
2020 Census Group Quarters Population (adj Elec. §21003 - SWDB 9/27/2021) Name Count Percent Total Group Quarters Population: 32,577 100.00% Institutionalized population: 2,814 8.64% Correctional facilities for adults 25 0.08% Juvenile facilities 84 0.26% Nursing facilities/Skilled-nursing facilities 2,609 8.01% Other institutional facilities 96 0.29% Noninstitutionalized population: 29,763 91.36% College/University student housing 24,105 73.99% Military quarters 0 0.00% Other noninstitutional facilities 5,658 17.37%
2019-2023 ACS Citizen Population (adj Elec. §21003 - SWDB 7/16/2025) Name Count Percent Total Citizen Population (CITZ) 669,640 100.00% CITZ Hispanic or Latino 106,052 15.84% CITZ Not Hispanic or Latino (NH) 563,609 84.17% CITZ NH White alone 383,715 57.30% CITZ NH Black or African American Alone 28,035 4.19% CITZ NH Asian Alone 109,644 16.37% CITZ NH American Indian and Alaska Native Alone 1,147 0.17% CITZ NH Native Hawaiian and Other Pacific Islander alone 860 0.13% CITZ NH Black or African American and White 6,767 1.01% CITZ NH American Indian or Alaska Native and White 24,237 3.62% CITZ NH Asian and White 3,294 0.49% CITZ NH American Indian or Alaska Native and Black or African American 380 0.06% CITZ NH Remainder of Two or More Race 5,517 0.82% CITZ DOJ NH Black or African American 34,802 5.20% CITZ DOJ NH Asian 133,881 19.99% CITZ DOJ NH American Indian and Alaska Native 4,441 0.66%
2019-2023 ACS Citizen Voting Age Population (adj Elec. §21003 - SWDB 7/16/2025) Name Count Percent Total Citizen Voting Age Population (CVAP) 545,928 100.00% CVAP Hispanic or Latino 80,469 14.74% CVAP Not Hispanic or Latino (NH) 465,425 85.25% CVAP NH White alone 328,966 60.26% CVAP NH Black or African American Alone 23,543 4.31% CVAP NH Asian Alone 88,005 16.12% CVAP NH American Indian and Alaska Native Alone 1,031 0.19% CVAP NH Native Hawaiian and Other Pacific Islander alone 815 0.15% CVAP NH Black or African American and White 4,354 0.80% CVAP NH Asian and White 12,372 2.27% CVAP NH American Indian or Alaska Native and White 2,625 0.48% CVAP NH American Indian or Alaska Native and Black or African American 315 0.06% CVAP NH Remainder of Two or More Race 3,527 0.65% CVAP DOJ NH Black or African American 27,897 5.11% CVAP DOJ NH Asian 100,377 18.39% CVAP DOJ NH American Indian and Alaska Native 3,656 0.67%
Counties In District Name Count Percent Los Angeles 760,064 7.56%
Places In District Name Count Percent LOS ANGELES: Beverly Hills(C) 32,761 100.00% LOS ANGELES: Culver City(C) 5,934 14.51% LOS ANGELES: El Segundo(C) 17,358 100.00% LOS ANGELES: Hermosa Beach(C) 19,789 100.00% LOS ANGELES: Lomita(C) 20,982 100.00% LOS ANGELES: Los Angeles(C) 302,417 7.73% LOS ANGELES: Manhattan Beach(C) 35,670 100.00% LOS ANGELES: Marina del Rey(U) 11,392 100.00% LOS ANGELES: Palos Verdes Estates(C) 13,372 100.00% LOS ANGELES: Rancho Palos Verdes(C) 42,360 100.00% LOS ANGELES: Redondo Beach(C) 71,747 100.00% LOS ANGELES: Rolling Hills(C) 1,742 100.00% LOS ANGELES: Rolling Hills Estates(C) 8,298 100.00% LOS ANGELES: Santa Monica(C) 93,289 100.00% LOS ANGELES: Torrance(C) 80,229 54.43% LOS ANGELES: Remainder of Los Angeles(R) 2,724 3.11%
Senate Office of Demographics 02/2026