This Congressional district was established by the voters of California with the passage of Proposition 50 (2025) on November 4, 2025 and will go into effect after the November 2026 elections and upon seating of the 120th Congress, January 3, 2027. This district will stay in use until the California Citizens Redistricting Commission draws new maps following the 2030 U.S. Census .
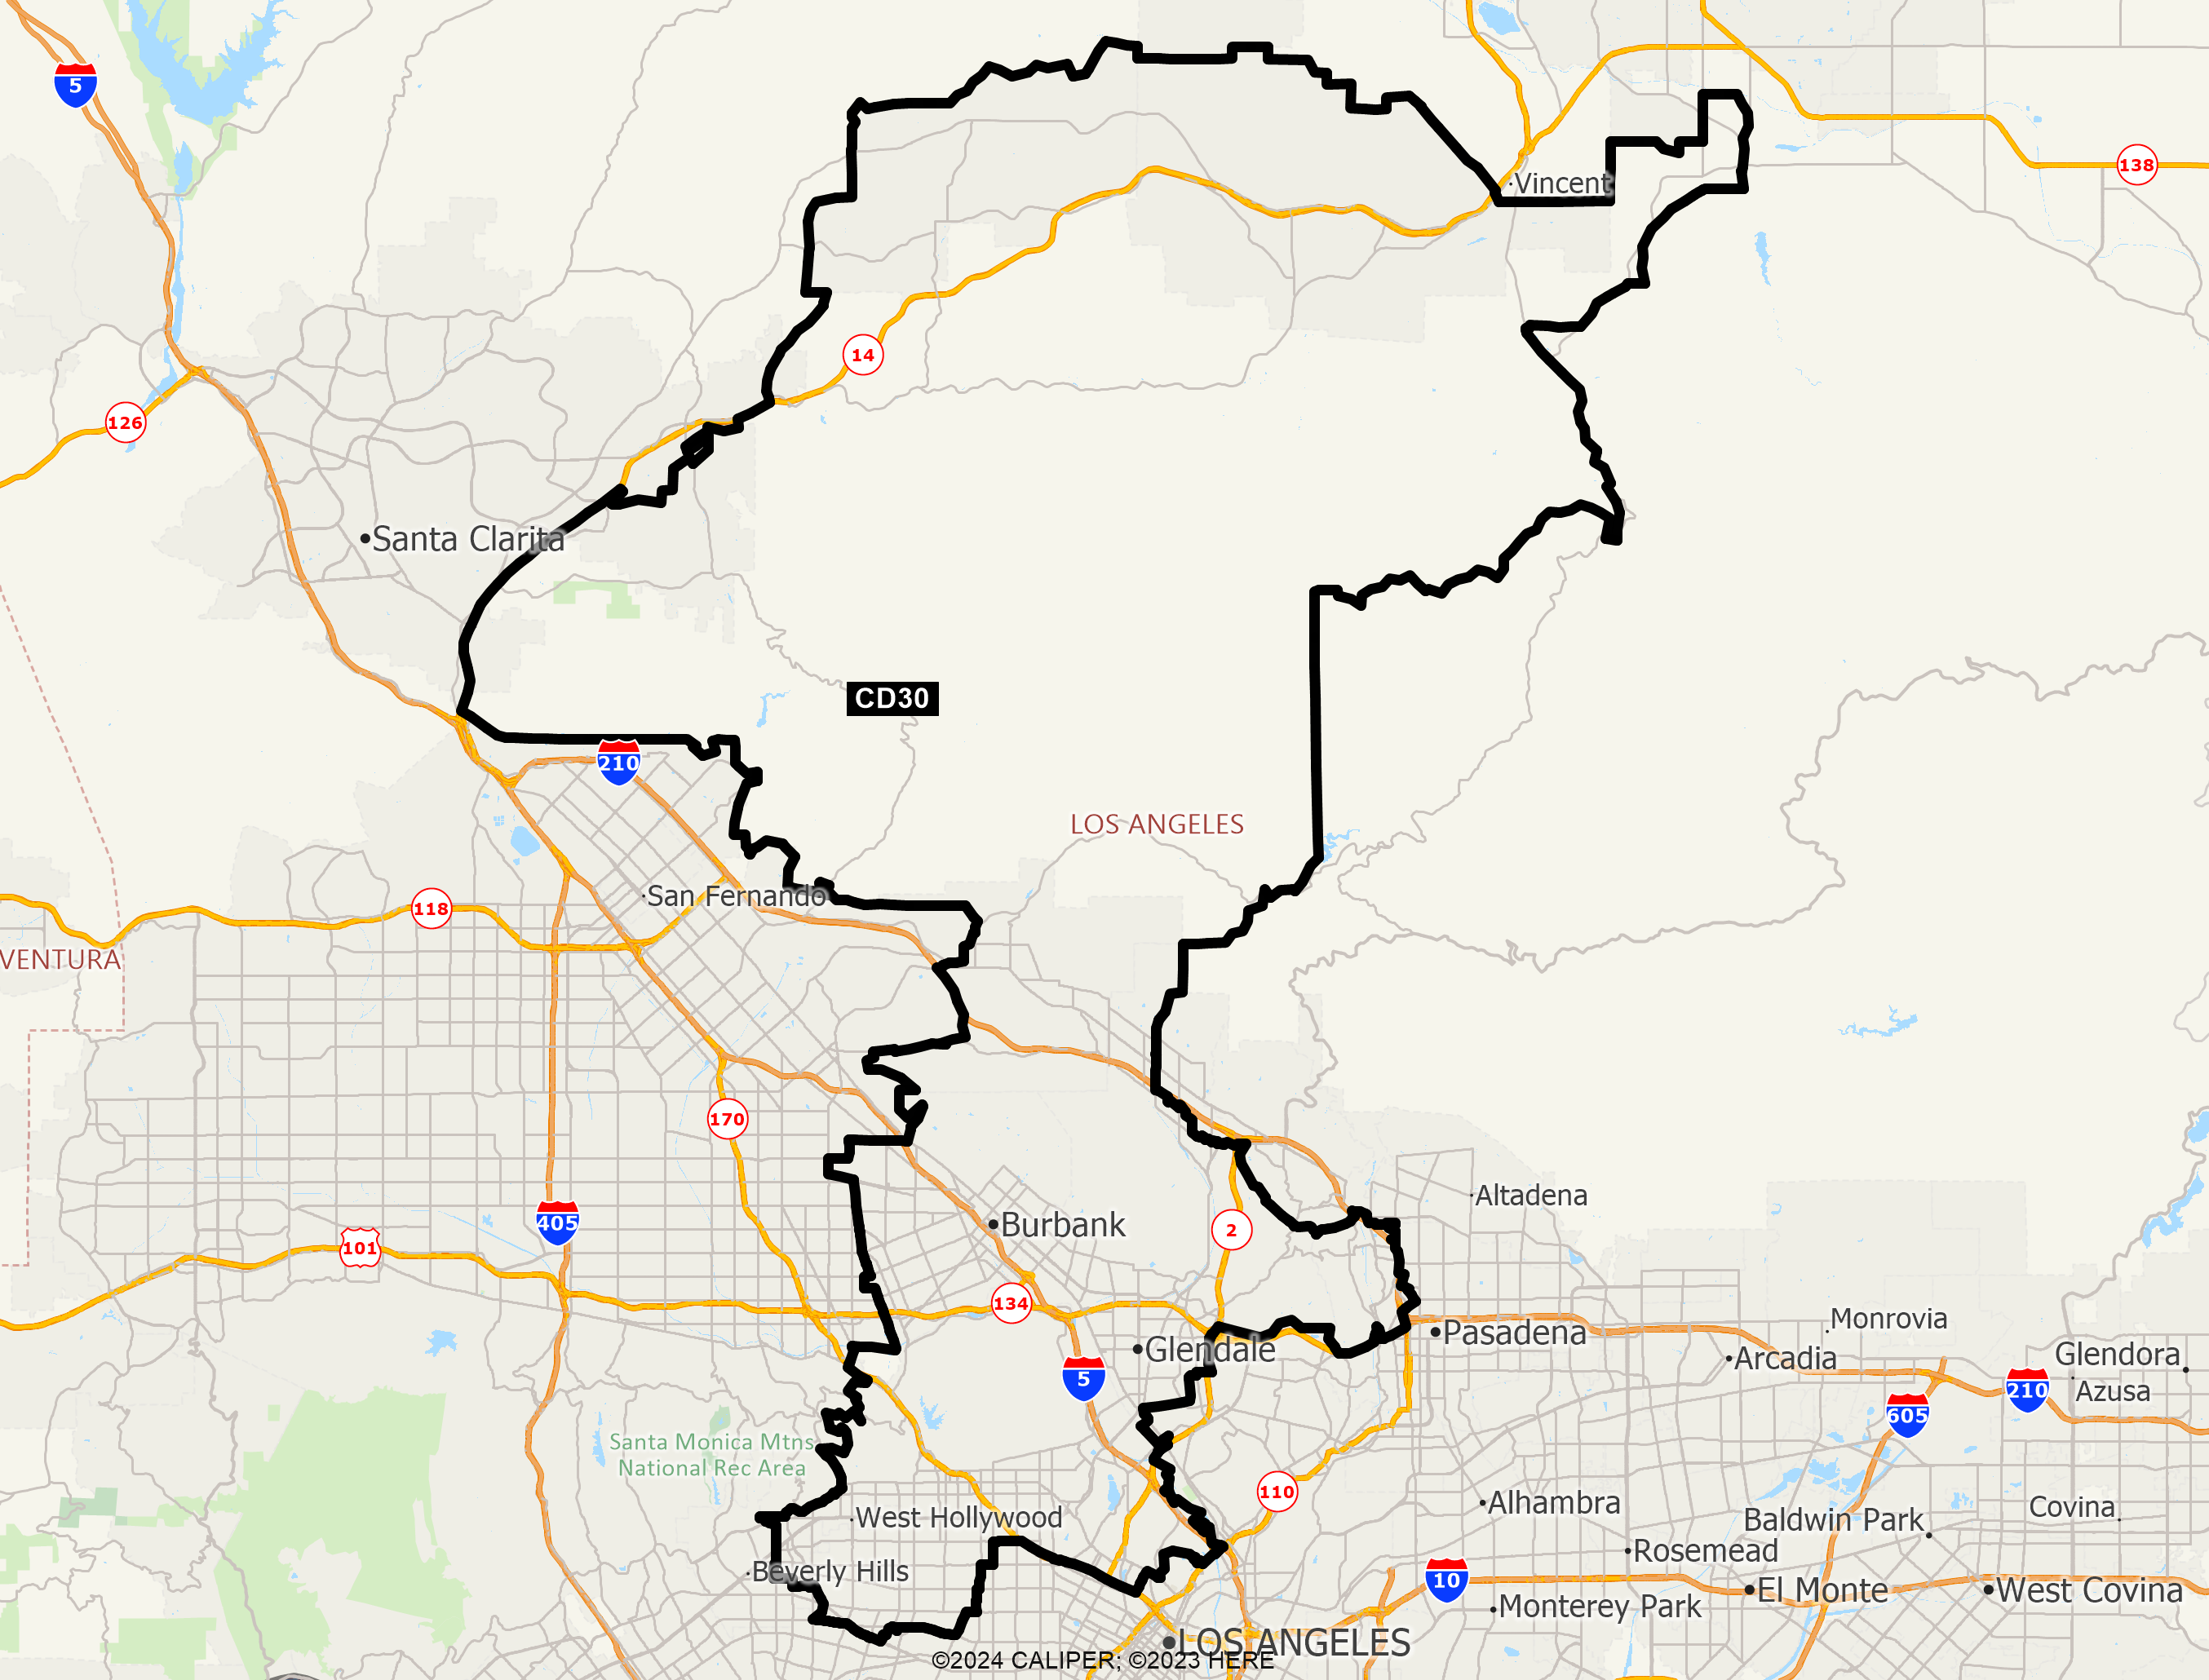
DISTRICT CD30
2020 Census Population (adj Elec. §21003 - SWDB 9/27/2021) Name Count Percent Total Population (POP) 760,066 100.00% POP Hispanic or Latino 178,511 23.49% POP Not Hispanic or Latino (NH) 581,555 76.51% POP NH Population of one race 549,258 72.26% POP NH White alone 421,462 55.45% POP NH Black or African American alone 25,802 3.39% POP NH Asian alone 95,096 12.51% POP NH American Indian and Alaska Native alone 1,195 0.16% POP NH Native Hawaiian and Other Pacific Islander alone 659 0.09% POP NH Some Other Race alone 5,044 0.66% POP NH Population of two or more races 32,297 4.25% POP DOJ NH Black or African American 30,695 4.04% POP DOJ NH Asian 108,822 14.32% POP DOJ NH American Indian and Alaska Native 4,725 0.62% POP DOJ NH Native Hawaiian and Other Pacific Islander 1,108 0.15% POP DOJ NH Some Other Race 9,768 1.29% POP DOJ NH Balance of Population of two or more races 4,975 0.65%
2020 Census Voting Age Population (adj Elec. §21003 - SWDB 9/27/2021) Name Count Percent Total Voting Age Population (VAP) 651,173 100.00% VAP Hispanic or Latino 143,503 22.04% VAP Not Hispanic or Latino (NH) 507,670 77.96% VAP NH Population of one race 483,419 74.24% VAP NH White alone 370,802 56.94% VAP NH Black or African American alone 23,372 3.59% VAP NH Asian alone 83,630 12.84% VAP NH American Indian and Alaska Native alone 1,001 0.15% VAP NH Native Hawaiian and Other Pacific Islander alone 535 0.08% VAP NH Some Other Race alone 4,079 0.63% VAP NH Population of two or more races 24,251 3.72% VAP DOJ NH Black or African American 27,092 4.16% VAP DOJ NH Asian 93,018 14.28% VAP DOJ NH American Indian and Alaska Native 4,163 0.64% VAP DOJ NH Native Hawaiian and Other Pacific Islander 887 0.14% VAP DOJ NH Some Other Race 8,040 1.23% VAP DOJ NH Balance of Population of two or more races 3,668 0.56%
2020 Census Housing Occupancy Status Name Count Percent Total Housing Units 360,734 100.00% Occupied 338,233 93.76% Vacant 22,501 6.24%
2020 Census Group Quarters Population (adj Elec. §21003 - SWDB 9/27/2021) Name Count Percent Total Group Quarters Population: 12,488 100.00% Institutionalized population: 4,162 33.33% Correctional facilities for adults 192 1.54% Juvenile facilities 135 1.08% Nursing facilities/Skilled-nursing facilities 3,587 28.72% Other institutional facilities 248 1.99% Noninstitutionalized population: 8,326 66.67% College/University student housing 886 7.09% Military quarters 0 0.00% Other noninstitutional facilities 7,440 59.58%
2019-2023 ACS Citizen Population (adj Elec. §21003 - SWDB 7/16/2025) Name Count Percent Total Citizen Population (CITZ) 651,015 100.00% CITZ Hispanic or Latino 144,756 22.24% CITZ Not Hispanic or Latino (NH) 506,407 77.79% CITZ NH White alone 372,901 57.28% CITZ NH Black or African American Alone 28,769 4.42% CITZ NH Asian Alone 75,376 11.58% CITZ NH American Indian and Alaska Native Alone 1,150 0.18% CITZ NH Native Hawaiian and Other Pacific Islander alone 714 0.11% CITZ NH Black or African American and White 7,063 1.08% CITZ NH American Indian or Alaska Native and White 13,630 2.09% CITZ NH Asian and White 2,112 0.32% CITZ NH American Indian or Alaska Native and Black or African American 464 0.07% CITZ NH Remainder of Two or More Race 4,055 0.62% CITZ DOJ NH Black or African American 35,832 5.50% CITZ DOJ NH Asian 89,006 13.67% CITZ DOJ NH American Indian and Alaska Native 3,262 0.50%
2019-2023 ACS Citizen Voting Age Population (adj Elec. §21003 - SWDB 7/16/2025) Name Count Percent Total Citizen Voting Age Population (CVAP) 547,252 100.00% CVAP Hispanic or Latino 110,511 20.19% CVAP Not Hispanic or Latino (NH) 436,853 79.83% CVAP NH White alone 325,899 59.55% CVAP NH Black or African American Alone 26,002 4.75% CVAP NH Asian Alone 63,977 11.69% CVAP NH American Indian and Alaska Native Alone 1,016 0.19% CVAP NH Native Hawaiian and Other Pacific Islander alone 693 0.13% CVAP NH Black or African American and White 4,810 0.88% CVAP NH Asian and White 8,592 1.57% CVAP NH American Indian or Alaska Native and White 1,892 0.35% CVAP NH American Indian or Alaska Native and Black or African American 449 0.08% CVAP NH Remainder of Two or More Race 3,371 0.62% CVAP DOJ NH Black or African American 30,812 5.63% CVAP DOJ NH Asian 72,569 13.26% CVAP DOJ NH American Indian and Alaska Native 2,908 0.53%
Counties In District Name Count Percent Los Angeles 760,067 7.56%
Places In District Name Count Percent LOS ANGELES: Acton(U) 7,458 100.00% LOS ANGELES: Agua Dulce(U) 3,466 100.00% LOS ANGELES: Burbank(C) 107,614 100.00% LOS ANGELES: Glendale(C) 196,981 100.00% LOS ANGELES: La Crescenta-Montrose(U) 53 0.26% LOS ANGELES: Los Angeles(C) 388,440 9.93% LOS ANGELES: Pasadena(C) 8,992 6.46% LOS ANGELES: Santa Clarita(C) 8,569 3.74% LOS ANGELES: West Hollywood(C) 35,829 100.00% LOS ANGELES: Remainder of Los Angeles(R) 2,665 3.04%
Senate Office of Demographics 02/2026