This Congressional district was established by the voters of California with the passage of Proposition 50 (2025) on November 4, 2025 and will go into effect after the November 2026 elections and upon seating of the 120th Congress, January 3, 2027. This district will stay in use until the California Citizens Redistricting Commission draws new maps following the 2030 U.S. Census .
DISTRICT CD08 2020 Census Voting Age Population 2020 Census Housing Occupancy Status 2020 Census Group Quarters Population 2019-2023 ACS Citizen Population 2019-2023 ACS Citizen Voting Age Population Counties In District Places In District 2020 Census Population (adj Elec. §21003 - SWDB 9/27/2021) Name Count Percent Total Population (POP) 760,066 100.00% POP Hispanic or Latino 238,586 31.39% POP Not Hispanic or Latino (NH) 521,480 68.61% POP NH Population of one race 474,931 62.49% POP NH White alone 233,055 30.66% POP NH Black or African American alone 97,188 12.79% POP NH Asian alone 131,301 17.27% POP NH American Indian and Alaska Native alone 2,242 0.29% POP NH Native Hawaiian and Other Pacific Islander alone 5,133 0.68% POP NH Some Other Race alone 6,012 0.79% POP NH Population of two or more races 46,549 6.12% POP DOJ NH Black or African American 104,769 13.78% POP DOJ NH Asian 144,821 19.05% POP DOJ NH American Indian and Alaska Native 8,069 1.06% POP DOJ NH Native Hawaiian and Other Pacific Islander 6,339 0.83% POP DOJ NH Some Other Race 11,116 1.46% POP DOJ NH Balance of Population of two or more races 13,311 1.75%
2020 Census Voting Age Population (adj Elec. §21003 - SWDB 9/27/2021) Name Count Percent Total Voting Age Population (VAP) 595,508 100.00% VAP Hispanic or Latino 166,452 27.95% VAP Not Hispanic or Latino (NH) 429,056 72.05% VAP NH Population of one race 399,110 67.02% VAP NH White alone 200,406 33.65% VAP NH Black or African American alone 78,183 13.13% VAP NH Asian alone 110,105 18.49% VAP NH American Indian and Alaska Native alone 1,877 0.32% VAP NH Native Hawaiian and Other Pacific Islander alone 4,124 0.69% VAP NH Some Other Race alone 4,415 0.74% VAP NH Population of two or more races 29,946 5.03% VAP DOJ NH Black or African American 82,341 13.83% VAP DOJ NH Asian 117,907 19.80% VAP DOJ NH American Indian and Alaska Native 6,606 1.11% VAP DOJ NH Native Hawaiian and Other Pacific Islander 4,901 0.82% VAP DOJ NH Some Other Race 8,498 1.43% VAP DOJ NH Balance of Population of two or more races 8,397 1.41%
2020 Census Housing Occupancy Status Name Count Percent Total Housing Units 274,218 100.00% Occupied 263,063 95.93% Vacant 11,155 4.07%
2020 Census Group Quarters Population (adj Elec. §21003 - SWDB 9/27/2021) Name Count Percent Total Group Quarters Population: 8,147 100.00% Institutionalized population: 2,374 29.14% Correctional facilities for adults 677 8.31% Juvenile facilities 87 1.07% Nursing facilities/Skilled-nursing facilities 1,610 19.76% Other institutional facilities 0 0.00% Noninstitutionalized population: 5,773 70.86% College/University student housing 883 10.84% Military quarters 917 11.26% Other noninstitutional facilities 3,973 48.77%
2019-2023 ACS Citizen Population (adj Elec. §21003 - SWDB 7/16/2025) Name Count Percent Total Citizen Population (CITZ) 671,396 100.00% CITZ Hispanic or Latino 189,536 28.23% CITZ Not Hispanic or Latino (NH) 481,813 71.76% CITZ NH White alone 236,346 35.20% CITZ NH Black or African American Alone 92,434 13.77% CITZ NH Asian Alone 106,669 15.89% CITZ NH American Indian and Alaska Native Alone 1,662 0.25% CITZ NH Native Hawaiian and Other Pacific Islander alone 4,562 0.68% CITZ NH Black or African American and White 9,711 1.45% CITZ NH American Indian or Alaska Native and White 14,475 2.16% CITZ NH Asian and White 3,564 0.53% CITZ NH American Indian or Alaska Native and Black or African American 2,150 0.32% CITZ NH Remainder of Two or More Race 10,403 1.55% CITZ DOJ NH Black or African American 102,145 15.21% CITZ DOJ NH Asian 121,144 18.04% CITZ DOJ NH American Indian and Alaska Native 5,226 0.78%
2019-2023 ACS Citizen Voting Age Population (adj Elec. §21003 - SWDB 7/16/2025) Name Count Percent Total Citizen Voting Age Population (CVAP) 513,705 100.00% CVAP Hispanic or Latino 120,045 23.37% CVAP Not Hispanic or Latino (NH) 393,660 76.63% CVAP NH White alone 201,846 39.29% CVAP NH Black or African American Alone 75,115 14.62% CVAP NH Asian Alone 87,863 17.10% CVAP NH American Indian and Alaska Native Alone 1,503 0.29% CVAP NH Native Hawaiian and Other Pacific Islander alone 3,617 0.70% CVAP NH Black or African American and White 5,563 1.08% CVAP NH Asian and White 7,999 1.56% CVAP NH American Indian or Alaska Native and White 2,733 0.53% CVAP NH American Indian or Alaska Native and Black or African American 1,596 0.31% CVAP NH Remainder of Two or More Race 6,002 1.17% CVAP DOJ NH Black or African American 80,678 15.71% CVAP DOJ NH Asian 95,862 18.66% CVAP DOJ NH American Indian and Alaska Native 4,236 0.82%
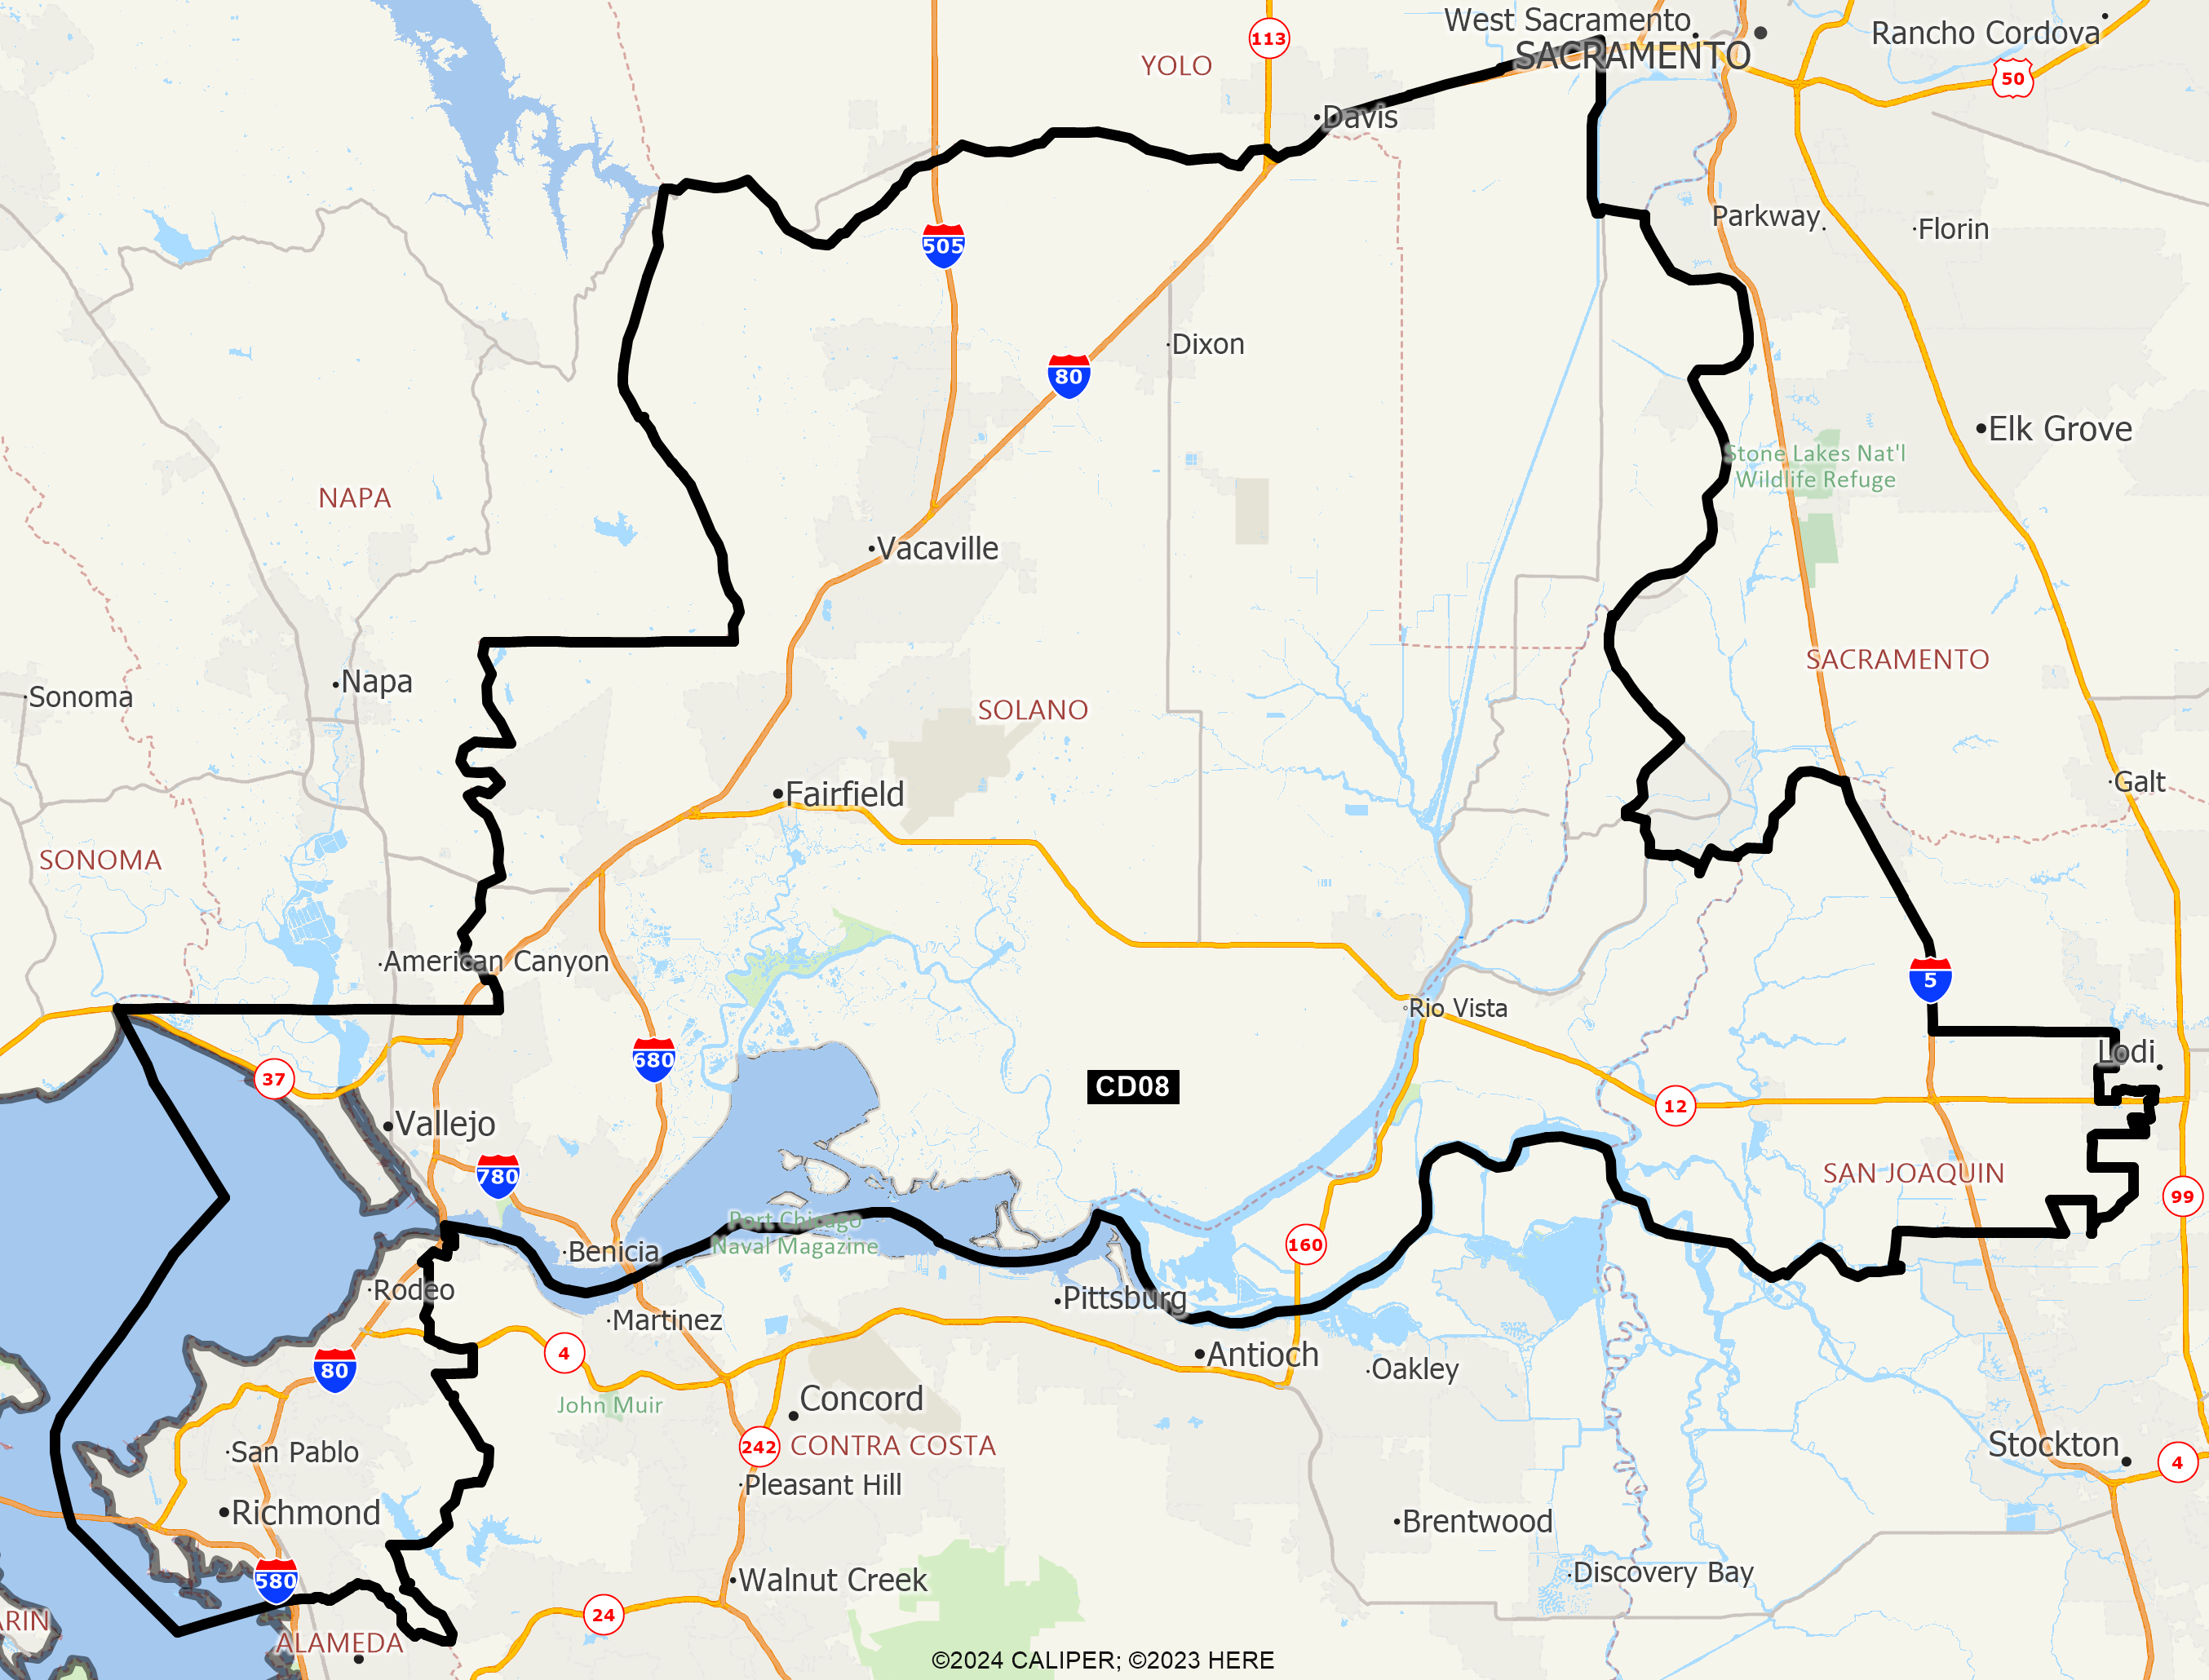
Counties In District Name Count Percent Contra Costa 273,006 23.37% Sacramento 3,167 0.20% San Joaquin 21,260 2.74% Solano 447,857 100.00% Yolo 14,774 6.81%
Places In District Name Count Percent CONTRA COSTA: Bayview(U) 1,786 100.00% CONTRA COSTA: Crockett(U) 1,240 38.14% CONTRA COSTA: East Richmond Heights(U) 3,463 100.00% CONTRA COSTA: El Cerrito(C) 26,000 100.00% CONTRA COSTA: El Sobrante(U) 15,547 100.00% CONTRA COSTA: Hercules(C) 26,053 100.00% CONTRA COSTA: Kensington(U) 5,435 100.00% CONTRA COSTA: Montalvin Manor(U) 3,113 100.00% CONTRA COSTA: North Richmond(U) 4,191 100.00% CONTRA COSTA: Pinole(C) 19,058 100.00% CONTRA COSTA: Richmond(C) 116,790 100.00% CONTRA COSTA: Rodeo(U) 9,678 100.00% CONTRA COSTA: Rollingwood(U) 3,019 100.00% CONTRA COSTA: San Pablo(C) 32,220 100.00% CONTRA COSTA: Tara Hills(U) 5,378 100.00% CONTRA COSTA: Remainder of Contra Costa(R) 35 0.33% SACRAMENTO: Isleton(C) 802 100.00% SACRAMENTO: Remainder of Sacramento(R) 2,365 15.71% SAN JOAQUIN: Lodi(C) 18,382 27.61% SAN JOAQUIN: Terminous(U) 430 100.00% SAN JOAQUIN: Remainder of San Joaquin(R) 2,448 3.54% SOLANO: Allendale(U) 1,652 100.00% SOLANO: Benicia(C) 27,167 100.00% SOLANO: Dixon(C) 19,013 100.00% SOLANO: Elmira(U) 194 100.00% SOLANO: Fairfield(C) 120,178 100.00% SOLANO: Green Valley(U) 1,658 100.00% SOLANO: Hartley(U) 2,436 100.00% SOLANO: Rio Vista(C) 10,017 100.00% SOLANO: Suisun City(C) 29,591 100.00% SOLANO: Vacaville(C) 95,941 100.00% SOLANO: Vallejo(C) 126,494 100.00% SOLANO: Remainder of Solano(R) 13,516 100.00% YOLO: Clarksburg(U) 402 100.00% YOLO: Davis(C) 11,674 17.44% YOLO: El Macero(U) 1,074 100.00% YOLO: Remainder of Yolo(R) 1,624 19.64%
Senate Office of Demographics 02/2026