This Congressional district was established by the voters of California with the passage of Proposition 50 (2025) on November 4, 2025 and will go into effect after the November 2026 elections and upon seating of the 120th Congress, January 3, 2027. This district will stay in use until the California Citizens Redistricting Commission draws new maps following the 2030 U.S. Census .
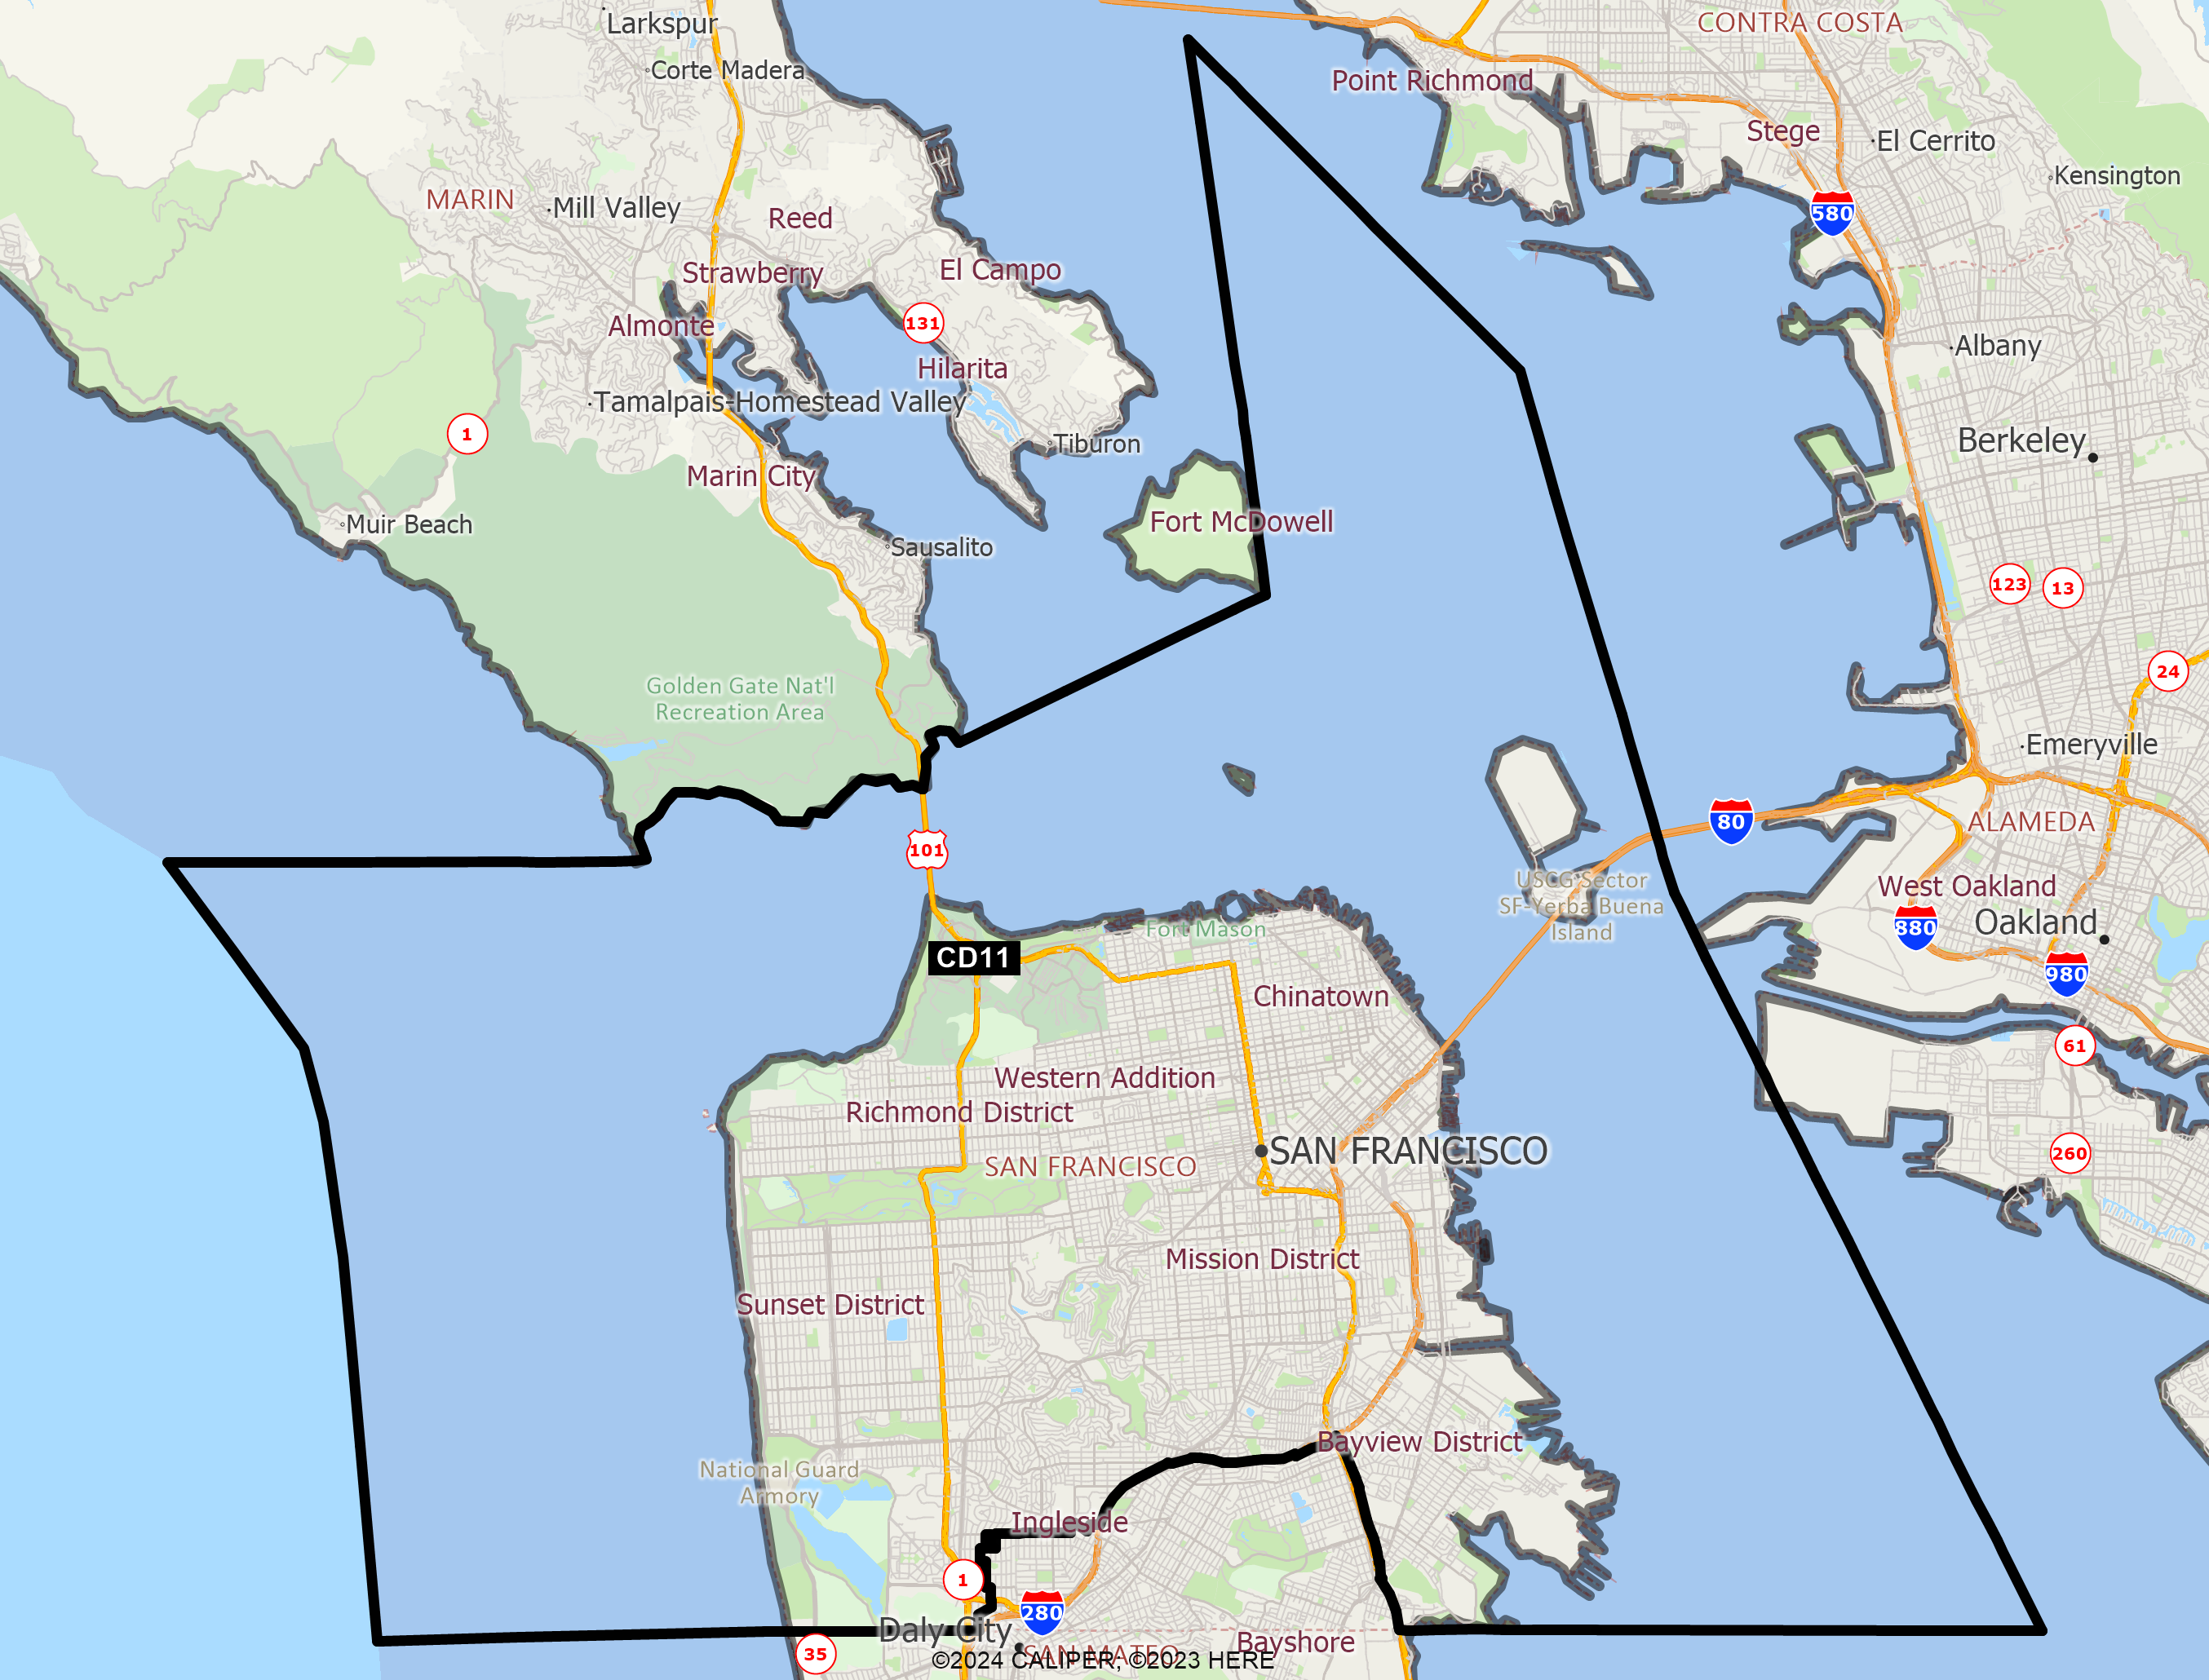
Congressional District 11 includes the Farallon Islands not shown here
DISTRICT CD11
2020 Census Population (adj Elec. §21003 - SWDB 9/27/2021) Name Count Percent Total Population (POP) 760,067 100.00% POP Hispanic or Latino 107,106 14.09% POP Not Hispanic or Latino (NH) 652,961 85.91% POP NH Population of one race 610,766 80.36% POP NH White alone 328,242 43.19% POP NH Black or African American alone 40,055 5.27% POP NH Asian alone 232,590 30.60% POP NH American Indian and Alaska Native alone 1,466 0.19% POP NH Native Hawaiian and Other Pacific Islander alone 2,508 0.33% POP NH Some Other Race alone 5,905 0.78% POP NH Population of two or more races 42,195 5.55% POP DOJ NH Black or African American 44,801 5.89% POP DOJ NH Asian 253,452 33.35% POP DOJ NH American Indian and Alaska Native 4,576 0.60% POP DOJ NH Native Hawaiian and Other Pacific Islander 3,070 0.40% POP DOJ NH Some Other Race 11,653 1.53% POP DOJ NH Balance of Population of two or more races 7,167 0.94%
2020 Census Voting Age Population (adj Elec. §21003 - SWDB 9/27/2021) Name Count Percent Total Voting Age Population (VAP) 665,870 100.00% VAP Hispanic or Latino 87,889 13.20% VAP Not Hispanic or Latino (NH) 577,981 86.80% VAP NH Population of one race 548,518 82.38% VAP NH White alone 296,973 44.60% VAP NH Black or African American alone 34,852 5.23% VAP NH Asian alone 208,437 31.30% VAP NH American Indian and Alaska Native alone 1,312 0.20% VAP NH Native Hawaiian and Other Pacific Islander alone 2,069 0.31% VAP NH Some Other Race alone 4,875 0.73% VAP NH Population of two or more races 29,463 4.42% VAP DOJ NH Black or African American 38,391 5.77% VAP DOJ NH Asian 220,985 33.19% VAP DOJ NH American Indian and Alaska Native 4,083 0.61% VAP DOJ NH Native Hawaiian and Other Pacific Islander 2,529 0.38% VAP DOJ NH Some Other Race 9,709 1.46% VAP DOJ NH Balance of Population of two or more races 5,311 0.80%
2020 Census Housing Occupancy Status Name Count Percent Total Housing Units 372,767 100.00% Occupied 339,354 91.04% Vacant 33,413 8.96%
2020 Census Group Quarters Population (adj Elec. §21003 - SWDB 9/27/2021) Name Count Percent Total Group Quarters Population: 27,112 100.00% Institutionalized population: 3,564 13.15% Correctional facilities for adults 1,165 4.30% Juvenile facilities 114 0.42% Nursing facilities/Skilled-nursing facilities 2,211 8.16% Other institutional facilities 74 0.27% Noninstitutionalized population: 23,548 86.85% College/University student housing 6,486 23.92% Military quarters 68 0.25% Other noninstitutional facilities 16,994 62.68%
2019-2023 ACS Citizen Population (adj Elec. §21003 - SWDB 7/16/2025) Name Count Percent Total Citizen Population (CITZ) 634,747 100.00% CITZ Hispanic or Latino 82,498 13.00% CITZ Not Hispanic or Latino (NH) 552,276 87.01% CITZ NH White alone 286,492 45.13% CITZ NH Black or African American Alone 36,225 5.71% CITZ NH Asian Alone 188,332 29.67% CITZ NH American Indian and Alaska Native Alone 1,420 0.22% CITZ NH Native Hawaiian and Other Pacific Islander alone 2,407 0.38% CITZ NH Black or African American and White 5,919 0.93% CITZ NH American Indian or Alaska Native and White 22,668 3.57% CITZ NH Asian and White 2,207 0.35% CITZ NH American Indian or Alaska Native and Black or African American 970 0.15% CITZ NH Remainder of Two or More Race 5,626 0.89% CITZ DOJ NH Black or African American 42,144 6.64% CITZ DOJ NH Asian 211,000 33.24% CITZ DOJ NH American Indian and Alaska Native 3,627 0.57%
2019-2023 ACS Citizen Voting Age Population (adj Elec. §21003 - SWDB 7/16/2025) Name Count Percent Total Citizen Voting Age Population (CVAP) 544,105 100.00% CVAP Hispanic or Latino 62,690 11.52% CVAP Not Hispanic or Latino (NH) 481,531 88.50% CVAP NH White alone 256,045 47.06% CVAP NH Black or African American Alone 30,900 5.68% CVAP NH Asian Alone 168,635 30.99% CVAP NH American Indian and Alaska Native Alone 1,186 0.22% CVAP NH Native Hawaiian and Other Pacific Islander alone 1,992 0.37% CVAP NH Black or African American and White 4,012 0.74% CVAP NH Asian and White 12,340 2.27% CVAP NH American Indian or Alaska Native and White 1,926 0.35% CVAP NH American Indian or Alaska Native and Black or African American 641 0.12% CVAP NH Remainder of Two or More Race 3,725 0.68% CVAP DOJ NH Black or African American 34,912 6.42% CVAP DOJ NH Asian 180,975 33.26% CVAP DOJ NH American Indian and Alaska Native 3,112 0.57%
Counties In District Name Count Percent San Francisco 760,068 86.87%
Places In District Name Count Percent SAN FRANCISCO: San Francisco(C) 760,068 86.87%
Senate Office of Demographics 02/2026