This Congressional district was established by the voters of California with the passage of Proposition 50 (2025) on November 4, 2025 and will go into effect after the November 2026 elections and upon seating of the 120th Congress, January 3, 2027. This district will stay in use until the California Citizens Redistricting Commission draws new maps following the 2030 U.S. Census .
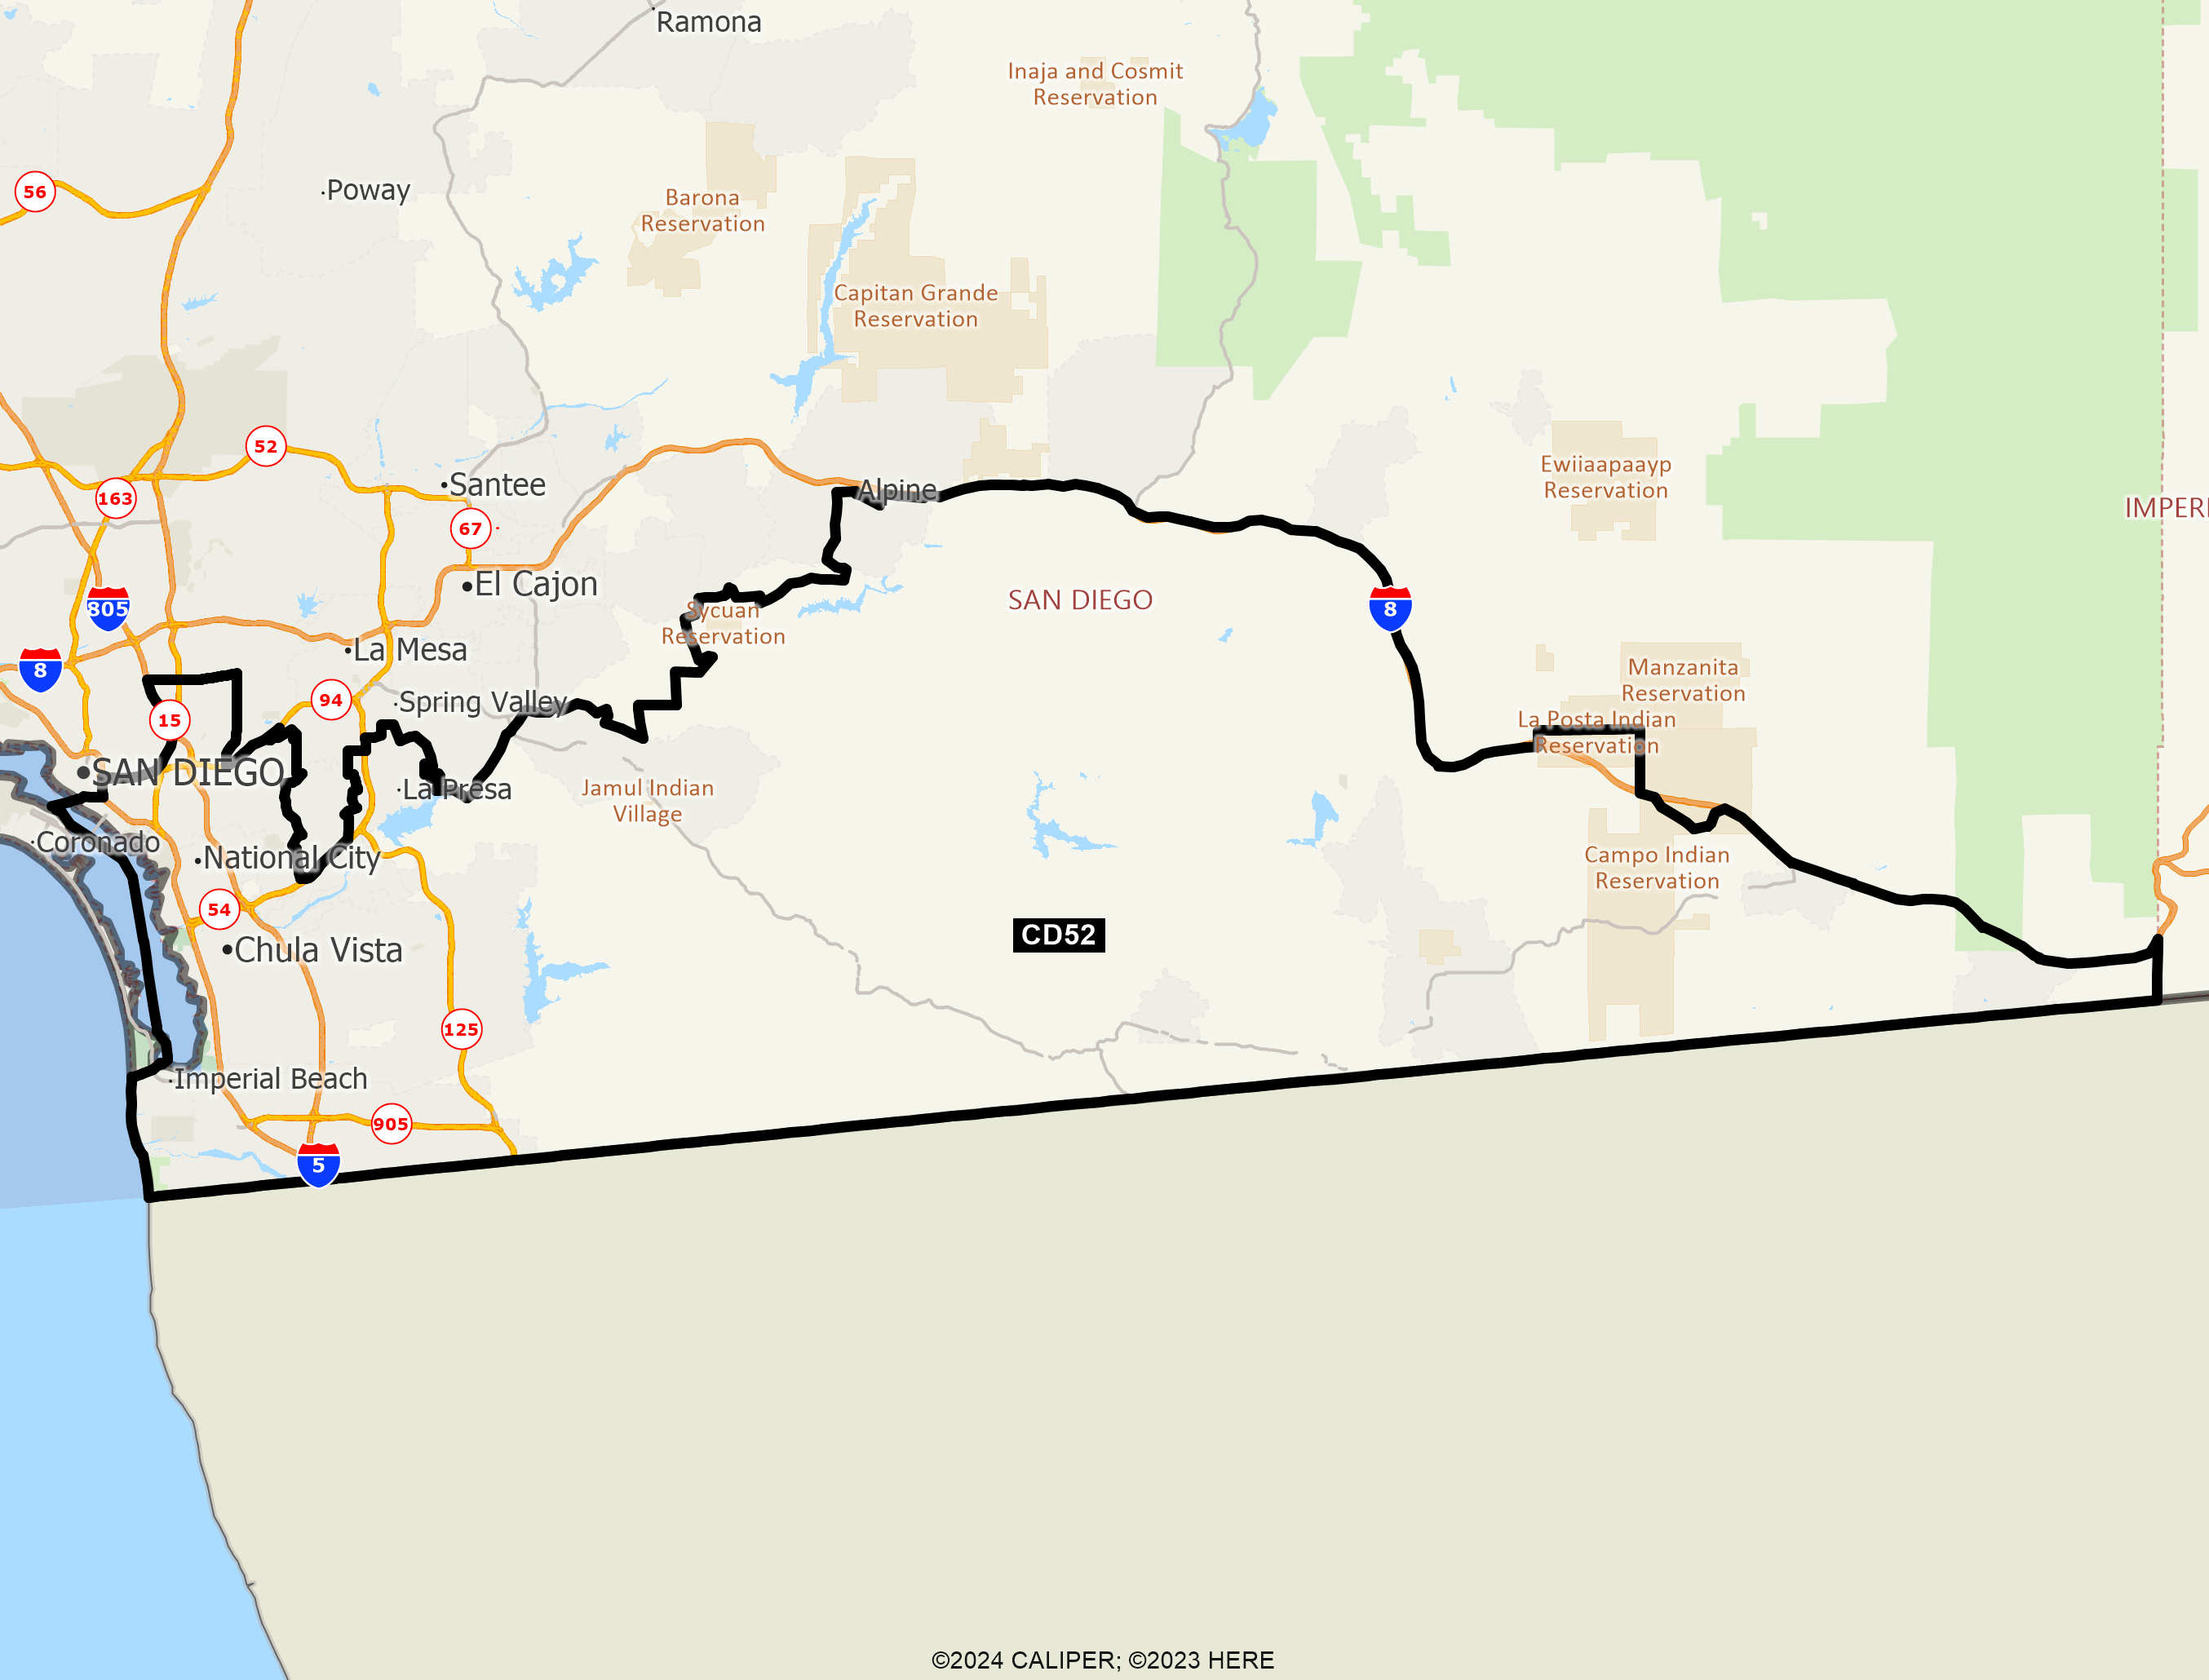
DISTRICT CD52
2020 Census Population (adj Elec. §21003 - SWDB 9/27/2021) Name Count Percent Total Population (POP) 760,066 100.00% POP Hispanic or Latino 459,616 60.47% POP Not Hispanic or Latino (NH) 300,450 39.53% POP NH Population of one race 275,182 36.21% POP NH White alone 117,198 15.42% POP NH Black or African American alone 50,960 6.70% POP NH Asian alone 98,430 12.95% POP NH American Indian and Alaska Native alone 2,033 0.27% POP NH Native Hawaiian and Other Pacific Islander alone 3,201 0.42% POP NH Some Other Race alone 3,360 0.44% POP NH Population of two or more races 25,268 3.32% POP DOJ NH Black or African American 54,915 7.23% POP DOJ NH Asian 107,242 14.11% POP DOJ NH American Indian and Alaska Native 4,485 0.59% POP DOJ NH Native Hawaiian and Other Pacific Islander 3,945 0.52% POP DOJ NH Some Other Race 5,145 0.68% POP DOJ NH Balance of Population of two or more races 7,520 0.99%
2020 Census Voting Age Population (adj Elec. §21003 - SWDB 9/27/2021) Name Count Percent Total Voting Age Population (VAP) 578,989 100.00% VAP Hispanic or Latino 333,256 57.56% VAP Not Hispanic or Latino (NH) 245,733 42.44% VAP NH Population of one race 229,403 39.62% VAP NH White alone 101,410 17.52% VAP NH Black or African American alone 40,318 6.96% VAP NH Asian alone 81,075 14.00% VAP NH American Indian and Alaska Native alone 1,658 0.29% VAP NH Native Hawaiian and Other Pacific Islander alone 2,619 0.45% VAP NH Some Other Race alone 2,323 0.40% VAP NH Population of two or more races 16,330 2.82% VAP DOJ NH Black or African American 42,565 7.35% VAP DOJ NH Asian 86,441 14.93% VAP DOJ NH American Indian and Alaska Native 3,675 0.63% VAP DOJ NH Native Hawaiian and Other Pacific Islander 3,152 0.54% VAP DOJ NH Some Other Race 3,718 0.64% VAP DOJ NH Balance of Population of two or more races 4,772 0.82%
2020 Census Housing Occupancy Status Name Count Percent Total Housing Units 234,900 100.00% Occupied 226,561 96.45% Vacant 8,339 3.55%
2020 Census Group Quarters Population (adj Elec. §21003 - SWDB 9/27/2021) Name Count Percent Total Group Quarters Population: 15,568 100.00% Institutionalized population: 5,510 35.39% Correctional facilities for adults 4,059 26.07% Juvenile facilities 174 1.12% Nursing facilities/Skilled-nursing facilities 1,078 6.92% Other institutional facilities 199 1.28% Noninstitutionalized population: 10,058 64.61% College/University student housing 0 0.00% Military quarters 6,844 43.96% Other noninstitutional facilities 3,214 20.64%
2019-2023 ACS Citizen Population (adj Elec. §21003 - SWDB 7/16/2025) Name Count Percent Total Citizen Population (CITZ) 664,403 100.00% CITZ Hispanic or Latino 375,784 56.56% CITZ Not Hispanic or Latino (NH) 288,524 43.43% CITZ NH White alone 125,686 18.92% CITZ NH Black or African American Alone 51,871 7.81% CITZ NH Asian Alone 83,635 12.59% CITZ NH American Indian and Alaska Native Alone 1,190 0.18% CITZ NH Native Hawaiian and Other Pacific Islander alone 3,422 0.52% CITZ NH Black or African American and White 3,941 0.59% CITZ NH American Indian or Alaska Native and White 10,297 1.55% CITZ NH Asian and White 1,561 0.23% CITZ NH American Indian or Alaska Native and Black or African American 884 0.13% CITZ NH Remainder of Two or More Race 6,235 0.94% CITZ DOJ NH Black or African American 55,812 8.40% CITZ DOJ NH Asian 93,932 14.14% CITZ DOJ NH American Indian and Alaska Native 2,751 0.41%
2019-2023 ACS Citizen Voting Age Population (adj Elec. §21003 - SWDB 7/16/2025) Name Count Percent Total Citizen Voting Age Population (CVAP) 490,770 100.00% CVAP Hispanic or Latino 254,254 51.81% CVAP Not Hispanic or Latino (NH) 236,321 48.15% CVAP NH White alone 110,215 22.46% CVAP NH Black or African American Alone 40,866 8.33% CVAP NH Asian Alone 67,846 13.82% CVAP NH American Indian and Alaska Native Alone 913 0.19% CVAP NH Native Hawaiian and Other Pacific Islander alone 2,868 0.58% CVAP NH Black or African American and White 2,476 0.50% CVAP NH Asian and White 5,865 1.20% CVAP NH American Indian or Alaska Native and White 1,272 0.26% CVAP NH American Indian or Alaska Native and Black or African American 649 0.13% CVAP NH Remainder of Two or More Race 3,386 0.69% CVAP DOJ NH Black or African American 43,342 8.83% CVAP DOJ NH Asian 73,711 15.02% CVAP DOJ NH American Indian and Alaska Native 2,185 0.45%
Counties In District Name Count Percent San Diego 760,058 23.02%
Places In District Name Count Percent SAN DIEGO: Alpine(U) 4,509 30.62% SAN DIEGO: Bonita(U) 12,944 100.00% SAN DIEGO: Boulevard(U) 359 100.00% SAN DIEGO: Campo(U) 2,970 100.00% SAN DIEGO: Chula Vista(C) 276,060 100.00% SAN DIEGO: Imperial Beach(C) 26,230 100.00% SAN DIEGO: Jacumba(U) 542 100.00% SAN DIEGO: Jamul(U) 6,196 100.00% SAN DIEGO: La Presa(U) 35,168 100.00% SAN DIEGO: National City(C) 56,373 100.00% SAN DIEGO: Potrero(U) 649 100.00% SAN DIEGO: San Diego(C) 321,629 23.14% SAN DIEGO: Remainder of San Diego(R) 16,429 10.21%
Senate Office of Demographics 02/2026