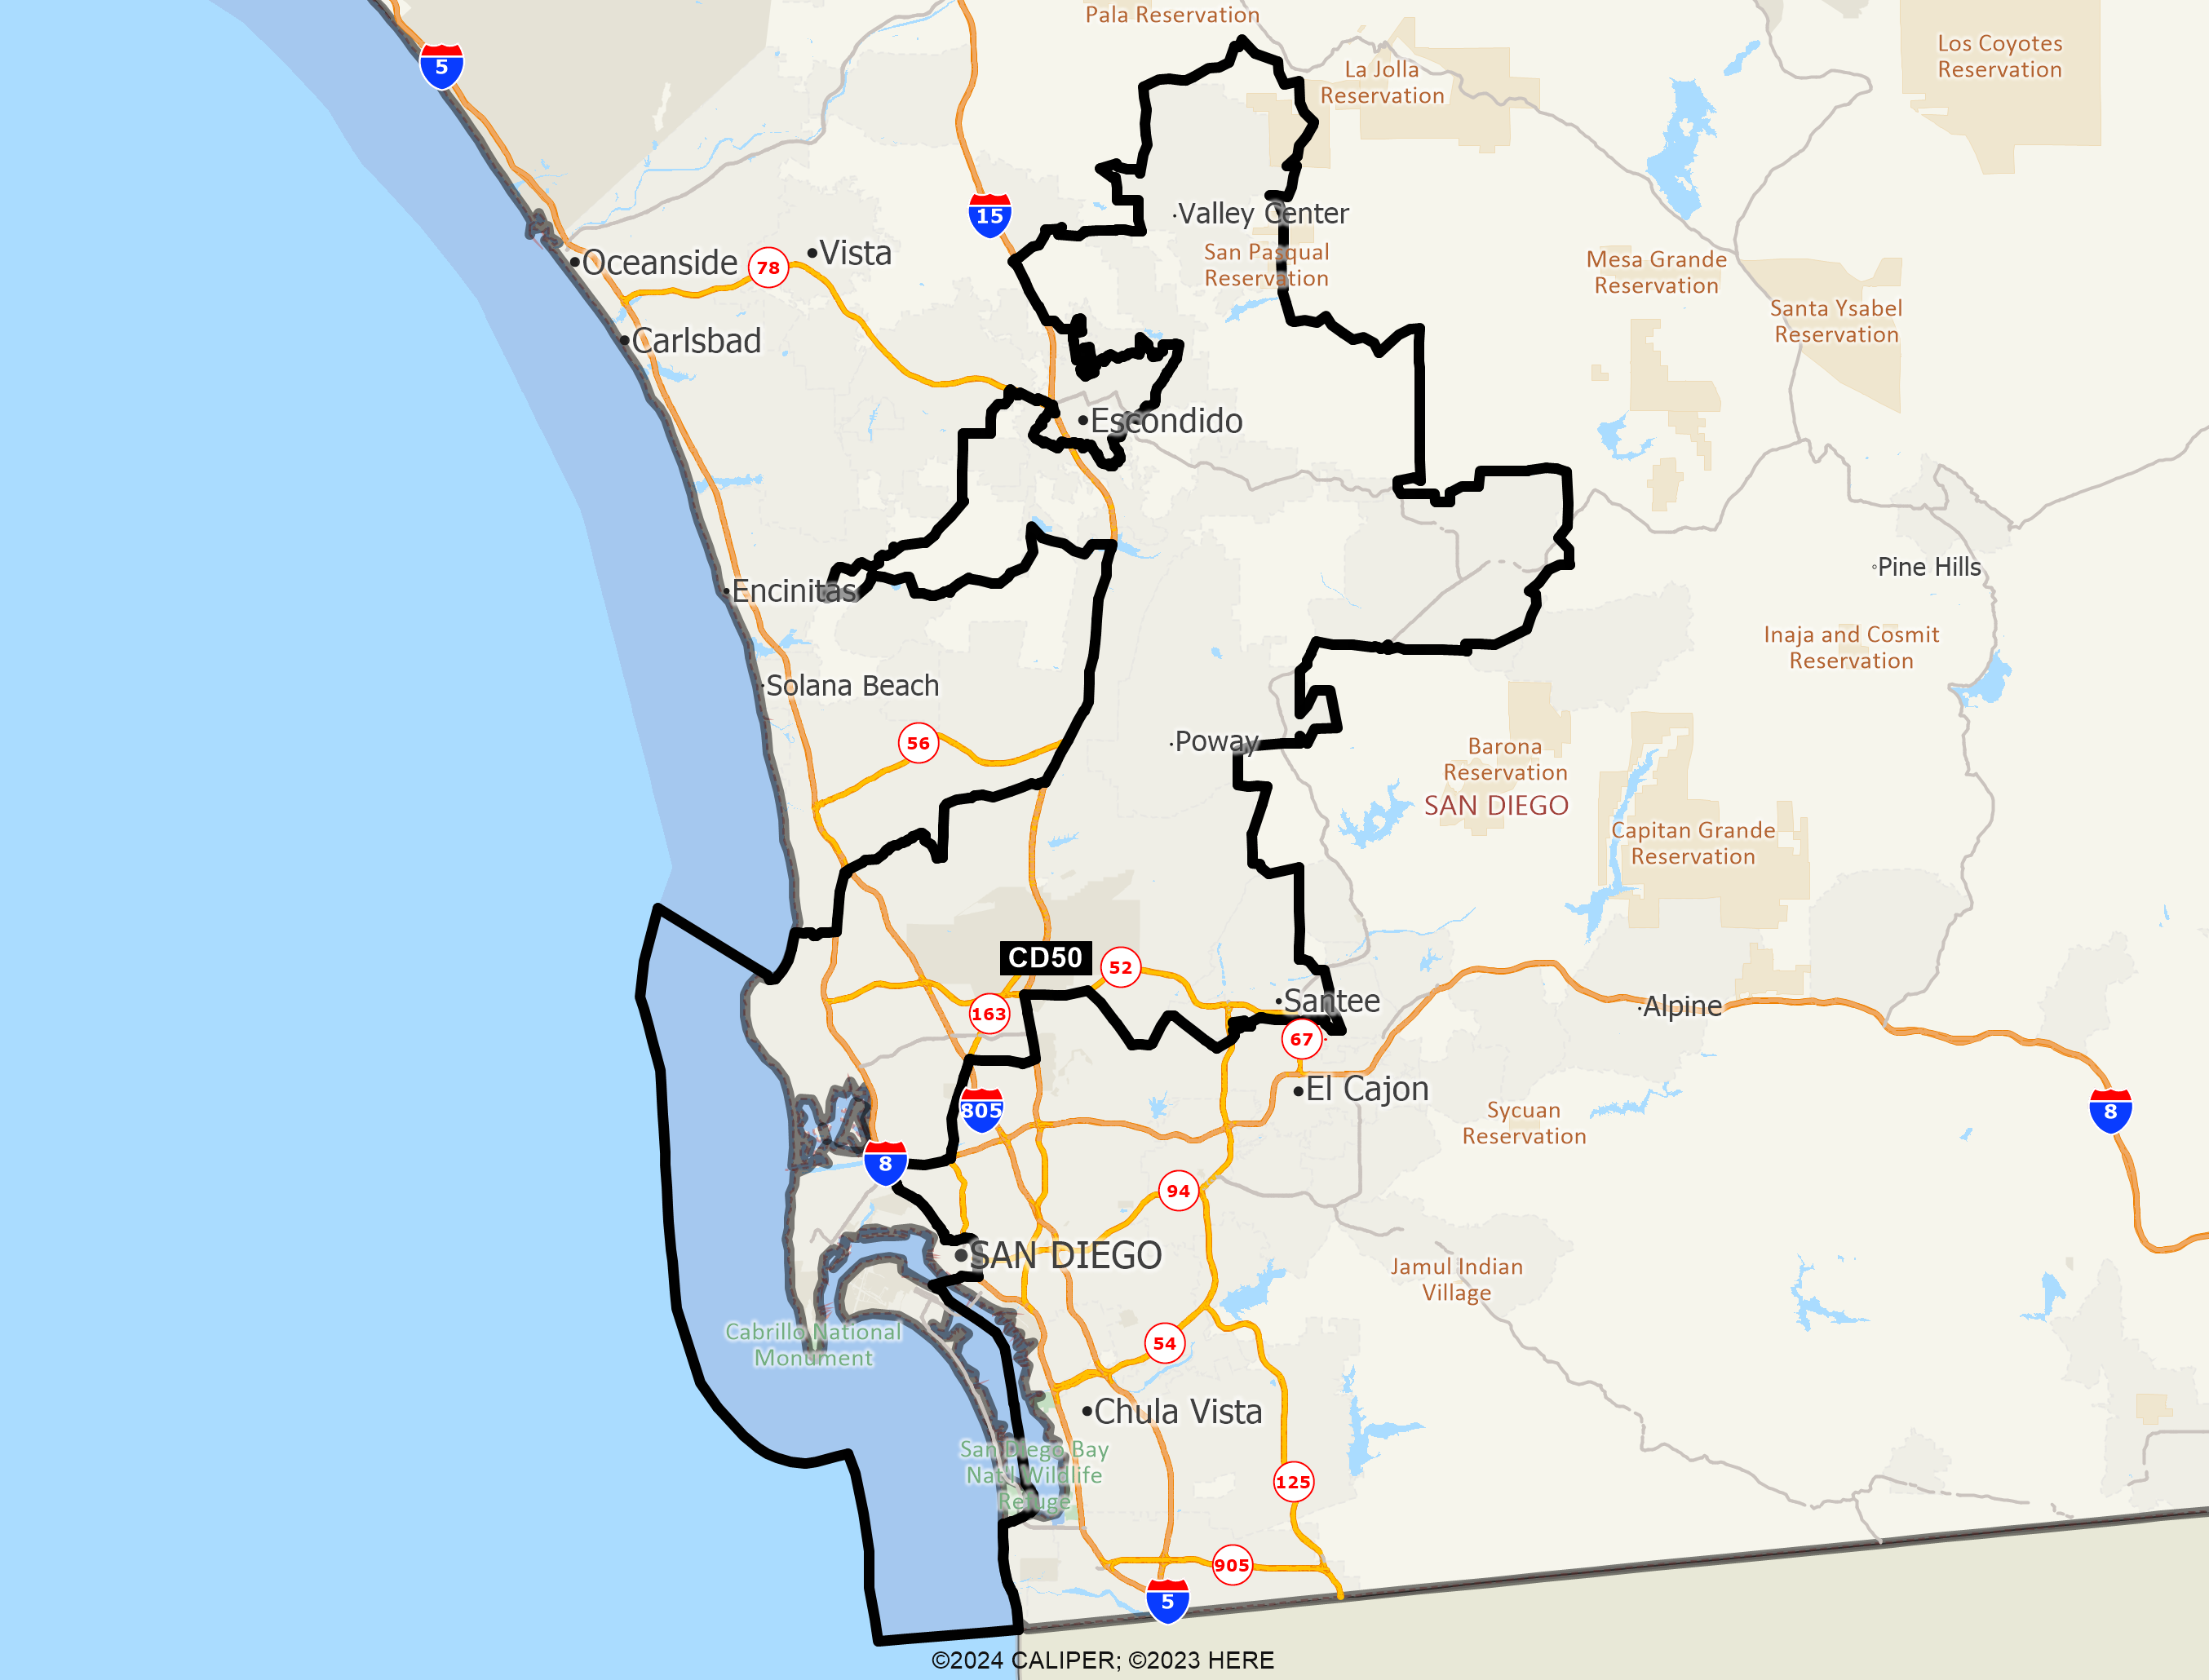
This Congressional district was established by the voters of California with the passage of Proposition 50 (2025) on November 4, 2025 and will go into effect after the November 2026 elections and upon seating of the 120th Congress, January 3, 2027. This district will stay in use until the California Citizens Redistricting Commission draws new maps following the 2030 U.S. Census .
DISTRICT CD50
2020 Census Population (adj Elec. §21003 - SWDB 9/27/2021) Name Count Percent Total Population (POP) 760,066 100.00% POP Hispanic or Latino 140,896 18.54% POP Not Hispanic or Latino (NH) 619,170 81.46% POP NH Population of one race 573,899 75.51% POP NH White alone 417,088 54.88% POP NH Black or African American alone 21,041 2.77% POP NH Asian alone 125,897 16.56% POP NH American Indian and Alaska Native alone 2,655 0.35% POP NH Native Hawaiian and Other Pacific Islander alone 2,193 0.29% POP NH Some Other Race alone 5,025 0.66% POP NH Population of two or more races 45,271 5.96% POP DOJ NH Black or African American 26,233 3.45% POP DOJ NH Asian 144,700 19.04% POP DOJ NH American Indian and Alaska Native 8,579 1.13% POP DOJ NH Native Hawaiian and Other Pacific Islander 3,447 0.45% POP DOJ NH Some Other Race 12,842 1.69% POP DOJ NH Balance of Population of two or more races 6,281 0.83%
2020 Census Voting Age Population (adj Elec. §21003 - SWDB 9/27/2021) Name Count Percent Total Voting Age Population (VAP) 628,261 100.00% VAP Hispanic or Latino 104,879 16.69% VAP Not Hispanic or Latino (NH) 523,382 83.31% VAP NH Population of one race 493,115 78.49% VAP NH White alone 360,541 57.39% VAP NH Black or African American alone 17,937 2.86% VAP NH Asian alone 106,587 16.97% VAP NH American Indian and Alaska Native alone 2,187 0.35% VAP NH Native Hawaiian and Other Pacific Islander alone 1,880 0.30% VAP NH Some Other Race alone 3,983 0.63% VAP NH Population of two or more races 30,267 4.82% VAP DOJ NH Black or African American 21,243 3.38% VAP DOJ NH Asian 117,512 18.70% VAP DOJ NH American Indian and Alaska Native 7,056 1.12% VAP DOJ NH Native Hawaiian and Other Pacific Islander 2,789 0.44% VAP DOJ NH Some Other Race 10,200 1.62% VAP DOJ NH Balance of Population of two or more races 4,041 0.64%
2020 Census Housing Occupancy Status Name Count Percent Total Housing Units 317,768 100.00% Occupied 293,690 92.42% Vacant 24,078 7.58%
2020 Census Group Quarters Population (adj Elec. §21003 - SWDB 9/27/2021) Name Count Percent Total Group Quarters Population: 38,620 100.00% Institutionalized population: 5,680 14.71% Correctional facilities for adults 2,468 6.39% Juvenile facilities 147 0.38% Nursing facilities/Skilled-nursing facilities 2,954 7.65% Other institutional facilities 111 0.29% Noninstitutionalized population: 32,940 85.29% College/University student housing 9,728 25.19% Military quarters 13,751 35.61% Other noninstitutional facilities 9,461 24.50%
2019-2023 ACS Citizen Population (adj Elec. §21003 - SWDB 7/16/2025) Name Count Percent Total Citizen Population (CITZ) 687,161 100.00% CITZ Hispanic or Latino 128,729 18.73% CITZ Not Hispanic or Latino (NH) 558,490 81.27% CITZ NH White alone 405,980 59.08% CITZ NH Black or African American Alone 20,067 2.92% CITZ NH Asian Alone 93,497 13.61% CITZ NH American Indian and Alaska Native Alone 1,663 0.24% CITZ NH Native Hawaiian and Other Pacific Islander alone 2,089 0.30% CITZ NH Black or African American and White 6,106 0.89% CITZ NH American Indian or Alaska Native and White 17,819 2.59% CITZ NH Asian and White 4,216 0.61% CITZ NH American Indian or Alaska Native and Black or African American 372 0.05% CITZ NH Remainder of Two or More Race 6,843 1.00% CITZ DOJ NH Black or African American 26,173 3.81% CITZ DOJ NH Asian 111,316 16.20% CITZ DOJ NH American Indian and Alaska Native 5,879 0.86%
2019-2023 ACS Citizen Voting Age Population (adj Elec. §21003 - SWDB 7/16/2025) Name Count Percent Total Citizen Voting Age Population (CVAP) 560,570 100.00% CVAP Hispanic or Latino 90,355 16.12% CVAP Not Hispanic or Latino (NH) 470,375 83.91% CVAP NH White alone 349,392 62.33% CVAP NH Black or African American Alone 17,860 3.19% CVAP NH Asian Alone 77,994 13.91% CVAP NH American Indian and Alaska Native Alone 1,295 0.23% CVAP NH Native Hawaiian and Other Pacific Islander alone 1,803 0.32% CVAP NH Black or African American and White 3,549 0.63% CVAP NH Asian and White 10,408 1.86% CVAP NH American Indian or Alaska Native and White 3,372 0.60% CVAP NH American Indian or Alaska Native and Black or African American 342 0.06% CVAP NH Remainder of Two or More Race 4,532 0.81% CVAP DOJ NH Black or African American 21,409 3.82% CVAP DOJ NH Asian 88,402 15.77% CVAP DOJ NH American Indian and Alaska Native 4,667 0.83%
Counties In District Name Count Percent San Diego 760,066 23.02%
Places In District Name Count Percent SAN DIEGO: Coronado(C) 20,226 100.00% SAN DIEGO: Del Dios(U) 399 100.00% SAN DIEGO: Escondido(C) 39,837 26.29% SAN DIEGO: Harmony Grove(U) 2,084 100.00% SAN DIEGO: Poway(C) 48,924 100.00% SAN DIEGO: Ramona(U) 21,432 99.46% SAN DIEGO: San Diego(C) 534,283 38.44% SAN DIEGO: Santee(C) 60,173 100.00% SAN DIEGO: Valley Center(U) 10,112 100.00% SAN DIEGO: Remainder of San Diego(R) 22,596 14.05%
Senate Office of Demographics 02/2026