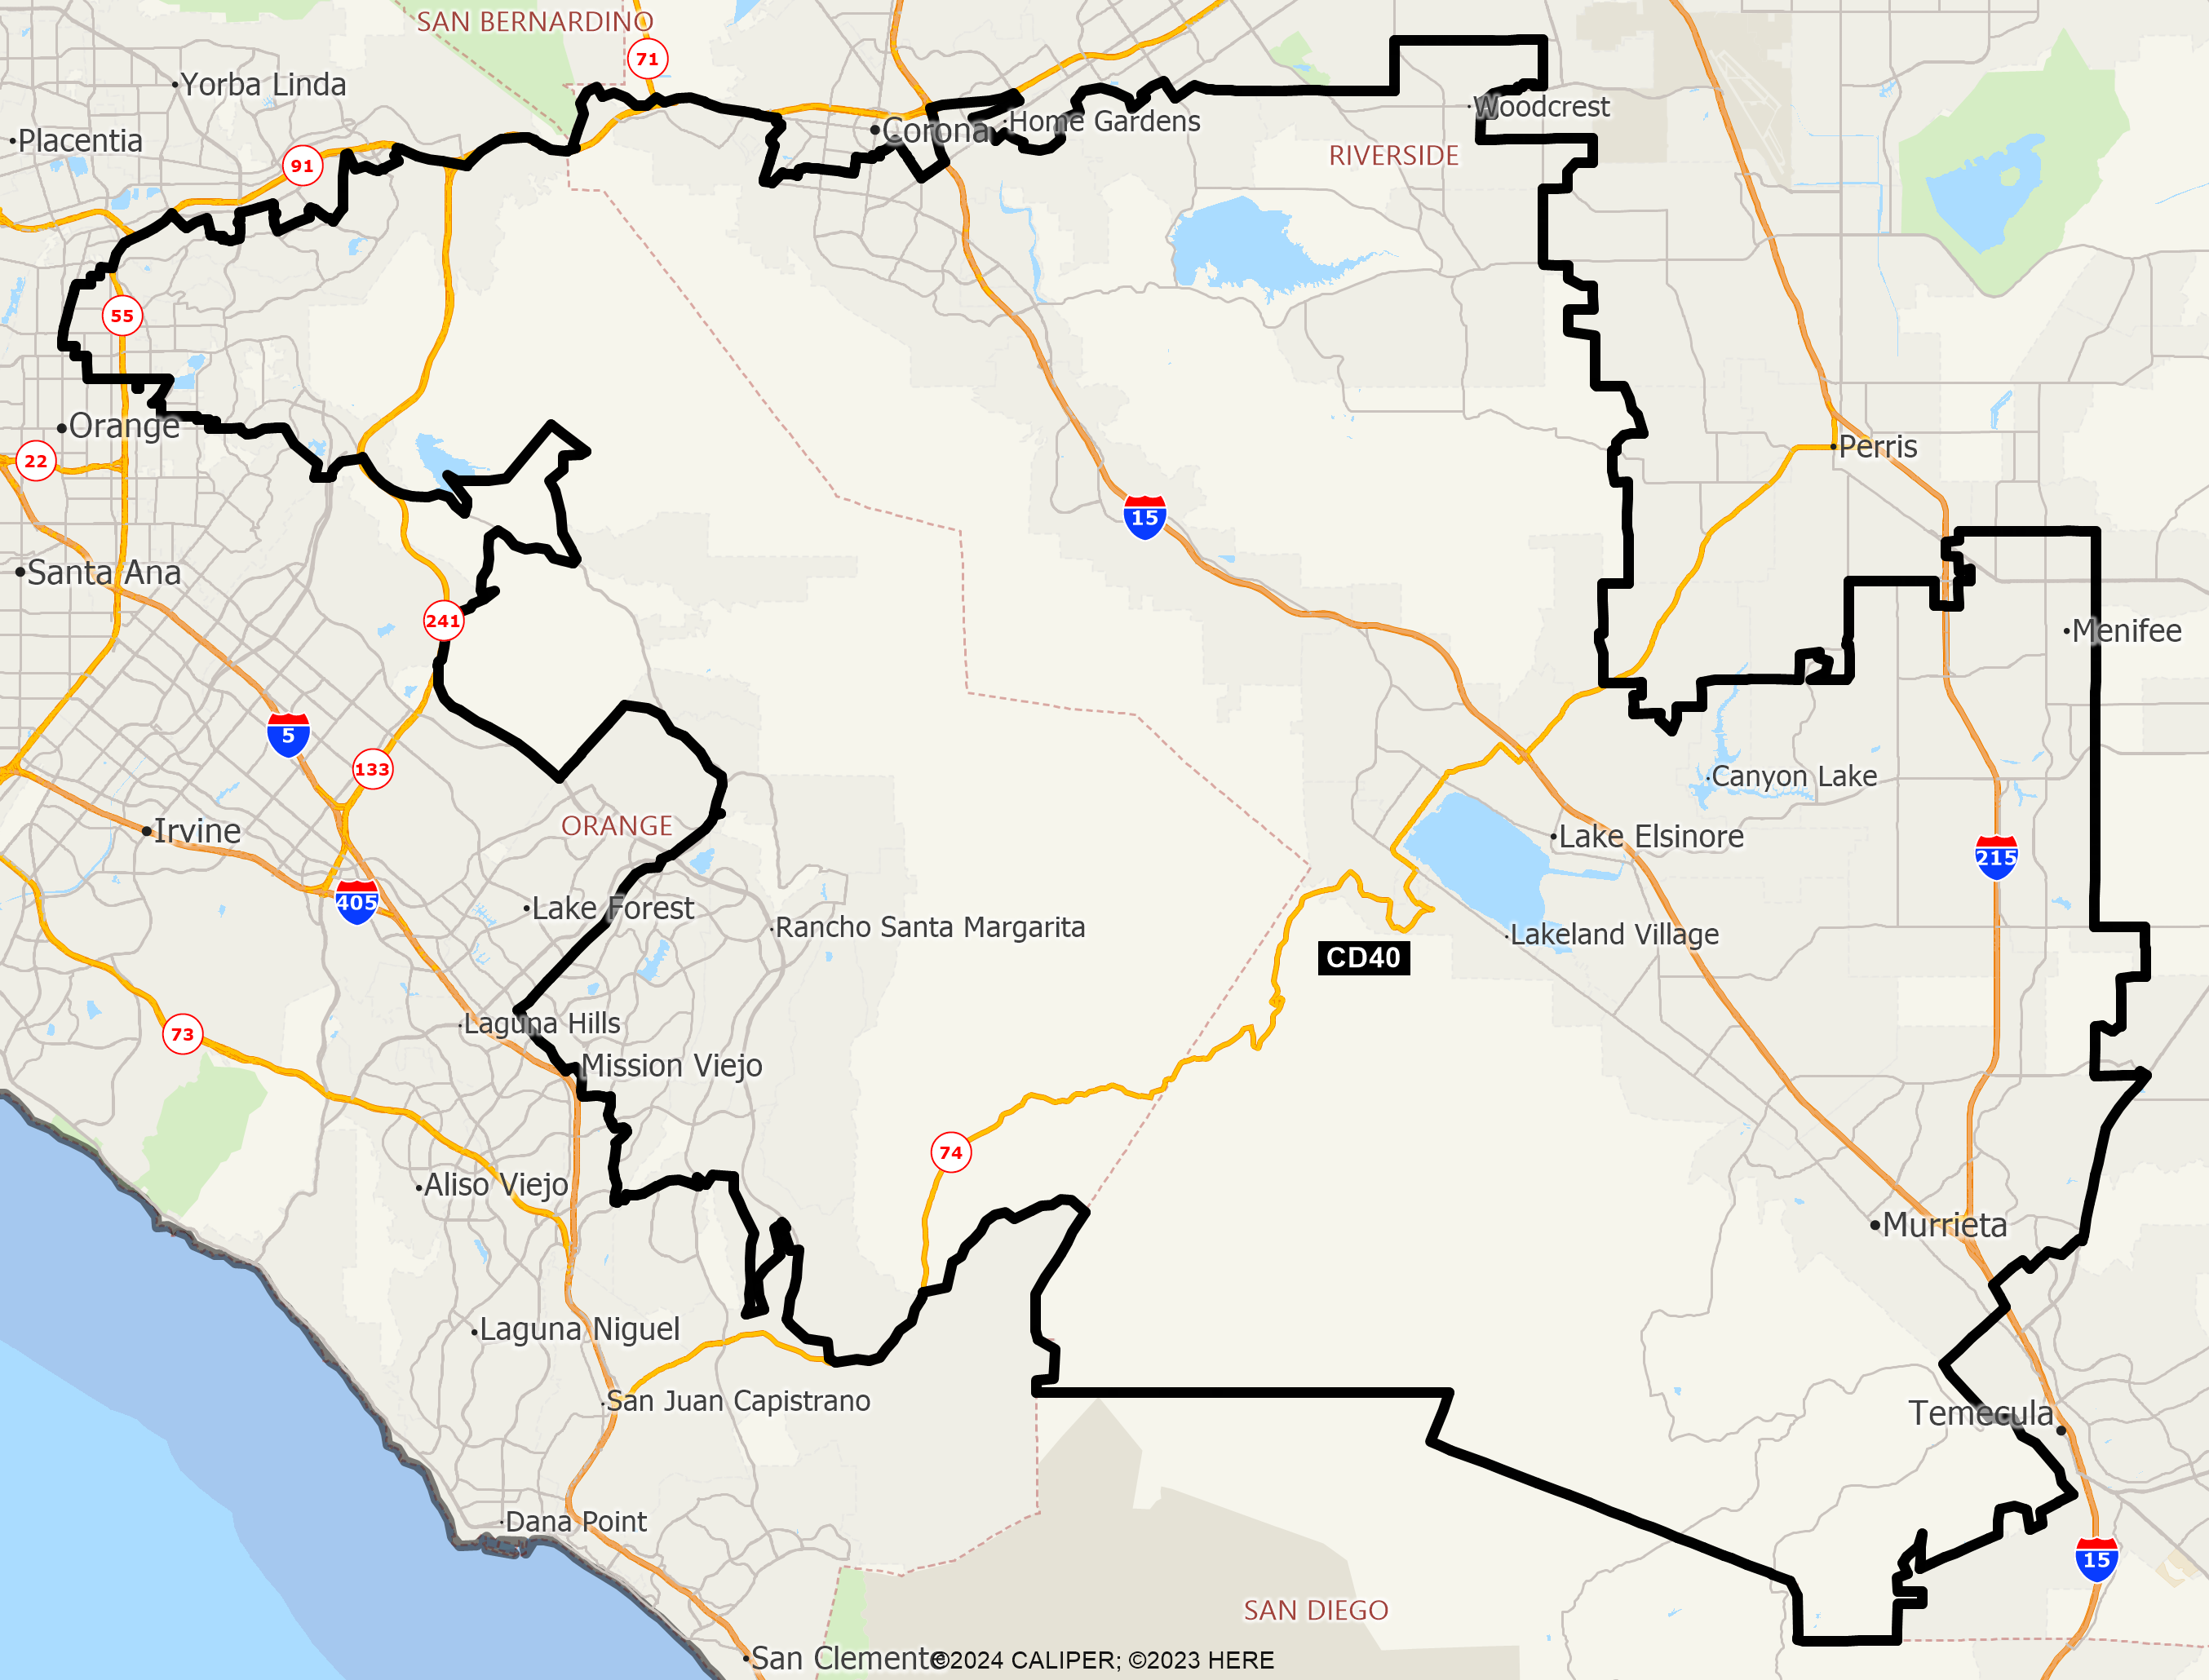
This Congressional district was established by the voters of California with the passage of Proposition 50 (2025) on November 4, 2025 and will go into effect after the November 2026 elections and upon seating of the 120th Congress, January 3, 2027. This district will stay in use until the California Citizens Redistricting Commission draws new maps following the 2030 U.S. Census .
DISTRICT CD40
2020 Census Population (adj Elec. §21003 - SWDB 9/27/2021) Name Count Percent Total Population (POP) 760,066 100.00% POP Hispanic or Latino 243,980 32.10% POP Not Hispanic or Latino (NH) 516,086 67.90% POP NH Population of one race 478,750 62.99% POP NH White alone 359,388 47.28% POP NH Black or African American alone 31,016 4.08% POP NH Asian alone 79,899 10.51% POP NH American Indian and Alaska Native alone 2,304 0.30% POP NH Native Hawaiian and Other Pacific Islander alone 2,187 0.29% POP NH Some Other Race alone 3,956 0.52% POP NH Population of two or more races 37,336 4.91% POP DOJ NH Black or African American 35,900 4.72% POP DOJ NH Asian 93,840 12.35% POP DOJ NH American Indian and Alaska Native 8,551 1.13% POP DOJ NH Native Hawaiian and Other Pacific Islander 3,382 0.44% POP DOJ NH Some Other Race 9,180 1.21% POP DOJ NH Balance of Population of two or more races 5,845 0.77%
2020 Census Voting Age Population (adj Elec. §21003 - SWDB 9/27/2021) Name Count Percent Total Voting Age Population (VAP) 583,018 100.00% VAP Hispanic or Latino 169,029 28.99% VAP Not Hispanic or Latino (NH) 413,989 71.01% VAP NH Population of one race 390,586 66.99% VAP NH White alone 294,665 50.54% VAP NH Black or African American alone 24,530 4.21% VAP NH Asian alone 64,989 11.15% VAP NH American Indian and Alaska Native alone 1,813 0.31% VAP NH Native Hawaiian and Other Pacific Islander alone 1,733 0.30% VAP NH Some Other Race alone 2,856 0.49% VAP NH Population of two or more races 23,403 4.01% VAP DOJ NH Black or African American 27,186 4.66% VAP DOJ NH Asian 72,543 12.44% VAP DOJ NH American Indian and Alaska Native 6,741 1.16% VAP DOJ NH Native Hawaiian and Other Pacific Islander 2,454 0.42% VAP DOJ NH Some Other Race 6,800 1.17% VAP DOJ NH Balance of Population of two or more races 3,600 0.62%
2020 Census Housing Occupancy Status Name Count Percent Total Housing Units 257,281 100.00% Occupied 248,576 96.62% Vacant 8,705 3.38%
2020 Census Group Quarters Population (adj Elec. §21003 - SWDB 9/27/2021) Name Count Percent Total Group Quarters Population: 3,256 100.00% Institutionalized population: 955 29.33% Correctional facilities for adults 10 0.31% Juvenile facilities 153 4.70% Nursing facilities/Skilled-nursing facilities 792 24.32% Other institutional facilities 0 0.00% Noninstitutionalized population: 2,301 70.67% College/University student housing 432 13.27% Military quarters 0 0.00% Other noninstitutional facilities 1,869 57.40%
2019-2023 ACS Citizen Population (adj Elec. §21003 - SWDB 7/16/2025) Name Count Percent Total Citizen Population (CITZ) 727,835 100.00% CITZ Hispanic or Latino 230,669 31.69% CITZ Not Hispanic or Latino (NH) 497,208 68.31% CITZ NH White alone 359,993 49.46% CITZ NH Black or African American Alone 31,833 4.37% CITZ NH Asian Alone 69,886 9.60% CITZ NH American Indian and Alaska Native Alone 1,552 0.21% CITZ NH Native Hawaiian and Other Pacific Islander alone 2,070 0.28% CITZ NH Black or African American and White 6,115 0.84% CITZ NH American Indian or Alaska Native and White 15,743 2.16% CITZ NH Asian and White 3,631 0.50% CITZ NH American Indian or Alaska Native and Black or African American 462 0.06% CITZ NH Remainder of Two or More Race 6,229 0.86% CITZ DOJ NH Black or African American 37,948 5.21% CITZ DOJ NH Asian 85,629 11.76% CITZ DOJ NH American Indian and Alaska Native 5,183 0.71%
2019-2023 ACS Citizen Voting Age Population (adj Elec. §21003 - SWDB 7/16/2025) Name Count Percent Total Citizen Voting Age Population (CVAP) 543,973 100.00% CVAP Hispanic or Latino 152,392 28.01% CVAP Not Hispanic or Latino (NH) 391,732 72.01% CVAP NH White alone 291,303 53.55% CVAP NH Black or African American Alone 25,272 4.65% CVAP NH Asian Alone 55,976 10.29% CVAP NH American Indian and Alaska Native Alone 1,181 0.22% CVAP NH Native Hawaiian and Other Pacific Islander alone 1,580 0.29% CVAP NH Black or African American and White 3,065 0.56% CVAP NH Asian and White 7,230 1.33% CVAP NH American Indian or Alaska Native and White 2,856 0.53% CVAP NH American Indian or Alaska Native and Black or African American 292 0.05% CVAP NH Remainder of Two or More Race 3,118 0.57% CVAP DOJ NH Black or African American 28,337 5.21% CVAP DOJ NH Asian 63,206 11.62% CVAP DOJ NH American Indian and Alaska Native 4,037 0.74%
Counties In District Name Count Percent Orange 248,655 7.79% Riverside 511,411 21.16%
Places In District Name Count Percent ORANGE: Anaheim(C) 32,345 9.30% ORANGE: Coto de Caza(U) 14,723 100.00% ORANGE: Ladera Ranch(U) 3,662 13.98% ORANGE: Las Flores(U) 6,004 100.00% ORANGE: Mission Viejo(C) 79,045 84.31% ORANGE: Modjeska(U) 632 100.00% ORANGE: Orange(C) 52,272 37.29% ORANGE: Rancho Mission Viejo(U) 623 6.00% ORANGE: Rancho Santa Margarita(C) 47,999 100.00% ORANGE: Silverado(U) 932 100.00% ORANGE: Trabuco Canyon(U) 1,020 100.00% ORANGE: Villa Park(C) 5,850 100.00% ORANGE: Williams Canyon(U) 93 100.00% ORANGE: Remainder of Orange(R) 3,455 12.41% RIVERSIDE: Canyon Lake(C) 11,112 100.00% RIVERSIDE: Corona(C) 81,360 51.60% RIVERSIDE: Coronita(U) 2,653 100.00% RIVERSIDE: El Cerrito(U) 5,075 100.00% RIVERSIDE: El Sobrante(U) 14,061 100.00% RIVERSIDE: Lake Elsinore(C) 70,516 100.00% RIVERSIDE: Lakeland Village(U) 12,423 100.00% RIVERSIDE: Lake Mathews(U) 5,991 100.00% RIVERSIDE: Menifee(C) 102,795 100.00% RIVERSIDE: Murrieta(C) 111,188 100.00% RIVERSIDE: Temescal Valley(U) 26,290 100.00% RIVERSIDE: Warm Springs(U) 1,599 100.00% RIVERSIDE: Wildomar(C) 36,998 100.00% RIVERSIDE: Woodcrest(U) 15,417 100.00% RIVERSIDE: Remainder of Riverside(R) 13,933 17.93%
Senate Office of Demographics 02/2026