This Congressional district was established by the voters of California with the passage of Proposition 50 (2025) on November 4, 2025 and will go into effect after the November 2026 elections and upon seating of the 120th Congress, January 3, 2027. This district will stay in use until the California Citizens Redistricting Commission draws new maps following the 2030 U.S. Census .
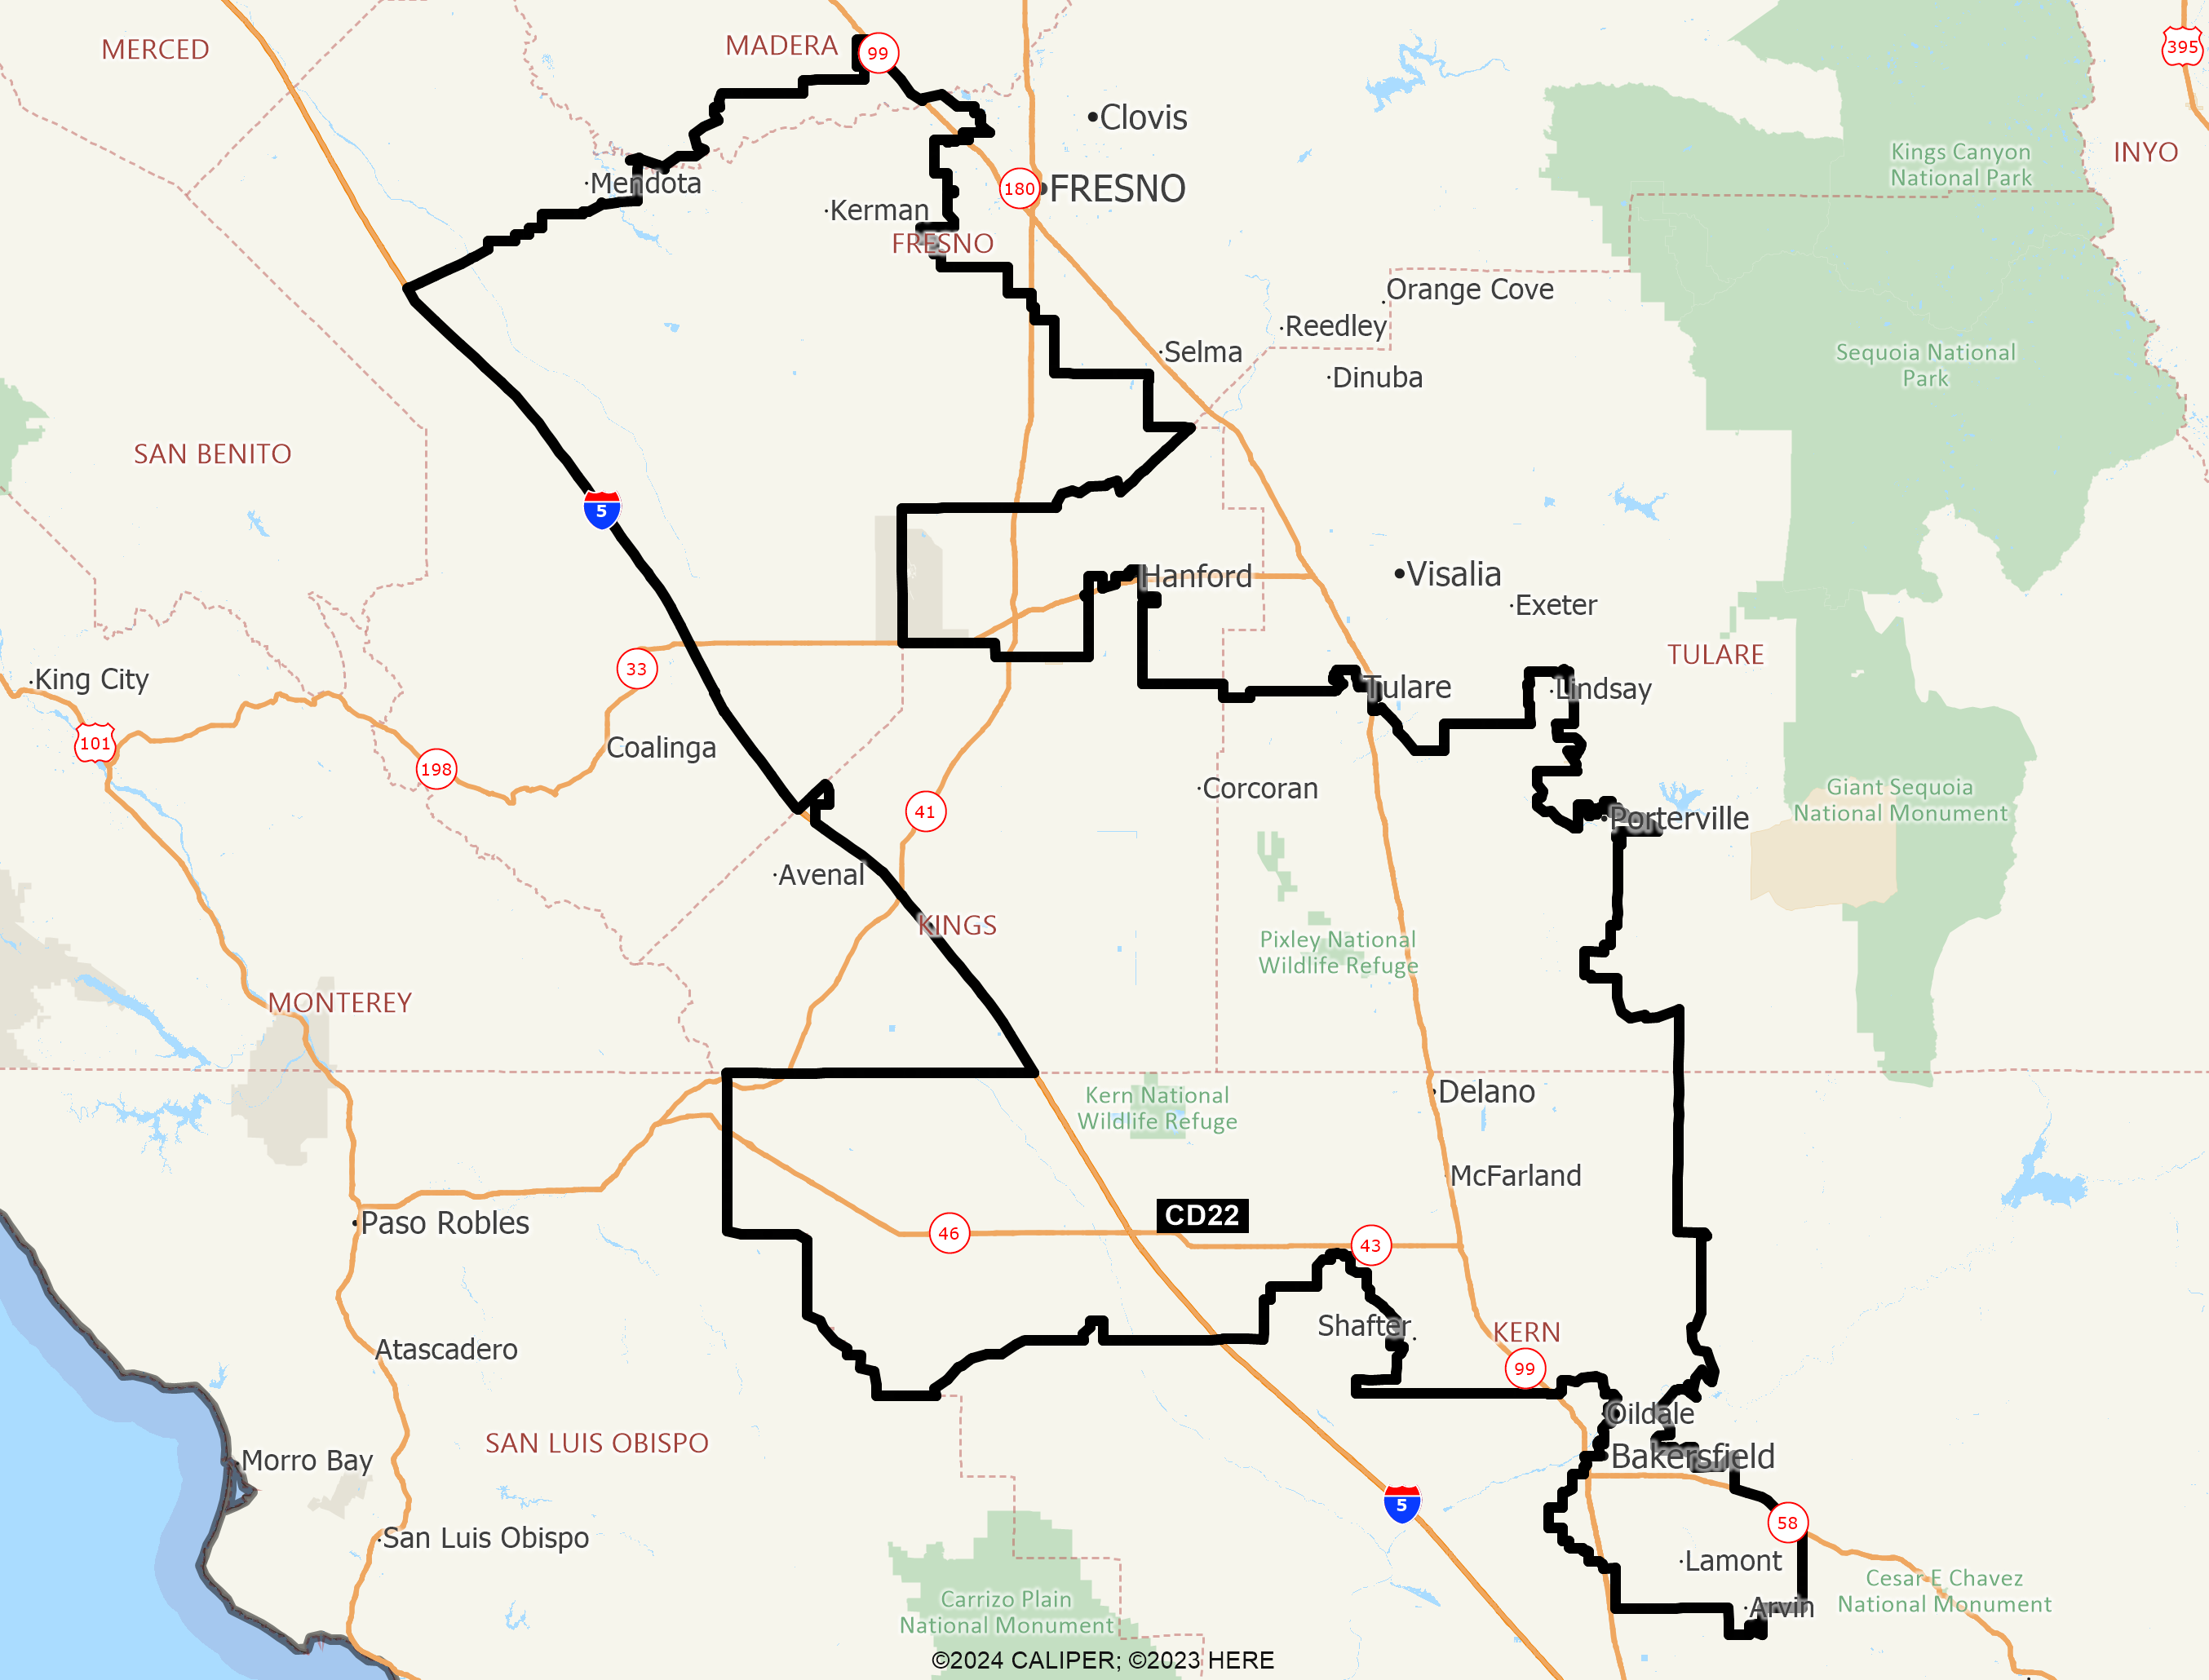
DISTRICT CD22
2020 Census Population (adj Elec. §21003 - SWDB 9/27/2021) Name Count Percent Total Population (POP) 760,066 100.00% POP Hispanic or Latino 563,305 74.11% POP Not Hispanic or Latino (NH) 196,761 25.89% POP NH Population of one race 183,393 24.13% POP NH White alone 107,893 14.20% POP NH Black or African American alone 32,312 4.25% POP NH Asian alone 35,132 4.62% POP NH American Indian and Alaska Native alone 3,988 0.52% POP NH Native Hawaiian and Other Pacific Islander alone 708 0.09% POP NH Some Other Race alone 3,360 0.44% POP NH Population of two or more races 13,368 1.76% POP DOJ NH Black or African American 35,026 4.61% POP DOJ NH Asian 37,373 4.92% POP DOJ NH American Indian and Alaska Native 7,843 1.03% POP DOJ NH Native Hawaiian and Other Pacific Islander 958 0.13% POP DOJ NH Some Other Race 4,848 0.64% POP DOJ NH Balance of Population of two or more races 2,820 0.37%
2020 Census Voting Age Population (adj Elec. §21003 - SWDB 9/27/2021) Name Count Percent Total Voting Age Population (VAP) 521,624 100.00% VAP Hispanic or Latino 367,745 70.50% VAP Not Hispanic or Latino (NH) 153,879 29.50% VAP NH Population of one race 145,067 27.81% VAP NH White alone 88,731 17.01% VAP NH Black or African American alone 22,921 4.39% VAP NH Asian alone 27,863 5.34% VAP NH American Indian and Alaska Native alone 2,876 0.55% VAP NH Native Hawaiian and Other Pacific Islander alone 507 0.10% VAP NH Some Other Race alone 2,169 0.42% VAP NH Population of two or more races 8,812 1.69% VAP DOJ NH Black or African American 24,218 4.64% VAP DOJ NH Asian 29,215 5.60% VAP DOJ NH American Indian and Alaska Native 5,899 1.13% VAP DOJ NH Native Hawaiian and Other Pacific Islander 680 0.13% VAP DOJ NH Some Other Race 3,324 0.64% VAP DOJ NH Balance of Population of two or more races 1,812 0.35%
2020 Census Housing Occupancy Status Name Count Percent Total Housing Units 224,216 100.00% Occupied 214,363 95.61% Vacant 9,853 4.39%
2020 Census Group Quarters Population (adj Elec. §21003 - SWDB 9/27/2021) Name Count Percent Total Group Quarters Population: 7,530 100.00% Institutionalized population: 3,915 51.99% Correctional facilities for adults 1,994 26.48% Juvenile facilities 244 3.24% Nursing facilities/Skilled-nursing facilities 1,655 21.98% Other institutional facilities 22 0.29% Noninstitutionalized population: 3,615 48.01% College/University student housing 40 0.53% Military quarters 0 0.00% Other noninstitutional facilities 3,575 47.48%
2019-2023 ACS Citizen Population (adj Elec. §21003 - SWDB 7/16/2025) Name Count Percent Total Citizen Population (CITZ) 628,995 100.00% CITZ Hispanic or Latino 448,847 71.36% CITZ Not Hispanic or Latino (NH) 179,912 28.60% CITZ NH White alone 110,870 17.63% CITZ NH Black or African American Alone 30,834 4.90% CITZ NH Asian Alone 24,655 3.92% CITZ NH American Indian and Alaska Native Alone 2,513 0.40% CITZ NH Native Hawaiian and Other Pacific Islander alone 917 0.15% CITZ NH Black or African American and White 3,548 0.56% CITZ NH American Indian or Alaska Native and White 2,018 0.32% CITZ NH Asian and White 2,069 0.33% CITZ NH American Indian or Alaska Native and Black or African American 461 0.07% CITZ NH Remainder of Two or More Race 1,857 0.30% CITZ DOJ NH Black or African American 34,382 5.47% CITZ DOJ NH Asian 26,673 4.24% CITZ DOJ NH American Indian and Alaska Native 4,582 0.73%
2019-2023 ACS Citizen Voting Age Population (adj Elec. §21003 - SWDB 7/16/2025) Name Count Percent Total Citizen Voting Age Population (CVAP) 398,979 100.00% CVAP Hispanic or Latino 260,843 65.38% CVAP Not Hispanic or Latino (NH) 137,808 34.54% CVAP NH White alone 88,862 22.27% CVAP NH Black or African American Alone 21,864 5.48% CVAP NH Asian Alone 18,719 4.69% CVAP NH American Indian and Alaska Native Alone 1,917 0.48% CVAP NH Native Hawaiian and Other Pacific Islander alone 638 0.16% CVAP NH Black or African American and White 1,344 0.34% CVAP NH Asian and White 1,186 0.30% CVAP NH American Indian or Alaska Native and White 1,786 0.45% CVAP NH American Indian or Alaska Native and Black or African American 461 0.12% CVAP NH Remainder of Two or More Race 1,014 0.25% CVAP DOJ NH Black or African American 23,208 5.82% CVAP DOJ NH Asian 19,905 4.99% CVAP DOJ NH American Indian and Alaska Native 3,703 0.93%
Counties In District Name Count Percent Fresno 109,900 10.90% Kern 475,206 53.23% Kings 43,139 30.74% Madera 1,099 0.73% Tulare 130,725 27.52%
Places In District Name Count Percent FRESNO: Biola(U) 1,436 100.00% FRESNO: Cantua Creek(U) 503 100.00% FRESNO: Caruthers(U) 2,619 100.00% FRESNO: Fresno(C) 46,980 8.63% FRESNO: Huron(C) 6,230 100.00% FRESNO: Kerman(C) 16,058 100.00% FRESNO: Lanare(U) 542 100.00% FRESNO: Laton(U) 1,630 100.00% FRESNO: Raisin City(U) 306 100.00% FRESNO: Riverdale(U) 3,491 100.00% FRESNO: San Joaquin(C) 3,710 100.00% FRESNO: Three Rocks(U) 249 100.00% FRESNO: Tranquillity(U) 806 100.00% FRESNO: Westside(U) 143 100.00% FRESNO: Remainder of Fresno(R) 25,197 22.14% KERN: Arvin(C) 19,565 100.00% KERN: Bakersfield(C) 226,936 56.01% KERN: Benton Park(U) 5,366 100.00% KERN: Casa Loma(U) 1,818 100.00% KERN: Cherokee Strip(U) 206 100.00% KERN: Cottonwood(U) 4,000 100.00% KERN: Delano(C) 43,637 100.00% KERN: Di Giorgio(U) 401 100.00% KERN: East Bakersfield(U) 9,837 100.00% KERN: East Niles(U) 28,552 100.00% KERN: Edison(U) 256 100.00% KERN: Edmundson Acres(U) 297 100.00% KERN: El Adobe(U) 396 100.00% KERN: Fairfax(U) 1,894 100.00% KERN: Fuller Acres(U) 925 100.00% KERN: Goodmanville(U) 121 100.00% KERN: Greenfield(U) 3,470 100.00% KERN: Hillcrest(U) 10,585 100.00% KERN: La Cresta(U) 8,856 100.00% KERN: Lamont(U) 14,115 100.00% KERN: Lost Hills(U) 2,381 100.00% KERN: McFarland(C) 13,818 100.00% KERN: Mexican Colony(U) 283 100.00% KERN: Oildale(U) 0 0.00% KERN: Old Stine(U) 3,861 100.00% KERN: Potomac Park(U) 9,231 100.00% KERN: Pumpkin Center(U) 426 100.00% KERN: Rexland Acres(U) 3,585 100.00% KERN: Rivergrove(U) 195 100.00% KERN: Shafter(C) 19,468 100.00% KERN: Smith Corner(U) 598 100.00% KERN: Wasco(C) 22,800 100.00% KERN: Weedpatch(U) 2,214 100.00% KERN: Remainder of Kern(R) 15,113 34.38% KINGS: Armona(U) 2,891 67.12% KINGS: Corcoran(C) 13,648 100.00% KINGS: Hanford(C) 18,746 32.13% KINGS: Home Garden(U) 1,678 100.00% KINGS: Kettleman City(U) 1,253 100.00% KINGS: Stratford(U) 1,132 100.00% KINGS: Remainder of Kings(R) 3,791 23.64% MADERA: Remainder of Madera(R) 1,099 4.82% TULARE: Allensworth(U) 532 100.00% TULARE: Alpaugh(U) 873 100.00% TULARE: Ducor(U) 620 100.00% TULARE: Earlimart(U) 7,719 100.00% TULARE: East Porterville(U) 5,583 100.00% TULARE: El Rancho(U) 97 100.00% TULARE: Jovista(U) 41 100.00% TULARE: Lindsay(C) 12,732 100.00% TULARE: Matheny(U) 1,139 100.00% TULARE: Pixley(U) 3,866 100.00% TULARE: Plainview(U) 850 100.00% TULARE: Poplar-Cotton Center(U) 2,375 100.00% TULARE: Porterville(C) 30,406 48.33% TULARE: Richgrove(U) 2,367 100.00% TULARE: Rodriguez Camp(U) 133 100.00% TULARE: Strathmore(U) 2,857 100.00% TULARE: Terra Bella(U) 2,932 100.00% TULARE: Teviston(U) 1,188 100.00% TULARE: Tipton(U) 2,530 100.00% TULARE: Tulare(C) 32,662 47.20% TULARE: Waukena(U) 80 100.00% TULARE: Woodville(U) 1,689 100.00% TULARE: Woodville Farm Labor Camp(U) 731 100.00% TULARE: Remainder of Tulare(R) 16,723 27.40%
Senate Office of Demographics 02/2026