This Congressional district was established by the voters of California with the passage of Proposition 50 (2025) on November 4, 2025 and will go into effect after the November 2026 elections and upon seating of the 120th Congress, January 3, 2027. This district will stay in use until the California Citizens Redistricting Commission draws new maps following the 2030 U.S. Census .
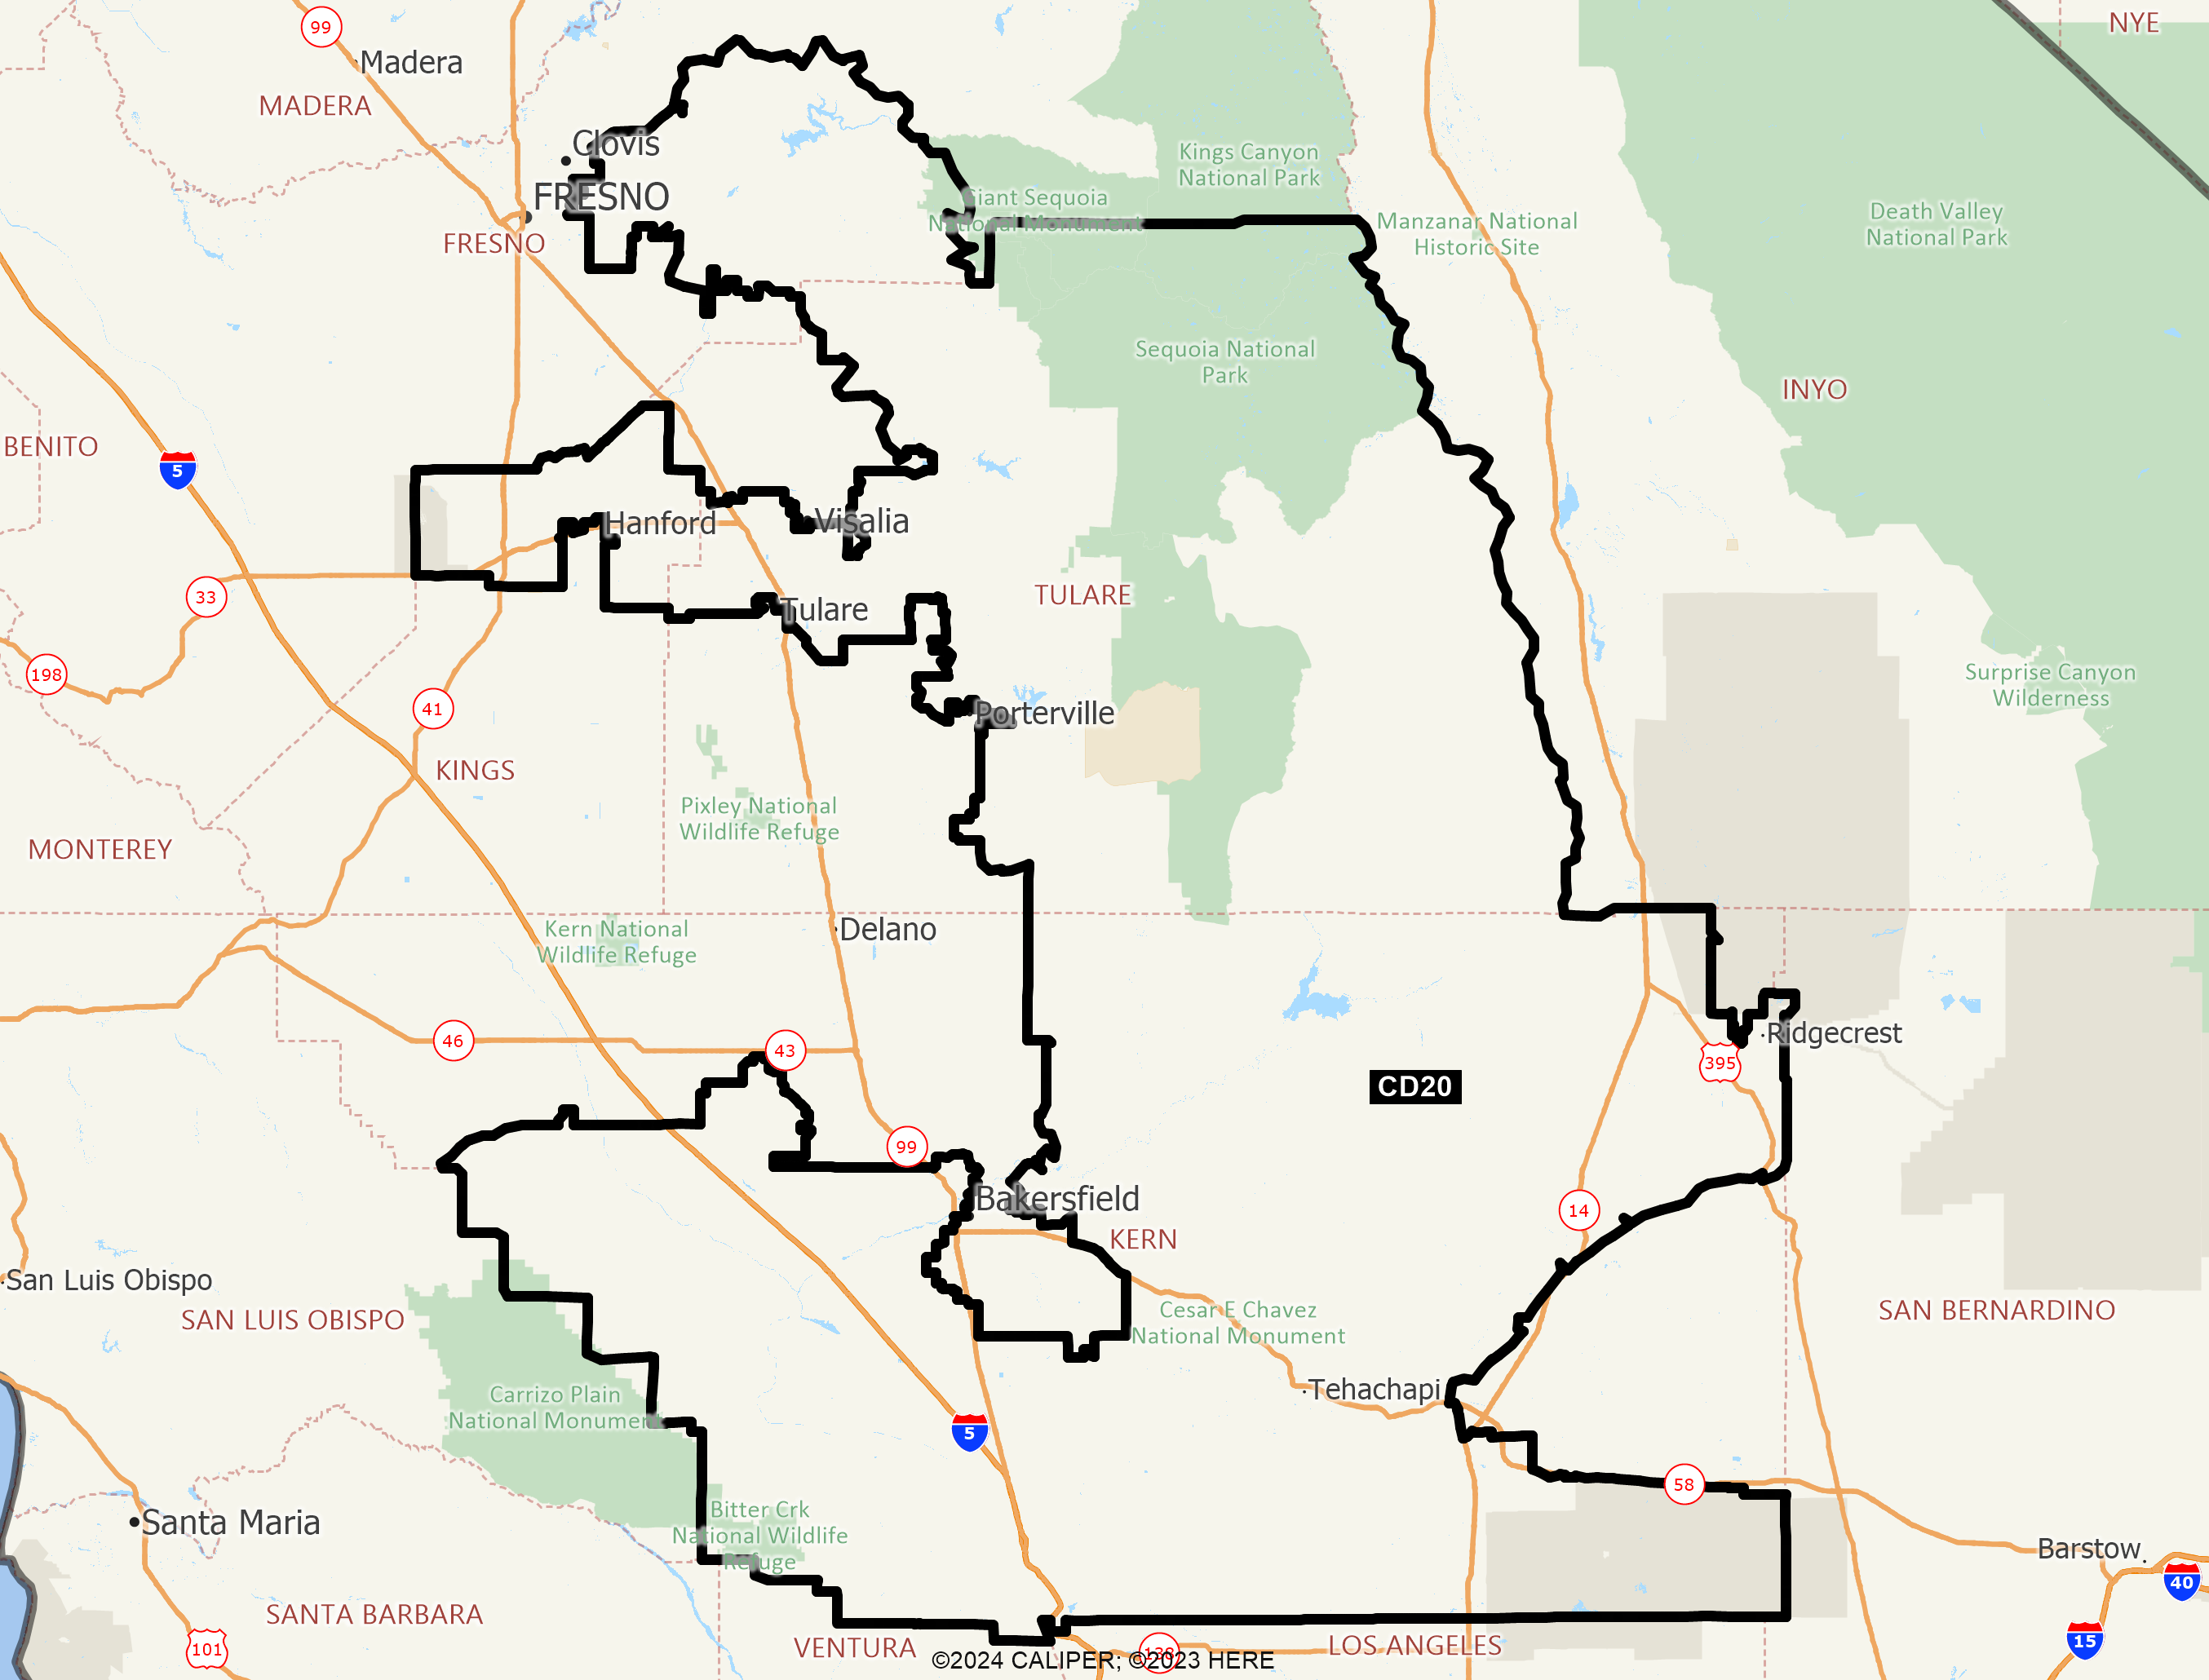
DISTRICT CD20
2020 Census Population (adj Elec. §21003 - SWDB 9/27/2021) Name Count Percent Total Population (POP) 760,065 100.00% POP Hispanic or Latino 288,988 38.02% POP Not Hispanic or Latino (NH) 471,077 61.98% POP NH Population of one race 438,672 57.72% POP NH White alone 358,483 47.16% POP NH Black or African American alone 22,811 3.00% POP NH Asian alone 45,270 5.96% POP NH American Indian and Alaska Native alone 6,424 0.85% POP NH Native Hawaiian and Other Pacific Islander alone 1,236 0.16% POP NH Some Other Race alone 4,448 0.59% POP NH Population of two or more races 32,405 4.26% POP DOJ NH Black or African American 27,120 3.57% POP DOJ NH Asian 51,916 6.83% POP DOJ NH American Indian and Alaska Native 18,070 2.38% POP DOJ NH Native Hawaiian and Other Pacific Islander 1,862 0.24% POP DOJ NH Some Other Race 9,621 1.27% POP DOJ NH Balance of Population of two or more races 4,005 0.53%
2020 Census Voting Age Population (adj Elec. §21003 - SWDB 9/27/2021) Name Count Percent Total Voting Age Population (VAP) 558,997 100.00% VAP Hispanic or Latino 188,535 33.73% VAP Not Hispanic or Latino (NH) 370,462 66.27% VAP NH Population of one race 349,074 62.45% VAP NH White alone 288,143 51.55% VAP NH Black or African American alone 16,931 3.03% VAP NH Asian alone 35,125 6.28% VAP NH American Indian and Alaska Native alone 4,897 0.88% VAP NH Native Hawaiian and Other Pacific Islander alone 936 0.17% VAP NH Some Other Race alone 3,042 0.54% VAP NH Population of two or more races 21,388 3.83% VAP DOJ NH Black or African American 18,952 3.39% VAP DOJ NH Asian 38,688 6.92% VAP DOJ NH American Indian and Alaska Native 13,929 2.49% VAP DOJ NH Native Hawaiian and Other Pacific Islander 1,336 0.24% VAP DOJ NH Some Other Race 6,958 1.24% VAP DOJ NH Balance of Population of two or more races 2,456 0.44%
2020 Census Housing Occupancy Status Name Count Percent Total Housing Units 280,800 100.00% Occupied 259,766 92.51% Vacant 21,034 7.49%
2020 Census Group Quarters Population (adj Elec. §21003 - SWDB 9/27/2021) Name Count Percent Total Group Quarters Population: 7,275 100.00% Institutionalized population: 2,229 30.64% Correctional facilities for adults 884 12.15% Juvenile facilities 139 1.91% Nursing facilities/Skilled-nursing facilities 1,162 15.97% Other institutional facilities 44 0.60% Noninstitutionalized population: 5,046 69.36% College/University student housing 516 7.09% Military quarters 1,425 19.59% Other noninstitutional facilities 3,105 42.68%
2019-2023 ACS Citizen Population (adj Elec. §21003 - SWDB 7/16/2025) Name Count Percent Total Citizen Population (CITZ) 717,830 100.00% CITZ Hispanic or Latino 265,404 36.97% CITZ Not Hispanic or Latino (NH) 452,609 63.05% CITZ NH White alone 357,673 49.83% CITZ NH Black or African American Alone 24,687 3.44% CITZ NH Asian Alone 40,370 5.62% CITZ NH American Indian and Alaska Native Alone 3,386 0.47% CITZ NH Native Hawaiian and Other Pacific Islander alone 1,076 0.15% CITZ NH Black or African American and White 5,669 0.79% CITZ NH American Indian or Alaska Native and White 8,214 1.14% CITZ NH Asian and White 7,670 1.07% CITZ NH American Indian or Alaska Native and Black or African American 246 0.03% CITZ NH Remainder of Two or More Race 3,837 0.53% CITZ DOJ NH Black or African American 30,356 4.23% CITZ DOJ NH Asian 48,584 6.77% CITZ DOJ NH American Indian and Alaska Native 11,056 1.54%
2019-2023 ACS Citizen Voting Age Population (adj Elec. §21003 - SWDB 7/16/2025) Name Count Percent Total Citizen Voting Age Population (CVAP) 512,729 100.00% CVAP Hispanic or Latino 163,165 31.82% CVAP Not Hispanic or Latino (NH) 350,014 68.26% CVAP NH White alone 284,554 55.50% CVAP NH Black or African American Alone 17,595 3.43% CVAP NH Asian Alone 29,660 5.78% CVAP NH American Indian and Alaska Native Alone 2,705 0.53% CVAP NH Native Hawaiian and Other Pacific Islander alone 831 0.16% CVAP NH Black or African American and White 2,845 0.55% CVAP NH Asian and White 4,154 0.81% CVAP NH American Indian or Alaska Native and White 5,542 1.08% CVAP NH American Indian or Alaska Native and Black or African American 216 0.04% CVAP NH Remainder of Two or More Race 2,025 0.39% CVAP DOJ NH Black or African American 20,440 3.99% CVAP DOJ NH Asian 33,814 6.59% CVAP DOJ NH American Indian and Alaska Native 8,247 1.61%
Counties In District Name Count Percent Fresno 57,762 5.73% Kern 400,159 44.83% Kings 87,647 62.46% Tulare 214,499 45.15%
Places In District Name Count Percent FRESNO: Centerville(U) 380 100.00% FRESNO: Clovis(C) 18,764 15.59% FRESNO: Fresno(C) 10,919 2.01% FRESNO: Minkler(U) 870 100.00% FRESNO: Squaw Valley(U) 3,574 100.00% FRESNO: Remainder of Fresno(R) 23,255 20.44% KERN: Alta Sierra(U) 106 100.00% KERN: Bakersfield(C) 178,228 43.99% KERN: Bakersfield Country Club(U) 1,717 100.00% KERN: Bear Valley Springs(U) 5,604 100.00% KERN: Bodfish(U) 2,027 100.00% KERN: Buttonwillow(U) 1,343 100.00% KERN: China Lake Acres(U) 1,764 100.00% KERN: Choctaw Valley(U) 238 100.00% KERN: Derby Acres(U) 301 100.00% KERN: Dustin Acres(U) 679 100.00% KERN: Edwards AFB(U) 2,141 100.00% KERN: Fellows(U) 56 100.00% KERN: Ford City(U) 4,366 100.00% KERN: Frazier Park(U) 2,607 100.00% KERN: Glennville(U) 158 100.00% KERN: Golden Hills(U) 9,602 100.00% KERN: Greenacres(U) 5,515 100.00% KERN: Inyokern(U) 998 100.00% KERN: Keene(U) 470 100.00% KERN: Kernville(U) 1,553 100.00% KERN: Lake Isabella(U) 3,597 100.00% KERN: Lake of the Woods(U) 793 100.00% KERN: Lakeside(U) 845 100.00% KERN: Lebec(U) 1,247 100.00% KERN: McKittrick(U) 103 100.00% KERN: Maricopa(C) 1,031 100.00% KERN: Mettler(U) 90 100.00% KERN: Mojave(U) 4,728 100.00% KERN: Mountain Meadows(U) 304 100.00% KERN: Mountain Mesa(U) 826 100.00% KERN: Oildale(U) 36,374 100.00% KERN: Olde Stockdale(U) 569 100.00% KERN: Old River(U) 124 100.00% KERN: Onyx(U) 459 100.00% KERN: Pine Mountain Club(U) 2,428 100.00% KERN: Ridgecrest(C) 28,057 100.00% KERN: Ridgecrest Heights(U) 381 100.00% KERN: Rosamond(U) 21,027 100.00% KERN: Rosedale(U) 18,672 100.00% KERN: South Taft(U) 2,124 100.00% KERN: Squirrel Mountain Valley(U) 761 100.00% KERN: Stallion Springs(U) 3,146 100.00% KERN: Stebbins(U) 1,425 100.00% KERN: Taft(C) 7,062 100.00% KERN: Taft Heights(U) 2,009 100.00% KERN: Tarina(U) 18 100.00% KERN: Tehachapi(C) 9,337 100.00% KERN: Tupman(U) 177 100.00% KERN: Valley Acres(U) 505 100.00% KERN: Weldon(U) 2,313 100.00% KERN: Wofford Heights(U) 2,231 100.00% KERN: Woody(U) 109 100.00% KERN: Remainder of Kern(R) 27,814 63.27% KINGS: Armona(U) 1,416 32.88% KINGS: Grangeville(U) 511 100.00% KINGS: Hanford(C) 39,596 67.87% KINGS: Hardwick(U) 151 100.00% KINGS: Lemoore(C) 27,190 100.00% KINGS: Lemoore Station(U) 6,580 100.00% KINGS: Remainder of Kings(R) 12,203 76.10% TULARE: California Hot Springs(U) 50 100.00% TULARE: Camp Nelson(U) 107 100.00% TULARE: Cedar Slope(U) 10 100.00% TULARE: East Tulare Villa(U) 774 100.00% TULARE: Exeter(C) 10,385 100.00% TULARE: Goshen(U) 4,999 100.00% TULARE: Hartland(U) 69 100.00% TULARE: Hypericum(U) 125 100.00% TULARE: Idlewild(U) 32 100.00% TULARE: Kennedy Meadows(U) 58 100.00% TULARE: Lemon Cove(U) 300 100.00% TULARE: Lindcove(U) 190 100.00% TULARE: McClenney Tract(U) 15 100.00% TULARE: Panorama Heights(U) 44 100.00% TULARE: Pierpoint(U) 59 100.00% TULARE: Pine Flat(U) 206 100.00% TULARE: Ponderosa(U) 51 100.00% TULARE: Porterville(C) 32,501 51.67% TULARE: Posey(U) 23 100.00% TULARE: Poso Park(U) 9 100.00% TULARE: Sequoia Crest(U) 24 100.00% TULARE: Springville(U) 974 100.00% TULARE: Sugarloaf Saw Mill(U) 14 100.00% TULARE: Sugarloaf Village(U) 7 100.00% TULARE: Three Rivers(U) 2,057 100.00% TULARE: Tonyville(U) 330 100.00% TULARE: Tooleville(U) 292 100.00% TULARE: Tulare(C) 36,538 52.80% TULARE: Visalia(C) 94,383 66.56% TULARE: West Goshen(U) 536 100.00% TULARE: Wilsonia(U) 14 100.00% TULARE: Remainder of Tulare(R) 29,323 48.05%
Senate Office of Demographics 02/2026