This Congressional district was established by the voters of California with the passage of Proposition 50 (2025) on November 4, 2025 and will go into effect after the November 2026 elections and upon seating of the 120th Congress, January 3, 2027. This district will stay in use until the California Citizens Redistricting Commission draws new maps following the 2030 U.S. Census .
DISTRICT CD07
2020 Census Population (adj Elec. §21003 - SWDB 9/27/2021) Name Count Percent Total Population (POP) 760,065 100.00% POP Hispanic or Latino 176,798 23.26% POP Not Hispanic or Latino (NH) 583,267 76.74% POP NH Population of one race 537,064 70.66% POP NH White alone 305,712 40.22% POP NH Black or African American alone 63,370 8.34% POP NH Asian alone 150,498 19.80% POP NH American Indian and Alaska Native alone 3,463 0.46% POP NH Native Hawaiian and Other Pacific Islander alone 9,078 1.19% POP NH Some Other Race alone 4,943 0.65% POP NH Population of two or more races 46,203 6.08% POP DOJ NH Black or African American 70,287 9.25% POP DOJ NH Asian 164,132 21.59% POP DOJ NH American Indian and Alaska Native 11,533 1.52% POP DOJ NH Native Hawaiian and Other Pacific Islander 10,070 1.32% POP DOJ NH Some Other Race 10,204 1.34% POP DOJ NH Balance of Population of two or more races 11,329 1.49%
2020 Census Voting Age Population (adj Elec. §21003 - SWDB 9/27/2021) Name Count Percent Total Voting Age Population (VAP) 588,195 100.00% VAP Hispanic or Latino 121,681 20.69% VAP Not Hispanic or Latino (NH) 466,514 79.31% VAP NH Population of one race 436,720 74.25% VAP NH White alone 258,015 43.87% VAP NH Black or African American alone 48,977 8.33% VAP NH Asian alone 116,382 19.79% VAP NH American Indian and Alaska Native alone 2,727 0.46% VAP NH Native Hawaiian and Other Pacific Islander alone 7,007 1.19% VAP NH Some Other Race alone 3,612 0.61% VAP NH Population of two or more races 29,794 5.07% VAP DOJ NH Black or African American 52,864 8.99% VAP DOJ NH Asian 123,894 21.06% VAP DOJ NH American Indian and Alaska Native 9,131 1.55% VAP DOJ NH Native Hawaiian and Other Pacific Islander 7,648 1.30% VAP DOJ NH Some Other Race 7,685 1.31% VAP DOJ NH Balance of Population of two or more races 7,277 1.24%
2020 Census Housing Occupancy Status Name Count Percent Total Housing Units 279,127 100.00% Occupied 266,724 95.56% Vacant 12,403 4.44%
2020 Census Group Quarters Population (adj Elec. §21003 - SWDB 9/27/2021) Name Count Percent Total Group Quarters Population: 17,502 100.00% Institutionalized population: 5,006 28.60% Correctional facilities for adults 2,939 16.79% Juvenile facilities 128 0.73% Nursing facilities/Skilled-nursing facilities 1,746 9.98% Other institutional facilities 193 1.10% Noninstitutionalized population: 12,496 71.40% College/University student housing 3,759 21.48% Military quarters 0 0.00% Other noninstitutional facilities 8,737 49.92%
2019-2023 ACS Citizen Population (adj Elec. §21003 - SWDB 7/16/2025) Name Count Percent Total Citizen Population (CITZ) 712,570 100.00% CITZ Hispanic or Latino 157,753 22.14% CITZ Not Hispanic or Latino (NH) 554,823 77.86% CITZ NH White alone 313,612 44.01% CITZ NH Black or African American Alone 61,291 8.60% CITZ NH Asian Alone 128,684 18.06% CITZ NH American Indian and Alaska Native Alone 1,957 0.27% CITZ NH Native Hawaiian and Other Pacific Islander alone 9,250 1.30% CITZ NH Black or African American and White 11,800 1.66% CITZ NH American Indian or Alaska Native and White 13,497 1.89% CITZ NH Asian and White 5,249 0.74% CITZ NH American Indian or Alaska Native and Black or African American 1,190 0.17% CITZ NH Remainder of Two or More Race 8,205 1.15% CITZ DOJ NH Black or African American 73,091 10.26% CITZ DOJ NH Asian 142,181 19.95% CITZ DOJ NH American Indian and Alaska Native 7,206 1.01%
2019-2023 ACS Citizen Voting Age Population (adj Elec. §21003 - SWDB 7/16/2025) Name Count Percent Total Citizen Voting Age Population (CVAP) 548,294 100.00% CVAP Hispanic or Latino 103,298 18.84% CVAP Not Hispanic or Latino (NH) 444,996 81.16% CVAP NH White alone 264,224 48.19% CVAP NH Black or African American Alone 48,505 8.85% CVAP NH Asian Alone 99,343 18.12% CVAP NH American Indian and Alaska Native Alone 1,499 0.27% CVAP NH Native Hawaiian and Other Pacific Islander alone 7,351 1.34% CVAP NH Black or African American and White 6,460 1.18% CVAP NH Asian and White 7,169 1.31% CVAP NH American Indian or Alaska Native and White 4,106 0.75% CVAP NH American Indian or Alaska Native and Black or African American 1,190 0.22% CVAP NH Remainder of Two or More Race 5,082 0.93% CVAP DOJ NH Black or African American 54,965 10.02% CVAP DOJ NH Asian 106,512 19.43% CVAP DOJ NH American Indian and Alaska Native 5,605 1.02%
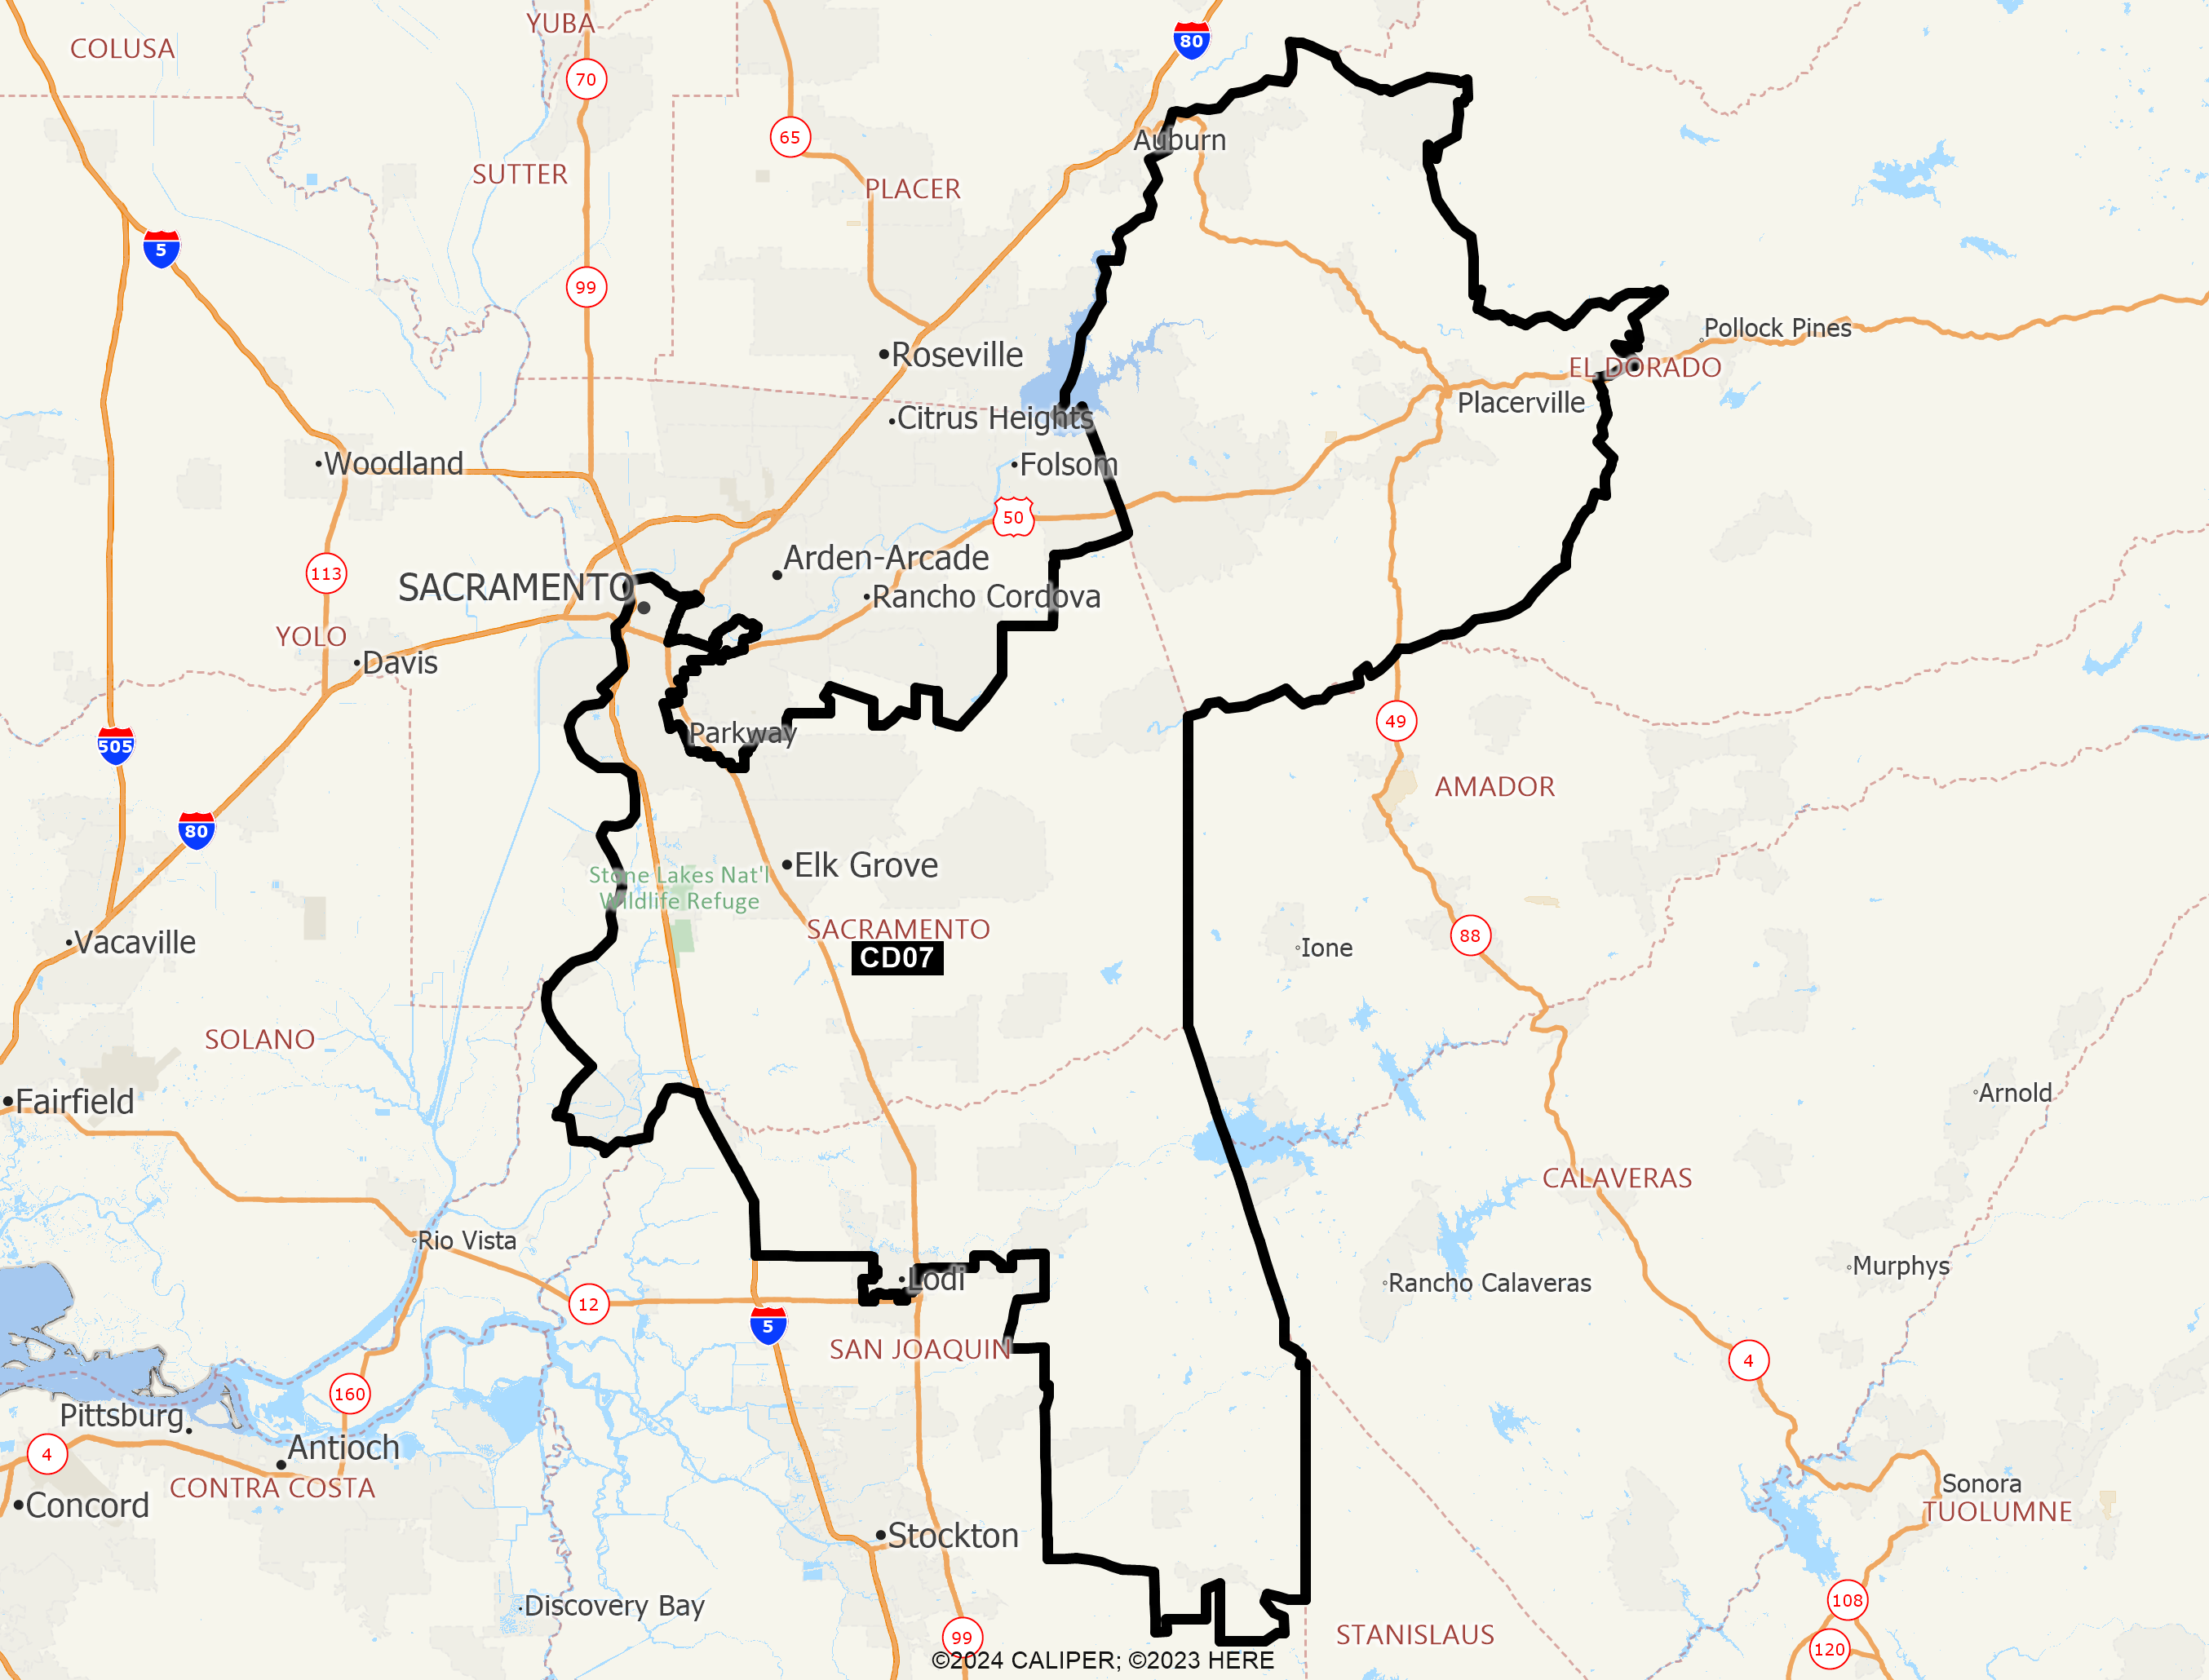
Counties In District Name Count Percent El Dorado 141,675 74.00% Sacramento 559,271 35.29% San Joaquin 59,121 7.61%
Places In District Name Count Percent EL DORADO: Auburn Lake Trails(U) 3,391 100.00% EL DORADO: Cameron Park(U) 18,919 100.00% EL DORADO: Camino(U) 1,874 100.00% EL DORADO: Cold Springs(U) 557 100.00% EL DORADO: Coloma(U) 523 100.00% EL DORADO: Diamond Springs(U) 11,369 100.00% EL DORADO: El Dorado Hills(U) 50,603 100.00% EL DORADO: Georgetown(U) 2,159 100.00% EL DORADO: Placerville(C) 10,783 100.00% EL DORADO: Shingle Springs(U) 4,666 100.00% EL DORADO: Remainder of El Dorado(R) 36,831 68.02% SACRAMENTO: Clay(U) 1,254 100.00% SACRAMENTO: Courtland(U) 328 100.00% SACRAMENTO: Elk Grove(C) 176,562 100.00% SACRAMENTO: Florin(U) 26,519 50.36% SACRAMENTO: Franklin(U) 169 100.00% SACRAMENTO: Freeport(U) 58 100.00% SACRAMENTO: Galt(C) 25,474 100.00% SACRAMENTO: Herald(U) 1,163 100.00% SACRAMENTO: Hood(U) 245 100.00% SACRAMENTO: Rancho Murieta(U) 5,918 100.00% SACRAMENTO: Sacramento(C) 259,127 49.21% SACRAMENTO: Vineyard(U) 44,072 100.00% SACRAMENTO: Walnut Grove(U) 1,455 100.00% SACRAMENTO: Wilton(U) 5,969 100.00% SACRAMENTO: Remainder of Sacramento(R) 10,958 72.81% SAN JOAQUIN: Acampo(U) 345 100.00% SAN JOAQUIN: Collierville(U) 2,096 100.00% SAN JOAQUIN: Dogtown(U) 2,520 100.00% SAN JOAQUIN: Farmington(U) 221 100.00% SAN JOAQUIN: Linden(U) 1,865 100.00% SAN JOAQUIN: Lockeford(U) 2,840 85.03% SAN JOAQUIN: Lodi(C) 32,999 49.57% SAN JOAQUIN: Peters(U) 708 100.00% SAN JOAQUIN: Thornton(U) 1,008 100.00% SAN JOAQUIN: Woodbridge(U) 4,036 100.00% SAN JOAQUIN: Remainder of San Joaquin(R) 10,483 15.17%
Senate Office of Demographics 02/2026