This Congressional district was established by the voters of California with the passage of Proposition 50 (2025) on November 4, 2025 and will go into effect after the November 2026 elections and upon seating of the 120th Congress, January 3, 2027. This district will stay in use until the California Citizens Redistricting Commission draws new maps following the 2030 U.S. Census .
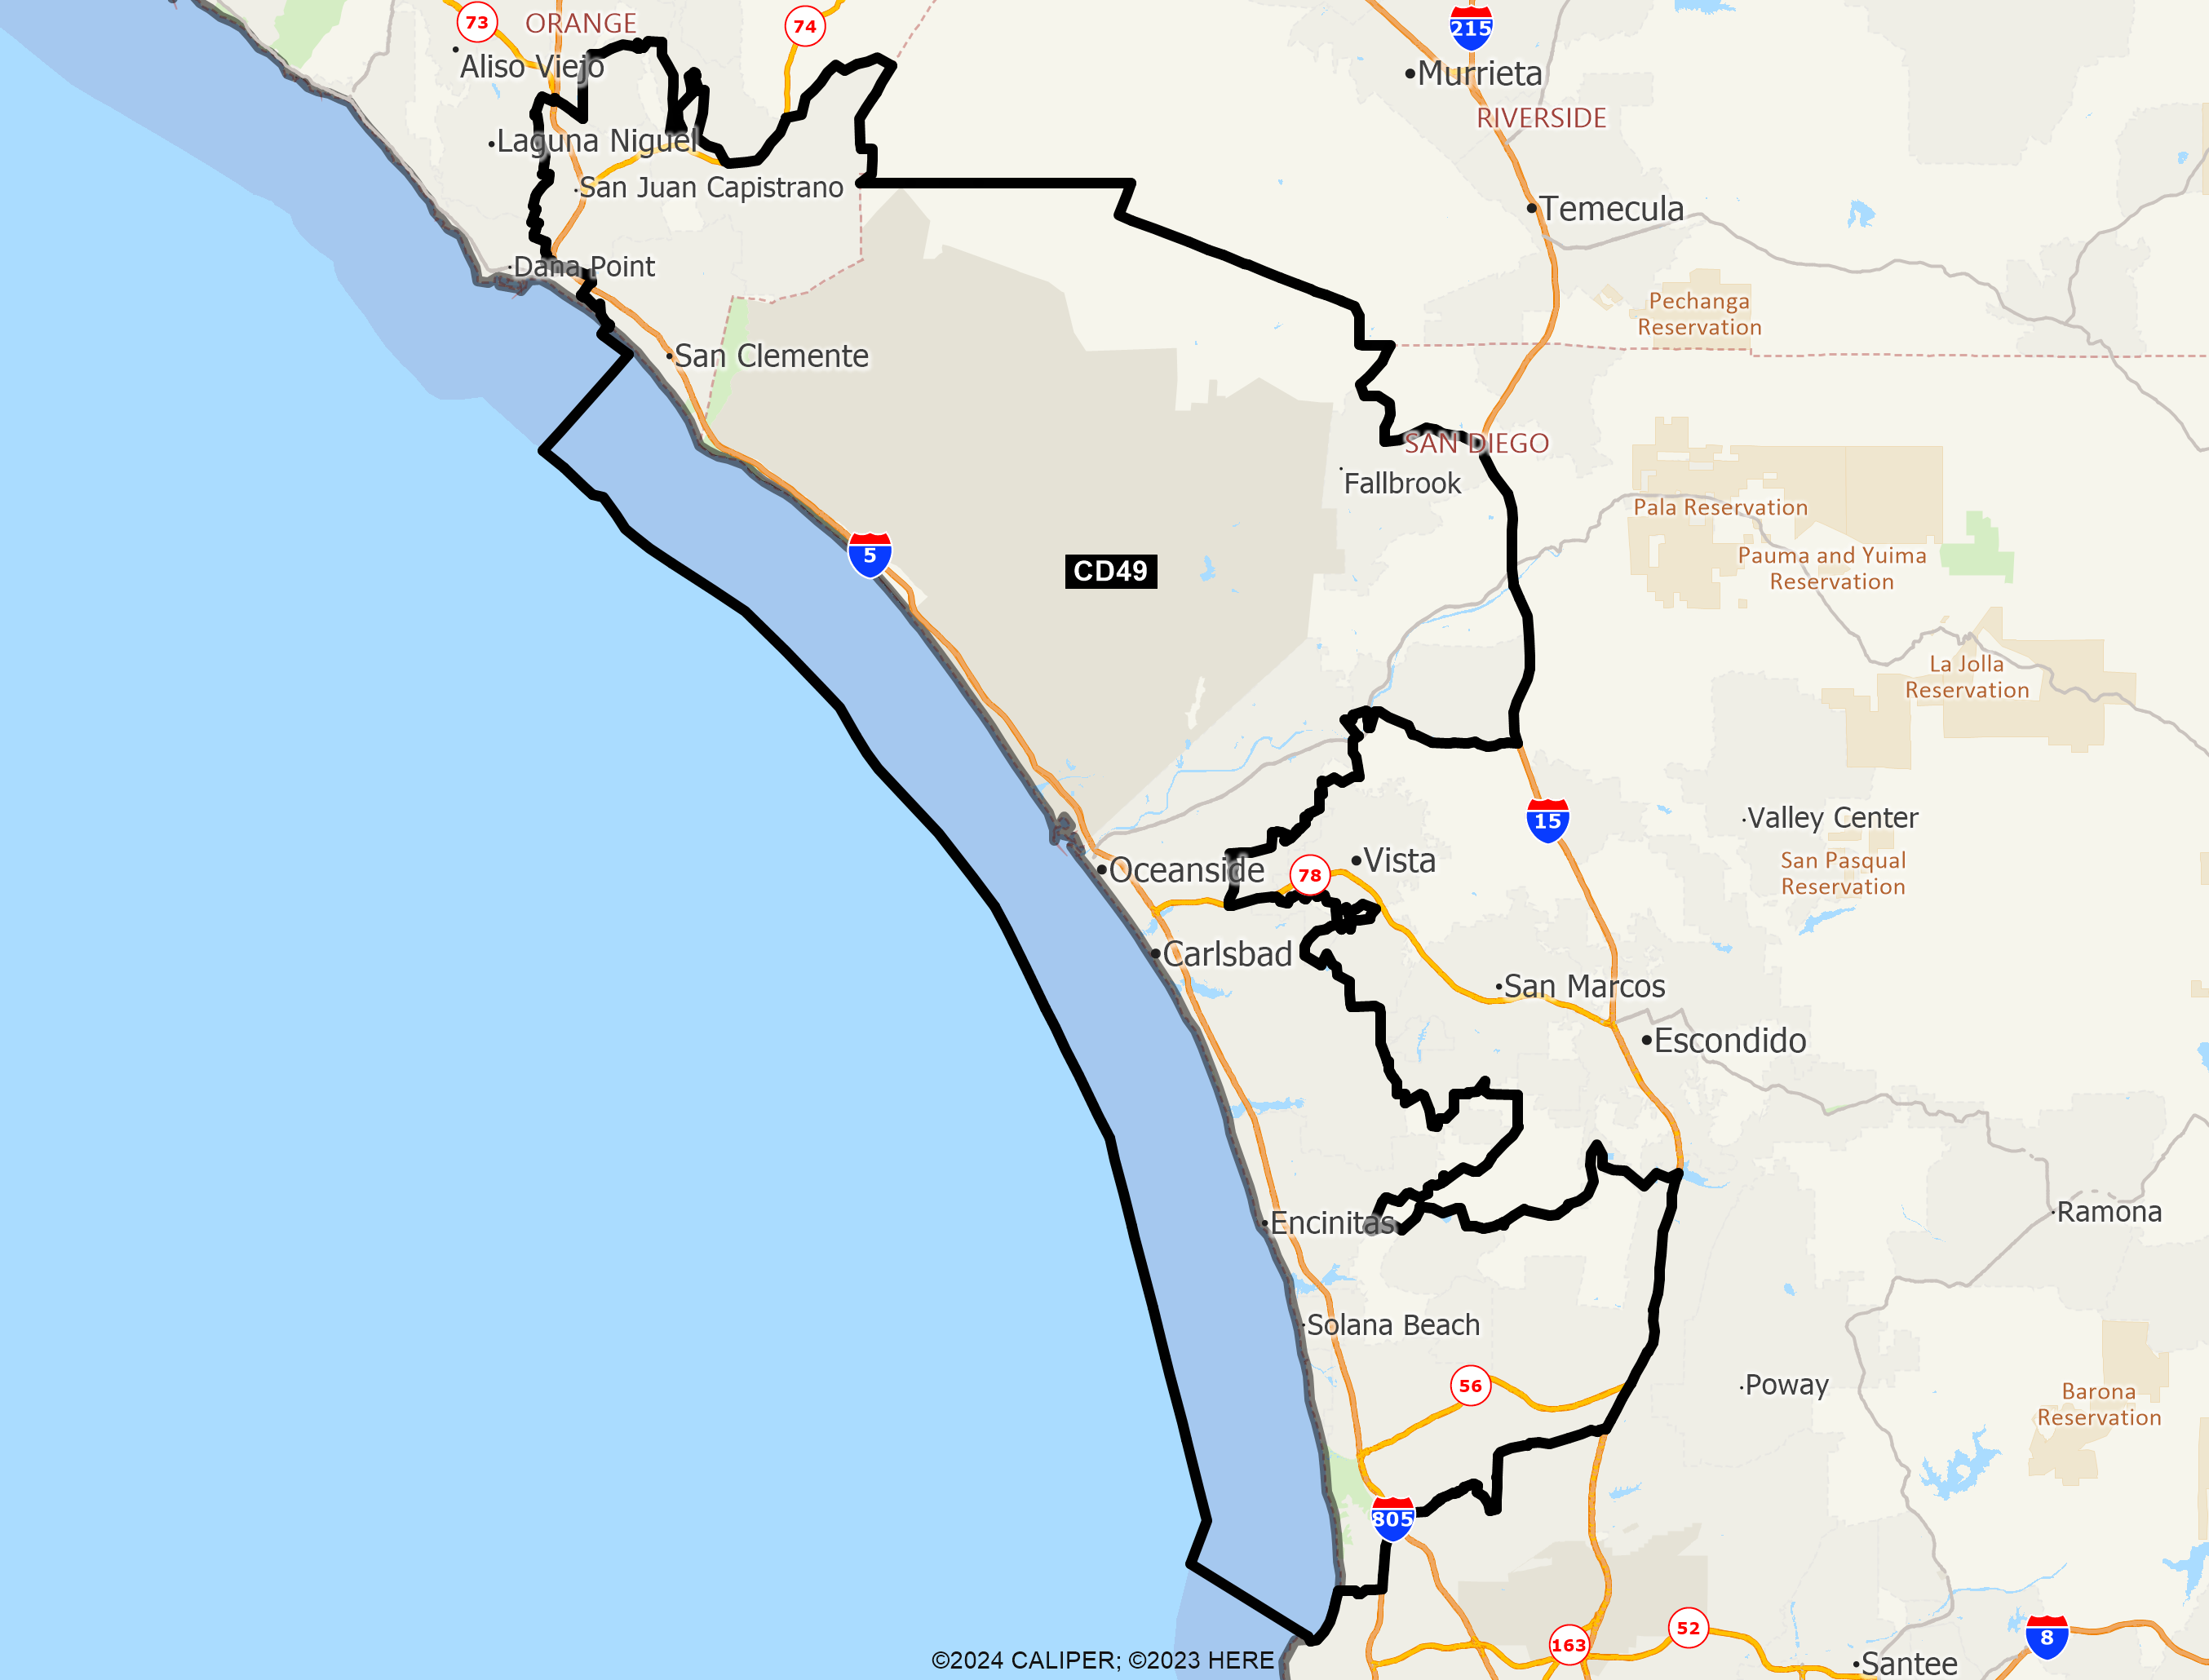
DISTRICT CD49
2020 Census Population (adj Elec. §21003 - SWDB 9/27/2021) Name Count Percent Total Population (POP) 760,067 100.00% POP Hispanic or Latino 164,145 21.60% POP Not Hispanic or Latino (NH) 595,922 78.40% POP NH Population of one race 553,851 72.87% POP NH White alone 434,796 57.20% POP NH Black or African American alone 15,398 2.03% POP NH Asian alone 94,807 12.47% POP NH American Indian and Alaska Native alone 1,889 0.25% POP NH Native Hawaiian and Other Pacific Islander alone 2,830 0.37% POP NH Some Other Race alone 4,131 0.54% POP NH Population of two or more races 42,071 5.54% POP DOJ NH Black or African American 20,001 2.63% POP DOJ NH Asian 113,045 14.87% POP DOJ NH American Indian and Alaska Native 7,457 0.98% POP DOJ NH Native Hawaiian and Other Pacific Islander 4,053 0.53% POP DOJ NH Some Other Race 10,904 1.43% POP DOJ NH Balance of Population of two or more races 5,666 0.75%
2020 Census Voting Age Population (adj Elec. §21003 - SWDB 9/27/2021) Name Count Percent Total Voting Age Population (VAP) 592,989 100.00% VAP Hispanic or Latino 116,812 19.70% VAP Not Hispanic or Latino (NH) 476,177 80.30% VAP NH Population of one race 450,854 76.03% VAP NH White alone 357,023 60.21% VAP NH Black or African American alone 12,768 2.15% VAP NH Asian alone 74,122 12.50% VAP NH American Indian and Alaska Native alone 1,622 0.27% VAP NH Native Hawaiian and Other Pacific Islander alone 2,253 0.38% VAP NH Some Other Race alone 3,066 0.52% VAP NH Population of two or more races 25,323 4.27% VAP DOJ NH Black or African American 15,510 2.62% VAP DOJ NH Asian 83,144 14.02% VAP DOJ NH American Indian and Alaska Native 5,929 1.00% VAP DOJ NH Native Hawaiian and Other Pacific Islander 2,998 0.51% VAP DOJ NH Some Other Race 7,908 1.33% VAP DOJ NH Balance of Population of two or more races 3,665 0.62%
2020 Census Housing Occupancy Status Name Count Percent Total Housing Units 283,658 100.00% Occupied 264,541 93.26% Vacant 19,117 6.74%
2020 Census Group Quarters Population (adj Elec. §21003 - SWDB 9/27/2021) Name Count Percent Total Group Quarters Population: 33,966 100.00% Institutionalized population: 2,394 7.05% Correctional facilities for adults 0 0.00% Juvenile facilities 9 0.03% Nursing facilities/Skilled-nursing facilities 2,058 6.06% Other institutional facilities 327 0.96% Noninstitutionalized population: 31,572 92.95% College/University student housing 9,912 29.18% Military quarters 18,644 54.89% Other noninstitutional facilities 3,016 8.88%
2019-2023 ACS Citizen Population (adj Elec. §21003 - SWDB 7/16/2025) Name Count Percent Total Citizen Population (CITZ) 694,290 100.00% CITZ Hispanic or Latino 147,502 21.25% CITZ Not Hispanic or Latino (NH) 546,466 78.71% CITZ NH White alone 414,610 59.72% CITZ NH Black or African American Alone 15,970 2.30% CITZ NH Asian Alone 76,813 11.06% CITZ NH American Indian and Alaska Native Alone 1,374 0.20% CITZ NH Native Hawaiian and Other Pacific Islander alone 1,200 0.17% CITZ NH Black or African American and White 5,775 0.83% CITZ NH American Indian or Alaska Native and White 21,311 3.07% CITZ NH Asian and White 3,917 0.56% CITZ NH American Indian or Alaska Native and Black or African American 153 0.02% CITZ NH Remainder of Two or More Race 5,267 0.76% CITZ DOJ NH Black or African American 21,745 3.13% CITZ DOJ NH Asian 98,124 14.13% CITZ DOJ NH American Indian and Alaska Native 5,291 0.76%
2019-2023 ACS Citizen Voting Age Population (adj Elec. §21003 - SWDB 7/16/2025) Name Count Percent Total Citizen Voting Age Population (CVAP) 525,988 100.00% CVAP Hispanic or Latino 96,790 18.40% CVAP Not Hispanic or Latino (NH) 428,951 81.55% CVAP NH White alone 336,391 63.95% CVAP NH Black or African American Alone 13,080 2.49% CVAP NH Asian Alone 58,576 11.14% CVAP NH American Indian and Alaska Native Alone 1,080 0.21% CVAP NH Native Hawaiian and Other Pacific Islander alone 1,063 0.20% CVAP NH Black or African American and White 3,228 0.61% CVAP NH Asian and White 9,299 1.77% CVAP NH American Indian or Alaska Native and White 3,137 0.60% CVAP NH American Indian or Alaska Native and Black or African American 153 0.03% CVAP NH Remainder of Two or More Race 2,925 0.56% CVAP DOJ NH Black or African American 16,308 3.10% CVAP DOJ NH Asian 67,875 12.90% CVAP DOJ NH American Indian and Alaska Native 4,217 0.80%
Counties In District Name Count Percent Orange 132,041 4.14% San Diego 628,026 19.02%
Places In District Name Count Percent ORANGE: Ladera Ranch(U) 22,526 86.02% ORANGE: Rancho Mission Viejo(U) 9,762 94.00% ORANGE: San Clemente(C) 64,384 100.00% ORANGE: San Juan Capistrano(C) 35,271 100.00% ORANGE: Remainder of Orange(R) 98 0.35% SAN DIEGO: Bonsall(U) 4,553 100.00% SAN DIEGO: Camp Pendleton Mainside(U) 9,697 100.00% SAN DIEGO: Camp Pendleton South(U) 12,482 100.00% SAN DIEGO: Carlsbad(C) 114,953 100.00% SAN DIEGO: Del Mar(C) 3,966 100.00% SAN DIEGO: Elfin Forest(U) 600 100.00% SAN DIEGO: Encinitas(C) 62,107 100.00% SAN DIEGO: Fairbanks Ranch(U) 3,010 100.00% SAN DIEGO: Fallbrook(U) 32,374 100.00% SAN DIEGO: Oceanside(C) 149,642 85.72% SAN DIEGO: Rancho Santa Fe(U) 3,162 100.00% SAN DIEGO: San Diego(C) 164,756 11.85% SAN DIEGO: Solana Beach(C) 12,954 100.00% SAN DIEGO: Remainder of San Diego(R) 53,770 33.42%
Senate Office of Demographics 02/2026