This Congressional district was established by the voters of California with the passage of Proposition 50 (2025) on November 4, 2025 and will go into effect after the November 2026 elections and upon seating of the 120th Congress, January 3, 2027. This district will stay in use until the California Citizens Redistricting Commission draws new maps following the 2030 U.S. Census .
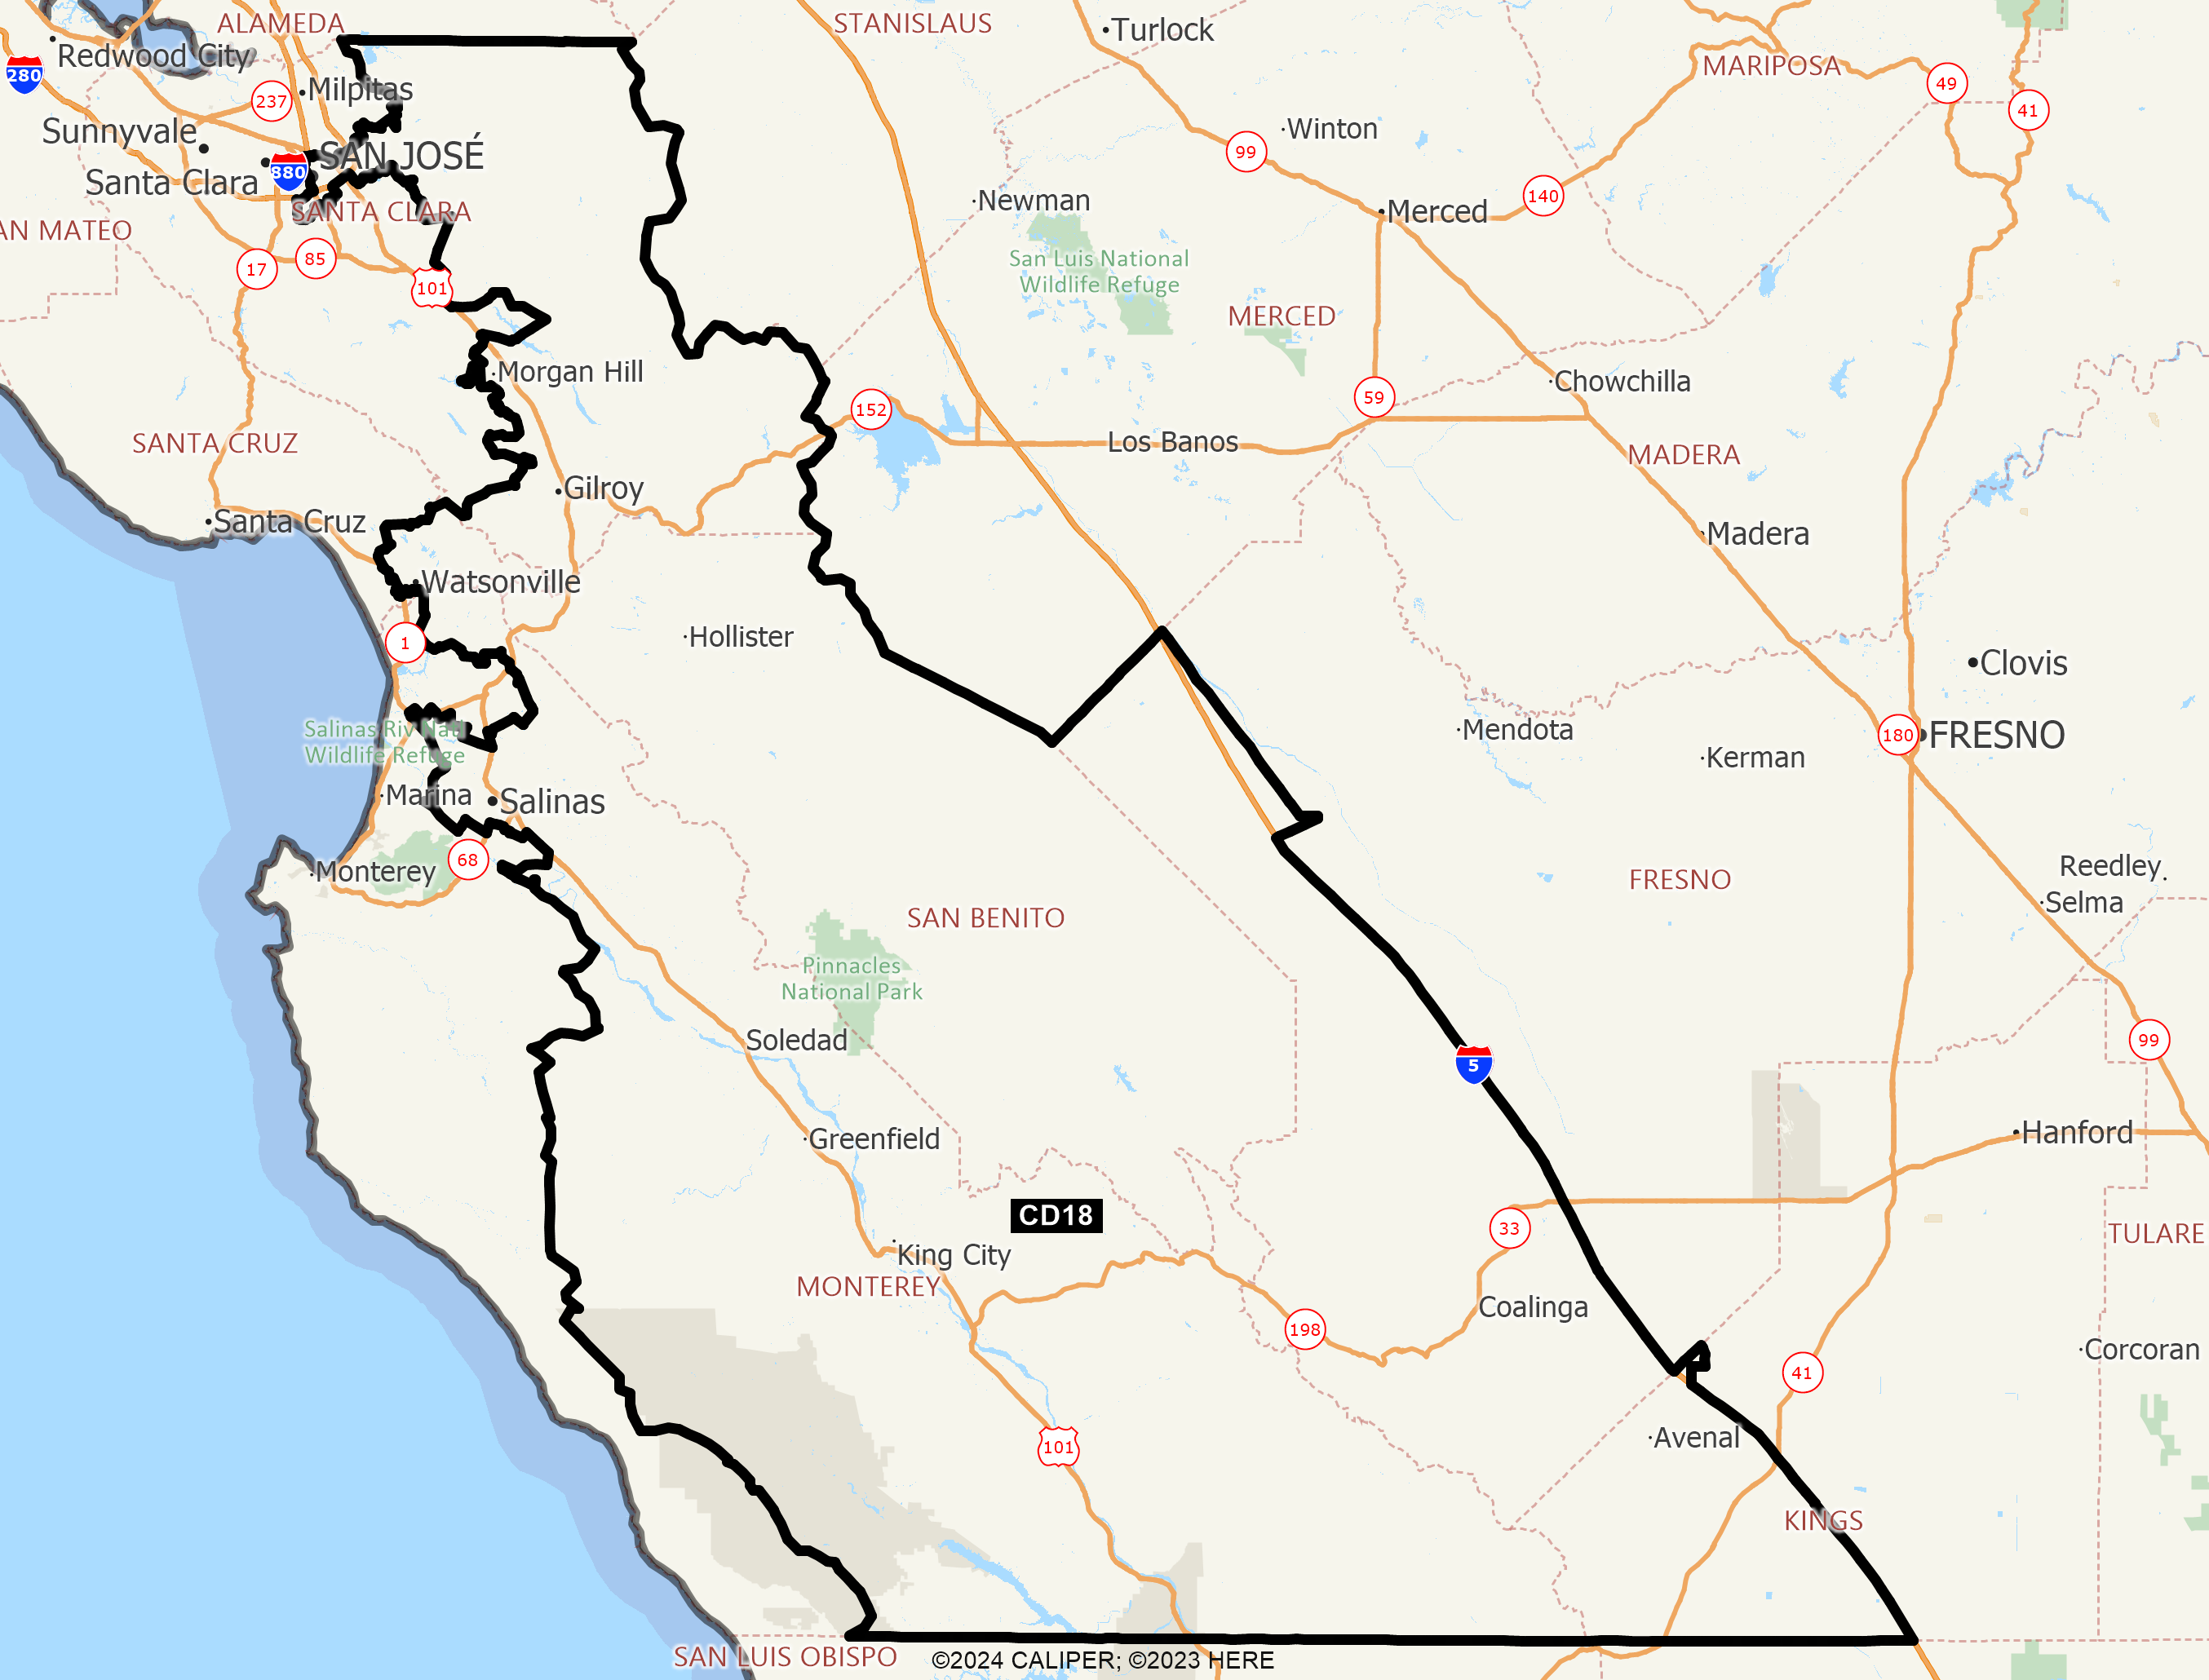
DISTRICT CD18
2020 Census Population (adj Elec. §21003 - SWDB 9/27/2021) Name Count Percent Total Population (POP) 760,066 100.00% POP Hispanic or Latino 500,484 65.85% POP Not Hispanic or Latino (NH) 259,582 34.15% POP NH Population of one race 240,593 31.65% POP NH White alone 143,922 18.94% POP NH Black or African American alone 11,751 1.55% POP NH Asian alone 77,477 10.19% POP NH American Indian and Alaska Native alone 2,072 0.27% POP NH Native Hawaiian and Other Pacific Islander alone 1,767 0.23% POP NH Some Other Race alone 3,604 0.47% POP NH Population of two or more races 18,989 2.50% POP DOJ NH Black or African American 13,808 1.82% POP DOJ NH Asian 84,291 11.09% POP DOJ NH American Indian and Alaska Native 5,164 0.68% POP DOJ NH Native Hawaiian and Other Pacific Islander 2,289 0.30% POP DOJ NH Some Other Race 6,279 0.83% POP DOJ NH Balance of Population of two or more races 3,829 0.50%
2020 Census Voting Age Population (adj Elec. §21003 - SWDB 9/27/2021) Name Count Percent Total Voting Age Population (VAP) 564,162 100.00% VAP Hispanic or Latino 346,060 61.34% VAP Not Hispanic or Latino (NH) 218,102 38.66% VAP NH Population of one race 205,070 36.35% VAP NH White alone 123,721 21.93% VAP NH Black or African American alone 9,938 1.76% VAP NH Asian alone 65,697 11.65% VAP NH American Indian and Alaska Native alone 1,697 0.30% VAP NH Native Hawaiian and Other Pacific Islander alone 1,430 0.25% VAP NH Some Other Race alone 2,587 0.46% VAP NH Population of two or more races 13,032 2.31% VAP DOJ NH Black or African American 11,222 1.99% VAP DOJ NH Asian 69,765 12.37% VAP DOJ NH American Indian and Alaska Native 4,304 0.76% VAP DOJ NH Native Hawaiian and Other Pacific Islander 1,827 0.32% VAP DOJ NH Some Other Race 4,635 0.82% VAP DOJ NH Balance of Population of two or more races 2,628 0.47%
2020 Census Housing Occupancy Status Name Count Percent Total Housing Units 224,734 100.00% Occupied 215,435 95.86% Vacant 9,299 4.14%
2020 Census Group Quarters Population (adj Elec. §21003 - SWDB 9/27/2021) Name Count Percent Total Group Quarters Population: 15,045 100.00% Institutionalized population: 4,641 30.85% Correctional facilities for adults 1,419 9.43% Juvenile facilities 224 1.49% Nursing facilities/Skilled-nursing facilities 1,571 10.44% Other institutional facilities 1,427 9.48% Noninstitutionalized population: 10,404 69.15% College/University student housing 3,791 25.20% Military quarters 31 0.21% Other noninstitutional facilities 6,582 43.75%
2019-2023 ACS Citizen Population (adj Elec. §21003 - SWDB 7/16/2025) Name Count Percent Total Citizen Population (CITZ) 600,423 100.00% CITZ Hispanic or Latino 367,820 61.26% CITZ Not Hispanic or Latino (NH) 232,530 38.73% CITZ NH White alone 139,355 23.21% CITZ NH Black or African American Alone 12,056 2.01% CITZ NH Asian Alone 63,320 10.55% CITZ NH American Indian and Alaska Native Alone 1,102 0.18% CITZ NH Native Hawaiian and Other Pacific Islander alone 1,165 0.19% CITZ NH Black or African American and White 2,440 0.41% CITZ NH American Indian or Alaska Native and White 7,233 1.20% CITZ NH Asian and White 2,512 0.42% CITZ NH American Indian or Alaska Native and Black or African American 236 0.04% CITZ NH Remainder of Two or More Race 3,073 0.51% CITZ DOJ NH Black or African American 14,496 2.41% CITZ DOJ NH Asian 70,553 11.75% CITZ DOJ NH American Indian and Alaska Native 3,614 0.60%
2019-2023 ACS Citizen Voting Age Population (adj Elec. §21003 - SWDB 7/16/2025) Name Count Percent Total Citizen Voting Age Population (CVAP) 412,566 100.00% CVAP Hispanic or Latino 218,496 52.96% CVAP Not Hispanic or Latino (NH) 193,996 47.02% CVAP NH White alone 120,366 29.17% CVAP NH Black or African American Alone 10,076 2.44% CVAP NH Asian Alone 51,862 12.57% CVAP NH American Indian and Alaska Native Alone 1,036 0.25% CVAP NH Native Hawaiian and Other Pacific Islander alone 952 0.23% CVAP NH Black or African American and White 1,362 0.33% CVAP NH Asian and White 4,077 0.99% CVAP NH American Indian or Alaska Native and White 2,130 0.52% CVAP NH American Indian or Alaska Native and Black or African American 136 0.03% CVAP NH Remainder of Two or More Race 2,034 0.49% CVAP DOJ NH Black or African American 11,438 2.77% CVAP DOJ NH Asian 55,939 13.56% CVAP DOJ NH American Indian and Alaska Native 3,166 0.77%
Counties In District Name Count Percent Fresno 15,217 1.51% Kings 9,538 6.80% Monterey 265,577 61.10% San Benito 64,337 100.00% Santa Clara 337,903 17.42% Santa Cruz 67,492 24.87%
Places In District Name Count Percent FRESNO: Coalinga(C) 14,479 100.00% FRESNO: Remainder of Fresno(R) 738 0.65% KINGS: Avenal(C) 9,496 100.00% KINGS: Remainder of Kings(R) 42 0.26% MONTEREY: Aromas(U) 1,367 100.00% MONTEREY: Boronda(U) 1,767 100.00% MONTEREY: Bradley(U) 69 100.00% MONTEREY: Castroville(U) 7,563 100.00% MONTEREY: Chualar(U) 1,190 100.00% MONTEREY: Fort Hunter Liggett(U) 251 100.00% MONTEREY: Gonzales(C) 8,674 100.00% MONTEREY: Greenfield(C) 19,010 100.00% MONTEREY: King City(C) 13,395 100.00% MONTEREY: Las Lomas(U) 3,054 100.00% MONTEREY: Lockwood(U) 368 100.00% MONTEREY: Pajaro(U) 2,888 100.00% MONTEREY: Pine Canyon(U) 1,874 100.00% MONTEREY: Prunedale(U) 3,493 18.44% MONTEREY: Salinas(C) 164,231 100.00% MONTEREY: San Ardo(U) 394 100.00% MONTEREY: San Lucas(U) 329 100.00% MONTEREY: Soledad(C) 19,093 100.00% MONTEREY: Remainder of Monterey(R) 16,567 31.00% SAN BENITO: Aromas(U) 1,348 100.00% SAN BENITO: Hollister(C) 41,770 100.00% SAN BENITO: Ridgemark(U) 3,217 100.00% SAN BENITO: San Juan Bautista(C) 2,092 100.00% SAN BENITO: Tres Pinos(U) 444 100.00% SAN BENITO: Remainder of San Benito(R) 15,466 100.00% SANTA CLARA: Alum Rock(U) 12,082 100.00% SANTA CLARA: East Foothills(U) 6,820 100.00% SANTA CLARA: Gilroy(C) 59,692 100.00% SANTA CLARA: Morgan Hill(C) 45,566 100.00% SANTA CLARA: San Jose(C) 195,041 19.20% SANTA CLARA: San Martin(U) 7,017 100.00% SANTA CLARA: Remainder of Santa Clara(R) 11,685 41.37% SANTA CRUZ: Amesti(U) 2,646 100.00% SANTA CRUZ: Freedom(U) 3,847 100.00% SANTA CRUZ: Interlaken(U) 7,393 100.00% SANTA CRUZ: Watsonville(C) 52,761 100.00% SANTA CRUZ: Remainder of Santa Cruz(R) 845 3.30%
Senate Office of Demographics 02/2026