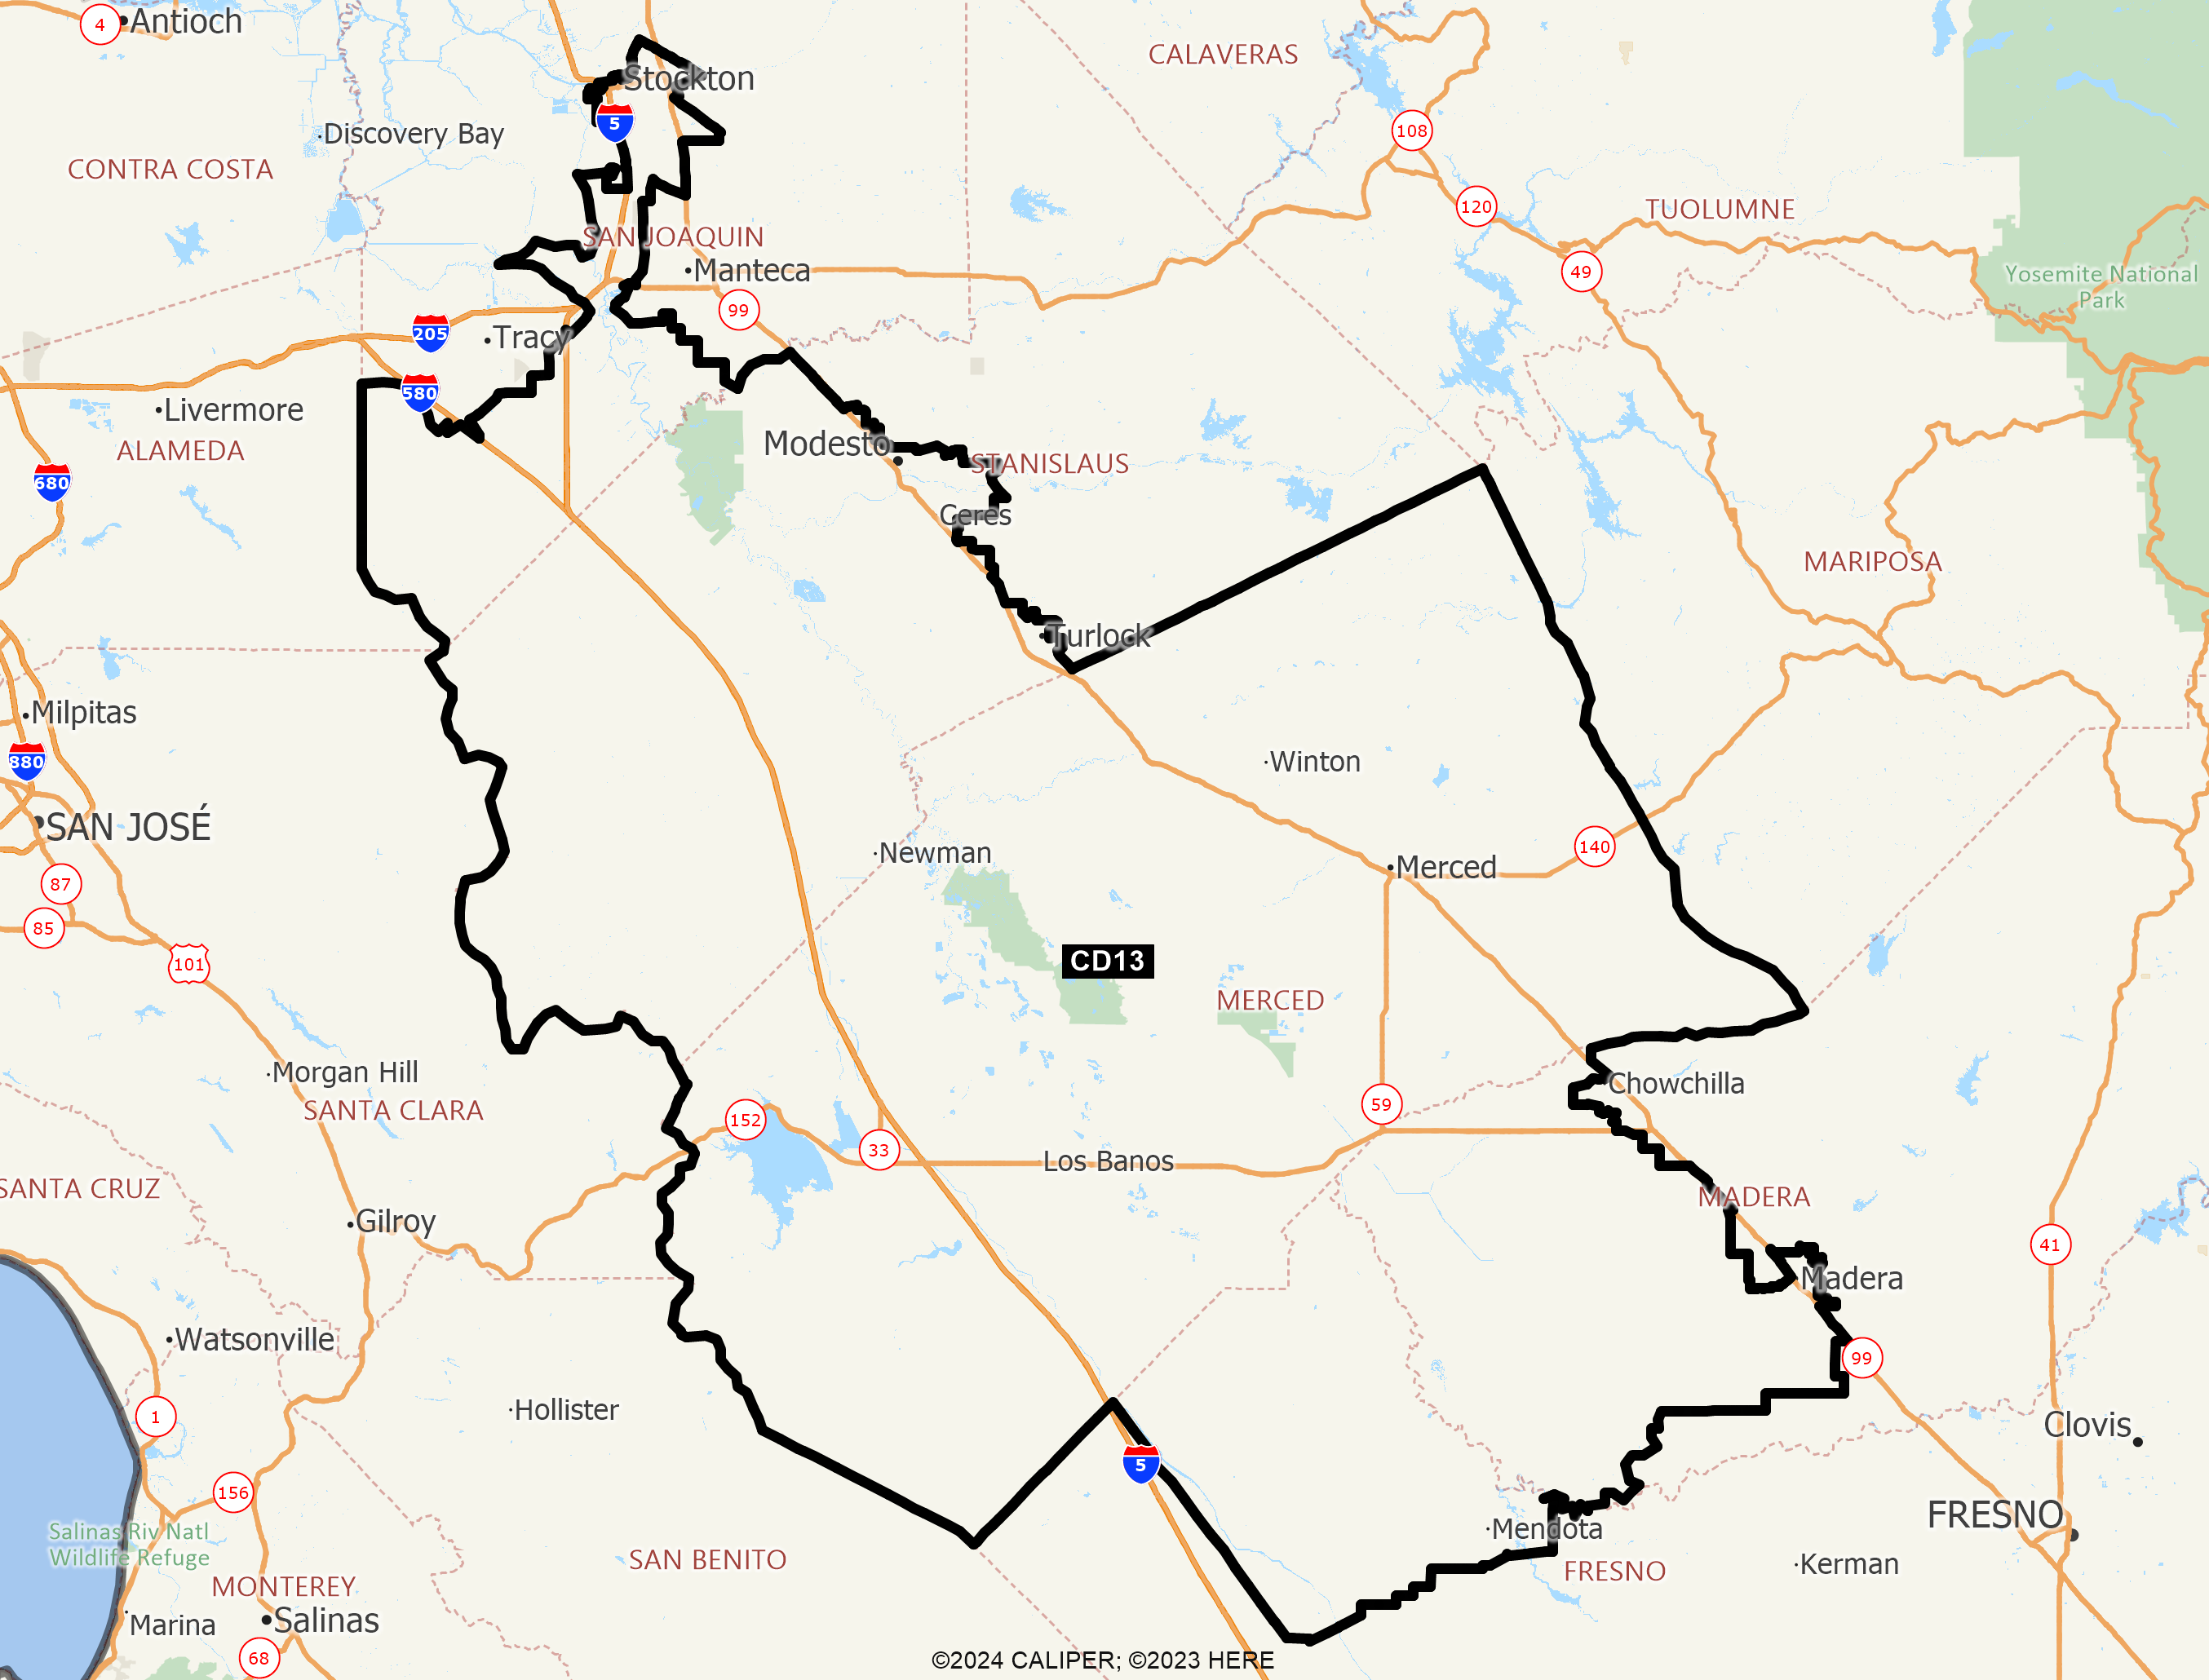
This Congressional district was established by the voters of California with the passage of Proposition 50 (2025) on November 4, 2025 and will go into effect after the November 2026 elections and upon seating of the 120th Congress, January 3, 2027. This district will stay in use until the California Citizens Redistricting Commission draws new maps following the 2030 U.S. Census .
DISTRICT CD13
2020 Census Population (adj Elec. §21003 - SWDB 9/27/2021) Name Count Percent Total Population (POP) 760,067 100.00% POP Hispanic or Latino 492,863 64.84% POP Not Hispanic or Latino (NH) 267,204 35.16% POP NH Population of one race 246,907 32.48% POP NH White alone 158,370 20.84% POP NH Black or African American alone 26,092 3.43% POP NH Asian alone 52,698 6.93% POP NH American Indian and Alaska Native alone 3,299 0.43% POP NH Native Hawaiian and Other Pacific Islander alone 2,930 0.39% POP NH Some Other Race alone 3,518 0.46% POP NH Population of two or more races 20,297 2.67% POP DOJ NH Black or African American 29,195 3.84% POP DOJ NH Asian 56,963 7.49% POP DOJ NH American Indian and Alaska Native 8,843 1.16% POP DOJ NH Native Hawaiian and Other Pacific Islander 3,474 0.46% POP DOJ NH Some Other Race 6,061 0.80% POP DOJ NH Balance of Population of two or more races 4,298 0.57%
2020 Census Voting Age Population (adj Elec. §21003 - SWDB 9/27/2021) Name Count Percent Total Voting Age Population (VAP) 537,000 100.00% VAP Hispanic or Latino 324,937 60.51% VAP Not Hispanic or Latino (NH) 212,063 39.49% VAP NH Population of one race 198,411 36.95% VAP NH White alone 130,701 24.34% VAP NH Black or African American alone 19,935 3.71% VAP NH Asian alone 40,512 7.54% VAP NH American Indian and Alaska Native alone 2,631 0.49% VAP NH Native Hawaiian and Other Pacific Islander alone 2,216 0.41% VAP NH Some Other Race alone 2,416 0.45% VAP NH Population of two or more races 13,652 2.54% VAP DOJ NH Black or African American 21,389 3.98% VAP DOJ NH Asian 43,070 8.02% VAP DOJ NH American Indian and Alaska Native 7,186 1.34% VAP DOJ NH Native Hawaiian and Other Pacific Islander 2,583 0.48% VAP DOJ NH Some Other Race 4,370 0.81% VAP DOJ NH Balance of Population of two or more races 2,764 0.51%
2020 Census Housing Occupancy Status Name Count Percent Total Housing Units 226,706 100.00% Occupied 216,809 95.63% Vacant 9,897 4.37%
2020 Census Group Quarters Population (adj Elec. §21003 - SWDB 9/27/2021) Name Count Percent Total Group Quarters Population: 10,989 100.00% Institutionalized population: 2,610 23.75% Correctional facilities for adults 1,229 11.18% Juvenile facilities 185 1.68% Nursing facilities/Skilled-nursing facilities 1,192 10.85% Other institutional facilities 4 0.04% Noninstitutionalized population: 8,379 76.25% College/University student housing 2,314 21.06% Military quarters 0 0.00% Other noninstitutional facilities 6,065 55.19%
2019-2023 ACS Citizen Population (adj Elec. §21003 - SWDB 7/16/2025) Name Count Percent Total Citizen Population (CITZ) 632,770 100.00% CITZ Hispanic or Latino 386,278 61.05% CITZ Not Hispanic or Latino (NH) 246,198 38.91% CITZ NH White alone 155,183 24.52% CITZ NH Black or African American Alone 24,583 3.88% CITZ NH Asian Alone 46,230 7.31% CITZ NH American Indian and Alaska Native Alone 1,592 0.25% CITZ NH Native Hawaiian and Other Pacific Islander alone 2,636 0.42% CITZ NH Black or African American and White 3,279 0.52% CITZ NH American Indian or Alaska Native and White 4,525 0.72% CITZ NH Asian and White 4,169 0.66% CITZ NH American Indian or Alaska Native and Black or African American 552 0.09% CITZ NH Remainder of Two or More Race 3,769 0.60% CITZ DOJ NH Black or African American 27,862 4.40% CITZ DOJ NH Asian 50,755 8.02% CITZ DOJ NH American Indian and Alaska Native 5,761 0.91%
2019-2023 ACS Citizen Voting Age Population (adj Elec. §21003 - SWDB 7/16/2025) Name Count Percent Total Citizen Voting Age Population (CVAP) 415,543 100.00% CVAP Hispanic or Latino 223,570 53.80% CVAP Not Hispanic or Latino (NH) 191,600 46.11% CVAP NH White alone 126,121 30.35% CVAP NH Black or African American Alone 18,635 4.48% CVAP NH Asian Alone 33,602 8.09% CVAP NH American Indian and Alaska Native Alone 1,381 0.33% CVAP NH Native Hawaiian and Other Pacific Islander alone 2,026 0.49% CVAP NH Black or African American and White 1,842 0.44% CVAP NH Asian and White 2,545 0.61% CVAP NH American Indian or Alaska Native and White 3,176 0.76% CVAP NH American Indian or Alaska Native and Black or African American 348 0.08% CVAP NH Remainder of Two or More Race 2,197 0.53% CVAP DOJ NH Black or African American 20,477 4.93% CVAP DOJ NH Asian 36,147 8.70% CVAP DOJ NH American Indian and Alaska Native 4,557 1.10%
Counties In District Name Count Percent Fresno 22,586 2.24% Madera 60,784 40.22% Merced 281,098 100.00% San Joaquin 135,539 17.44% Stanislaus 260,061 46.88%
Places In District Name Count Percent FRESNO: Firebaugh(C) 8,128 100.00% FRESNO: Mendota(C) 12,640 100.00% FRESNO: Remainder of Fresno(R) 1,818 1.60% MADERA: La Vina(U) 640 100.00% MADERA: Madera(C) 50,472 75.80% MADERA: Parksdale(U) 1,199 36.89% MADERA: Parkwood(U) 2,327 100.00% MADERA: Remainder of Madera(R) 6,146 26.97% MERCED: Atwater(C) 32,085 100.00% MERCED: Ballico(U) 347 100.00% MERCED: Bear Creek(U) 275 100.00% MERCED: Cressey(U) 371 100.00% MERCED: Delhi(U) 10,694 100.00% MERCED: Dos Palos(C) 5,832 100.00% MERCED: Dos Palos Y(U) 311 100.00% MERCED: El Nido(U) 333 100.00% MERCED: Franklin(U) 6,948 100.00% MERCED: Gustine(C) 6,123 100.00% MERCED: Hilmar-Irwin(U) 5,175 100.00% MERCED: Le Grand(U) 1,597 100.00% MERCED: Livingston(C) 14,214 100.00% MERCED: Los Banos(C) 45,676 100.00% MERCED: McSwain(U) 4,495 100.00% MERCED: Merced(C) 86,681 100.00% MERCED: Planada(U) 4,179 100.00% MERCED: Santa Nella(U) 2,222 100.00% MERCED: Snelling(U) 240 100.00% MERCED: South Dos Palos(U) 1,755 100.00% MERCED: Stevinson(U) 276 100.00% MERCED: Tuttle(U) 102 100.00% MERCED: Volta(U) 368 100.00% MERCED: Winton(U) 11,758 100.00% MERCED: Remainder of Merced(R) 39,041 100.00% SAN JOAQUIN: August(U) 8,074 92.89% SAN JOAQUIN: French Camp(U) 1,934 51.11% SAN JOAQUIN: Garden Acres(U) 11,459 99.98% SAN JOAQUIN: Kennedy(U) 3,246 100.00% SAN JOAQUIN: Lathrop(C) 28,765 100.00% SAN JOAQUIN: Stockton(C) 67,979 21.09% SAN JOAQUIN: Taft Mosswood(U) 1,644 100.00% SAN JOAQUIN: Remainder of San Joaquin(R) 12,438 18.00% STANISLAUS: Airport(U) 1,403 100.00% STANISLAUS: Bret Harte(U) 5,158 100.00% STANISLAUS: Bystrom(U) 3,994 100.00% STANISLAUS: Ceres(C) 49,462 100.00% STANISLAUS: Cowan(U) 349 100.00% STANISLAUS: Crows Landing(U) 325 100.00% STANISLAUS: Diablo Grande(U) 1,671 100.00% STANISLAUS: Empire(U) 1,071 25.38% STANISLAUS: Grayson(U) 1,043 100.00% STANISLAUS: Keyes(U) 5,699 100.00% STANISLAUS: Modesto(C) 74,455 33.96% STANISLAUS: Monterey Park Tract(U) 165 100.00% STANISLAUS: Newman(C) 12,379 100.00% STANISLAUS: Parklawn(U) 1,255 100.00% STANISLAUS: Patterson(C) 23,840 100.00% STANISLAUS: Riverdale Park(U) 1,058 100.00% STANISLAUS: Rouse(U) 1,926 100.00% STANISLAUS: Salida(U) 8,878 63.79% STANISLAUS: Turlock(C) 31,227 42.81% STANISLAUS: Westley(U) 579 100.00% STANISLAUS: West Modesto(U) 5,998 100.00% STANISLAUS: Remainder of Stanislaus(R) 28,126 54.58%
Senate Office of Demographics 02/2026