This Congressional district was established by the voters of California with the passage of Proposition 50 (2025) on November 4, 2025 and will go into effect after the November 2026 elections and upon seating of the 120th Congress, January 3, 2027. This district will stay in use until the California Citizens Redistricting Commission draws new maps following the 2030 U.S. Census .
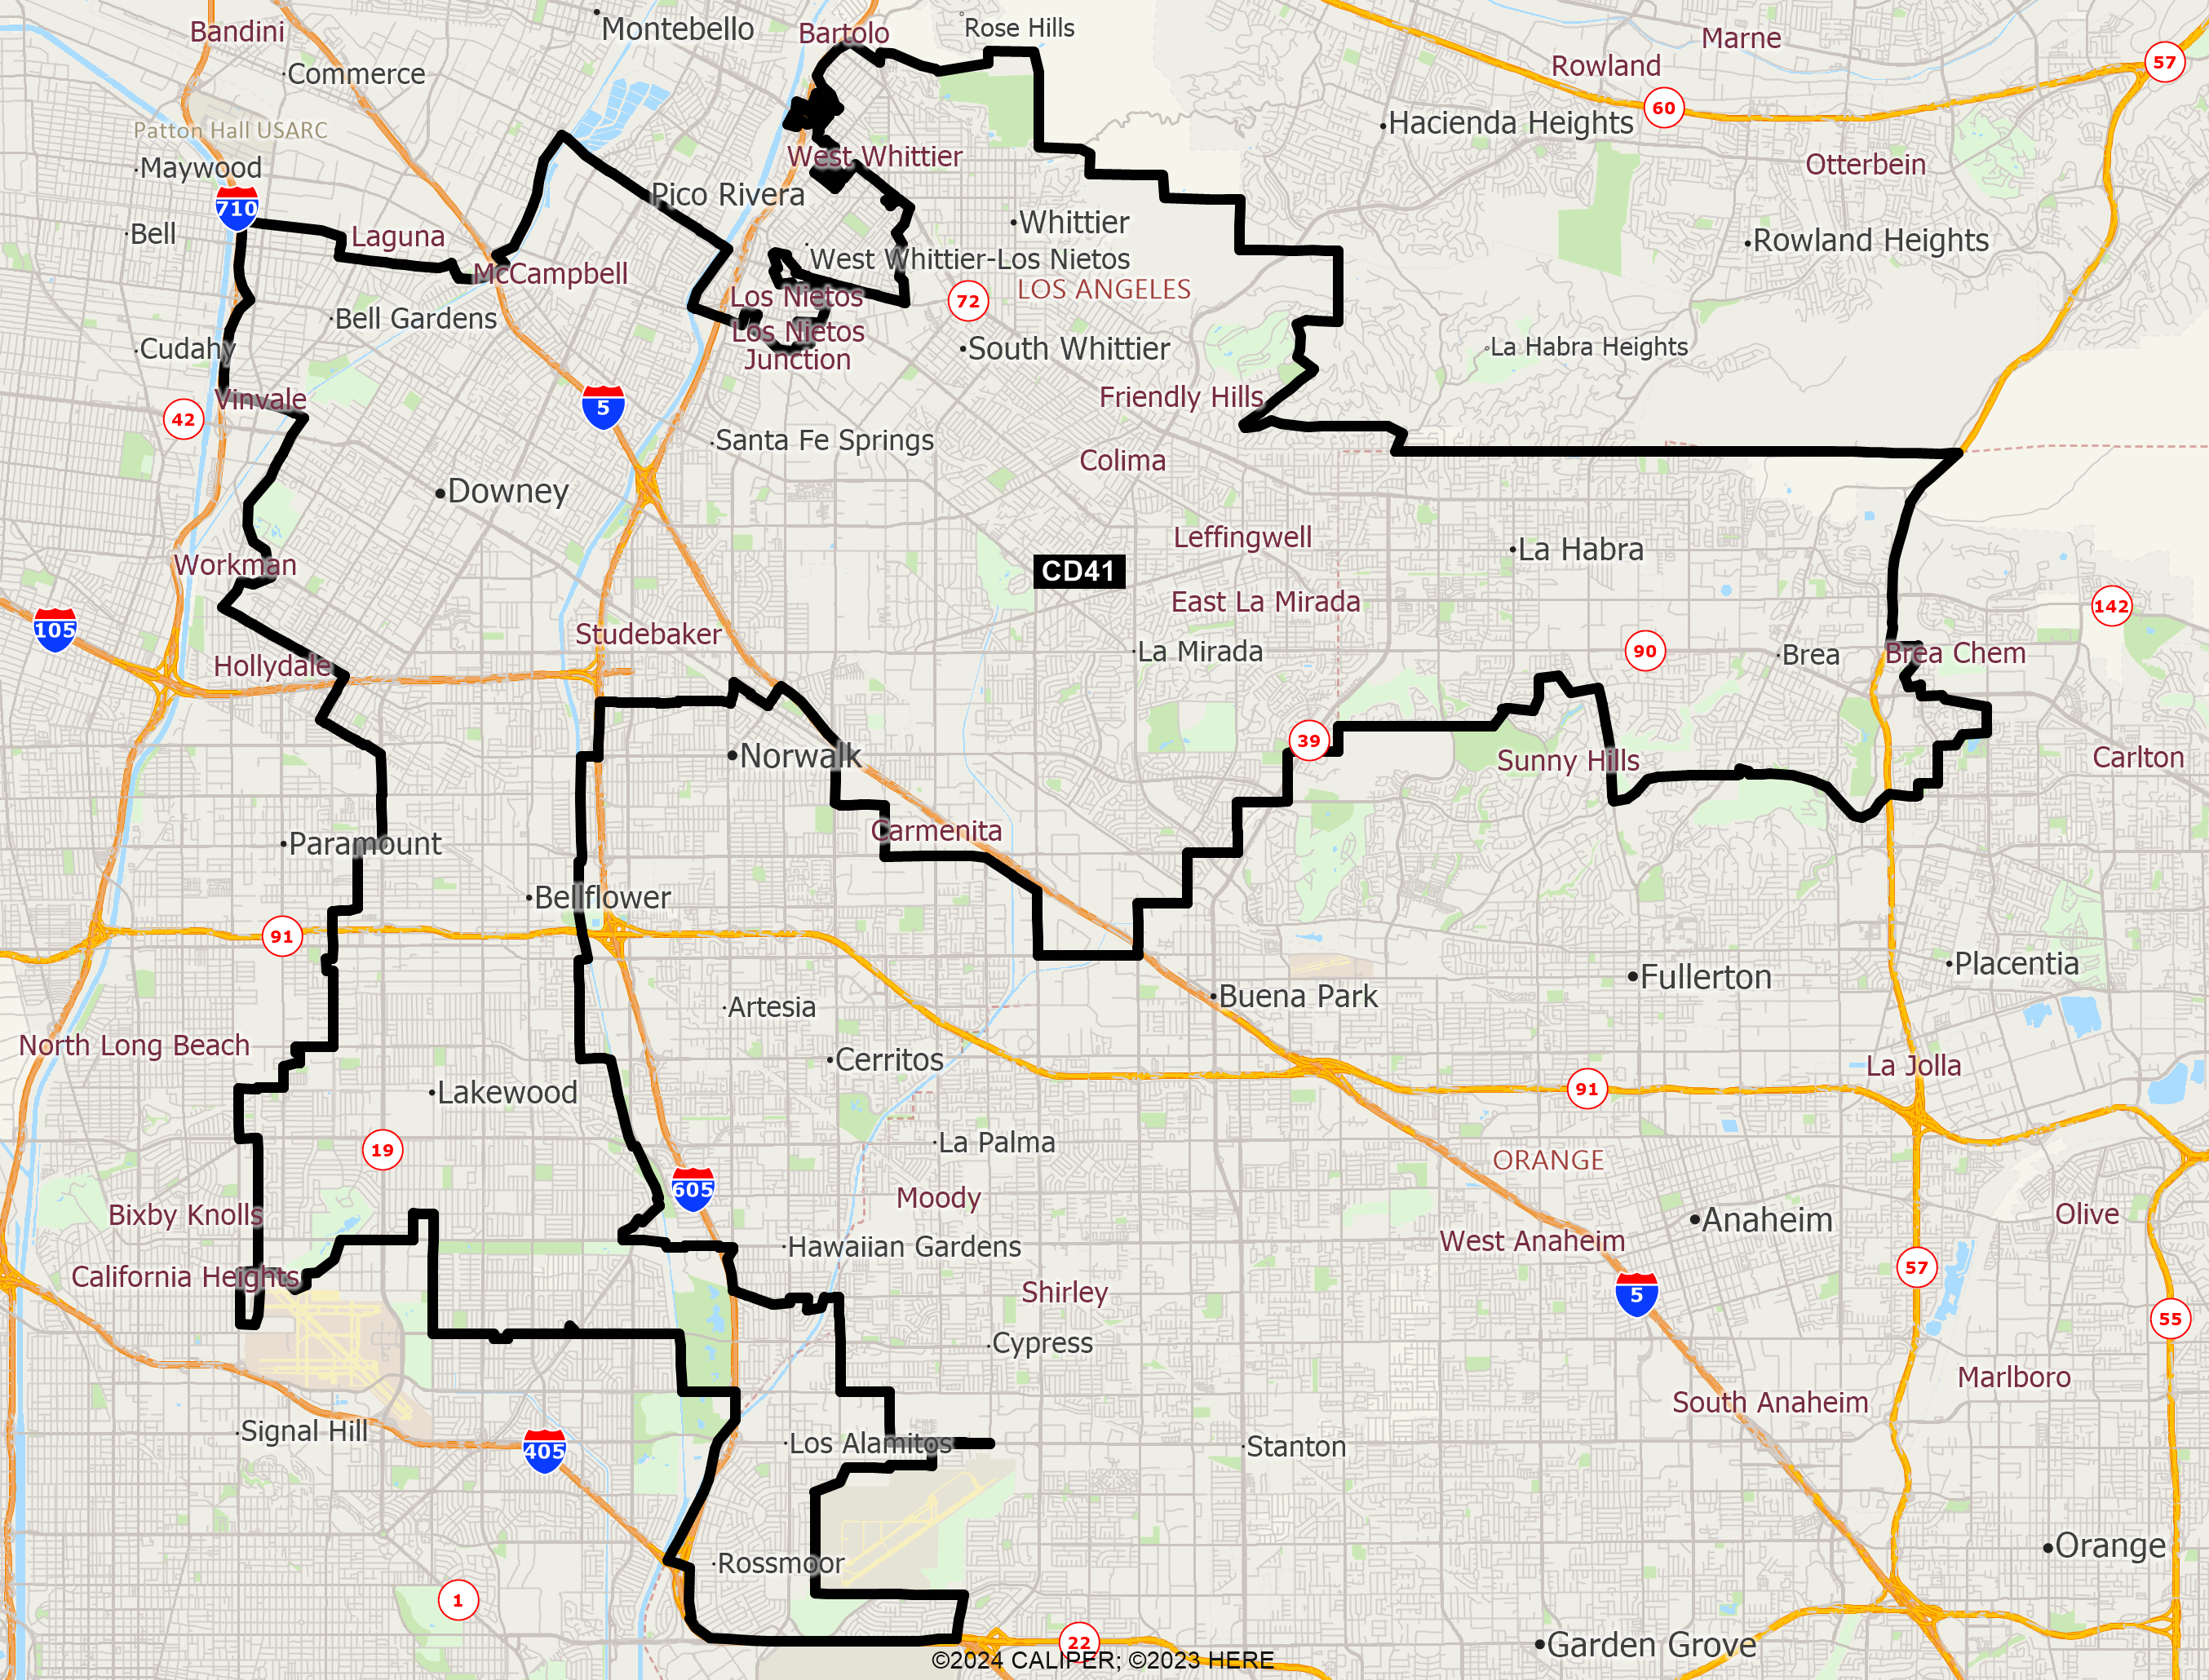
DISTRICT CD41
2020 Census Population (adj Elec. §21003 - SWDB 9/27/2021) Name Count Percent Total Population (POP) 760,065 100.00% POP Hispanic or Latino 461,976 60.78% POP Not Hispanic or Latino (NH) 298,089 39.22% POP NH Population of one race 278,219 36.60% POP NH White alone 163,158 21.47% POP NH Black or African American alone 28,998 3.82% POP NH Asian alone 78,136 10.28% POP NH American Indian and Alaska Native alone 1,855 0.24% POP NH Native Hawaiian and Other Pacific Islander alone 2,249 0.30% POP NH Some Other Race alone 3,823 0.50% POP NH Population of two or more races 19,870 2.61% POP DOJ NH Black or African American 31,414 4.13% POP DOJ NH Asian 84,954 11.18% POP DOJ NH American Indian and Alaska Native 4,935 0.65% POP DOJ NH Native Hawaiian and Other Pacific Islander 2,873 0.38% POP DOJ NH Some Other Race 6,449 0.85% POP DOJ NH Balance of Population of two or more races 4,306 0.57%
2020 Census Voting Age Population (adj Elec. §21003 - SWDB 9/27/2021) Name Count Percent Total Voting Age Population (VAP) 593,202 100.00% VAP Hispanic or Latino 342,784 57.79% VAP Not Hispanic or Latino (NH) 250,418 42.21% VAP NH Population of one race 237,059 39.96% VAP NH White alone 141,838 23.91% VAP NH Black or African American alone 23,278 3.92% VAP NH Asian alone 65,816 11.10% VAP NH American Indian and Alaska Native alone 1,624 0.27% VAP NH Native Hawaiian and Other Pacific Islander alone 1,848 0.31% VAP NH Some Other Race alone 2,655 0.45% VAP NH Population of two or more races 13,359 2.25% VAP DOJ NH Black or African American 24,806 4.18% VAP DOJ NH Asian 69,608 11.73% VAP DOJ NH American Indian and Alaska Native 4,353 0.73% VAP DOJ NH Native Hawaiian and Other Pacific Islander 2,225 0.38% VAP DOJ NH Some Other Race 4,679 0.79% VAP DOJ NH Balance of Population of two or more races 2,909 0.49%
2020 Census Housing Occupancy Status Name Count Percent Total Housing Units 244,387 100.00% Occupied 237,710 97.27% Vacant 6,677 2.73%
2020 Census Group Quarters Population (adj Elec. §21003 - SWDB 9/27/2021) Name Count Percent Total Group Quarters Population: 9,768 100.00% Institutionalized population: 3,289 33.67% Correctional facilities for adults 97 0.99% Juvenile facilities 29 0.30% Nursing facilities/Skilled-nursing facilities 3,091 31.64% Other institutional facilities 72 0.74% Noninstitutionalized population: 6,479 66.33% College/University student housing 2,107 21.57% Military quarters 0 0.00% Other noninstitutional facilities 4,372 44.76%
2019-2023 ACS Citizen Population (adj Elec. §21003 - SWDB 7/16/2025) Name Count Percent Total Citizen Population (CITZ) 674,836 100.00% CITZ Hispanic or Latino 396,705 58.79% CITZ Not Hispanic or Latino (NH) 278,063 41.20% CITZ NH White alone 165,543 24.53% CITZ NH Black or African American Alone 27,383 4.06% CITZ NH Asian Alone 65,670 9.73% CITZ NH American Indian and Alaska Native Alone 1,291 0.19% CITZ NH Native Hawaiian and Other Pacific Islander alone 1,747 0.26% CITZ NH Black or African American and White 2,793 0.41% CITZ NH American Indian or Alaska Native and White 6,869 1.02% CITZ NH Asian and White 2,246 0.33% CITZ NH American Indian or Alaska Native and Black or African American 82 0.01% CITZ NH Remainder of Two or More Race 4,475 0.66% CITZ DOJ NH Black or African American 30,176 4.47% CITZ DOJ NH Asian 72,539 10.75% CITZ DOJ NH American Indian and Alaska Native 3,537 0.52%
2019-2023 ACS Citizen Voting Age Population (adj Elec. §21003 - SWDB 7/16/2025) Name Count Percent Total Citizen Voting Age Population (CVAP) 509,320 100.00% CVAP Hispanic or Latino 280,278 55.03% CVAP Not Hispanic or Latino (NH) 228,945 44.95% CVAP NH White alone 142,004 27.88% CVAP NH Black or African American Alone 21,803 4.28% CVAP NH Asian Alone 53,582 10.52% CVAP NH American Indian and Alaska Native Alone 945 0.19% CVAP NH Native Hawaiian and Other Pacific Islander alone 1,493 0.29% CVAP NH Black or African American and White 1,614 0.32% CVAP NH Asian and White 3,173 0.62% CVAP NH American Indian or Alaska Native and White 1,749 0.34% CVAP NH American Indian or Alaska Native and Black or African American 82 0.02% CVAP NH Remainder of Two or More Race 2,551 0.50% CVAP DOJ NH Black or African American 23,417 4.60% CVAP DOJ NH Asian 56,755 11.14% CVAP DOJ NH American Indian and Alaska Native 2,694 0.53%
Counties In District Name Count Percent Los Angeles 621,294 6.18% Orange 138,773 4.35%
Places In District Name Count Percent LOS ANGELES: Bellflower(C) 79,561 100.00% LOS ANGELES: Bell Gardens(C) 39,700 100.00% LOS ANGELES: Downey(C) 114,713 100.00% LOS ANGELES: East Whittier(U) 10,422 100.00% LOS ANGELES: Lakewood(C) 61,017 73.77% LOS ANGELES: La Mirada(C) 48,124 100.00% LOS ANGELES: Long Beach(C) 30,240 6.45% LOS ANGELES: Norwalk(C) 48,115 46.63% LOS ANGELES: Pico Rivera(C) 24,232 38.87% LOS ANGELES: Santa Fe Springs(C) 19,236 100.00% LOS ANGELES: South Whittier(U) 56,620 100.00% LOS ANGELES: West Whittier-Los Nietos(U) 258 1.01% LOS ANGELES: Whittier(C) 87,592 100.00% LOS ANGELES: Remainder of Los Angeles(R) 1,464 1.67% ORANGE: Brea(C) 30,753 64.88% ORANGE: Fullerton(C) 17,148 11.91% ORANGE: La Habra(C) 63,234 100.00% ORANGE: Los Alamitos(C) 10,904 92.45% ORANGE: Rossmoor(U) 10,634 100.00% ORANGE: Seal Beach(C) 6,097 24.12% ORANGE: Remainder of Orange(R) 3 0.01%
Senate Office of Demographics 02/2026