This Congressional district was established by the voters of California with the passage of Proposition 50 (2025) on November 4, 2025 and will go into effect after the November 2026 elections and upon seating of the 120th Congress, January 3, 2027. This district will stay in use until the California Citizens Redistricting Commission draws new maps following the 2030 U.S. Census .
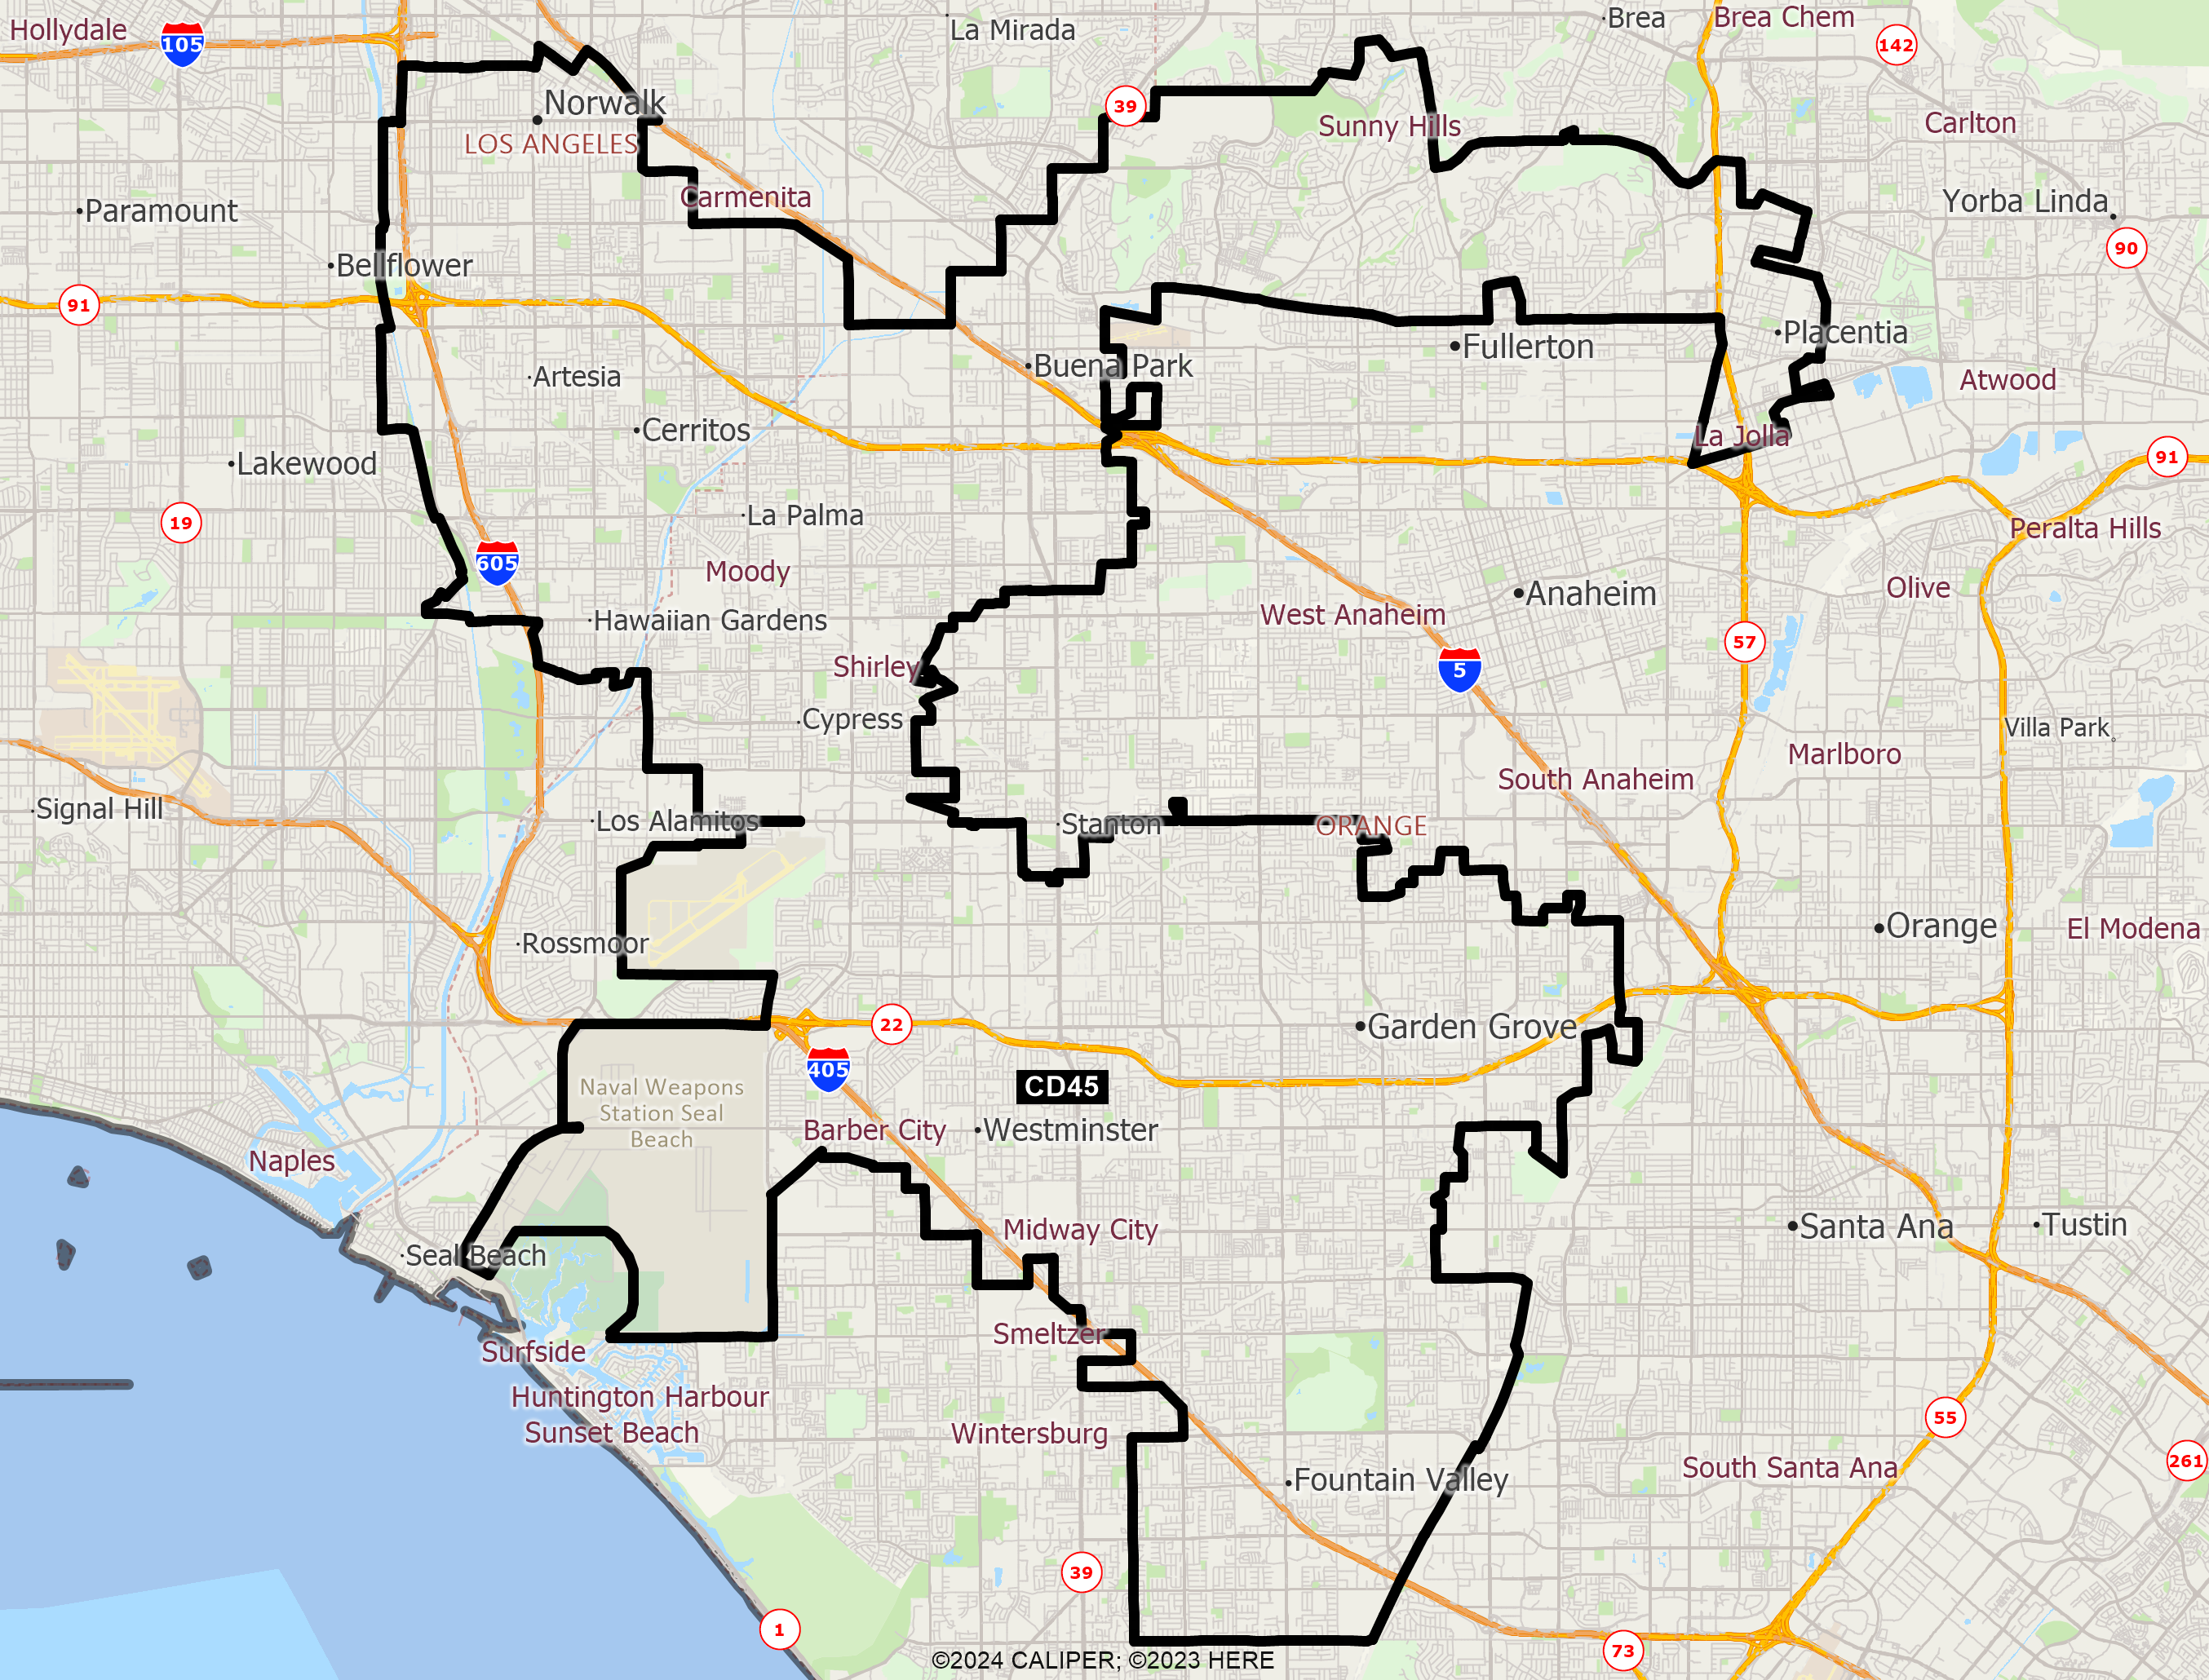
DISTRICT CD45
2020 Census Population (adj Elec. §21003 - SWDB 9/27/2021) Name Count Percent Total Population (POP) 760,066 100.00% POP Hispanic or Latino 263,412 34.66% POP Not Hispanic or Latino (NH) 496,654 65.34% POP NH Population of one race 474,785 62.47% POP NH White alone 151,712 19.96% POP NH Black or African American alone 18,271 2.40% POP NH Asian alone 297,463 39.14% POP NH American Indian and Alaska Native alone 1,213 0.16% POP NH Native Hawaiian and Other Pacific Islander alone 3,056 0.40% POP NH Some Other Race alone 3,070 0.40% POP NH Population of two or more races 21,869 2.88% POP DOJ NH Black or African American 20,252 2.66% POP DOJ NH Asian 306,731 40.36% POP DOJ NH American Indian and Alaska Native 4,115 0.54% POP DOJ NH Native Hawaiian and Other Pacific Islander 3,749 0.49% POP DOJ NH Some Other Race 5,353 0.70% POP DOJ NH Balance of Population of two or more races 4,742 0.62%
2020 Census Voting Age Population (adj Elec. §21003 - SWDB 9/27/2021) Name Count Percent Total Voting Age Population (VAP) 605,051 100.00% VAP Hispanic or Latino 191,886 31.71% VAP Not Hispanic or Latino (NH) 413,165 68.29% VAP NH Population of one race 398,579 65.88% VAP NH White alone 133,043 21.99% VAP NH Black or African American alone 14,828 2.45% VAP NH Asian alone 244,942 40.48% VAP NH American Indian and Alaska Native alone 1,041 0.17% VAP NH Native Hawaiian and Other Pacific Islander alone 2,459 0.41% VAP NH Some Other Race alone 2,266 0.37% VAP NH Population of two or more races 14,586 2.41% VAP DOJ NH Black or African American 16,068 2.66% VAP DOJ NH Asian 250,251 41.36% VAP DOJ NH American Indian and Alaska Native 3,548 0.59% VAP DOJ NH Native Hawaiian and Other Pacific Islander 2,948 0.49% VAP DOJ NH Some Other Race 4,104 0.68% VAP DOJ NH Balance of Population of two or more races 3,203 0.53%
2020 Census Housing Occupancy Status Name Count Percent Total Housing Units 232,757 100.00% Occupied 226,857 97.47% Vacant 5,900 2.53%
2020 Census Group Quarters Population (adj Elec. §21003 - SWDB 9/27/2021) Name Count Percent Total Group Quarters Population: 8,895 100.00% Institutionalized population: 2,692 30.26% Correctional facilities for adults 37 0.42% Juvenile facilities 184 2.07% Nursing facilities/Skilled-nursing facilities 2,140 24.06% Other institutional facilities 331 3.72% Noninstitutionalized population: 6,203 69.74% College/University student housing 1,928 21.68% Military quarters 83 0.93% Other noninstitutional facilities 4,192 47.13%
2019-2023 ACS Citizen Population (adj Elec. §21003 - SWDB 7/16/2025) Name Count Percent Total Citizen Population (CITZ) 643,894 100.00% CITZ Hispanic or Latino 207,930 32.29% CITZ Not Hispanic or Latino (NH) 436,012 67.71% CITZ NH White alone 151,687 23.56% CITZ NH Black or African American Alone 17,166 2.67% CITZ NH Asian Alone 243,938 37.88% CITZ NH American Indian and Alaska Native Alone 961 0.15% CITZ NH Native Hawaiian and Other Pacific Islander alone 2,675 0.42% CITZ NH Black or African American and White 1,948 0.30% CITZ NH American Indian or Alaska Native and White 11,067 1.72% CITZ NH Asian and White 1,831 0.28% CITZ NH American Indian or Alaska Native and Black or African American 79 0.01% CITZ NH Remainder of Two or More Race 4,676 0.73% CITZ DOJ NH Black or African American 19,114 2.97% CITZ DOJ NH Asian 255,005 39.60% CITZ DOJ NH American Indian and Alaska Native 2,792 0.43%
2019-2023 ACS Citizen Voting Age Population (adj Elec. §21003 - SWDB 7/16/2025) Name Count Percent Total Citizen Voting Age Population (CVAP) 492,914 100.00% CVAP Hispanic or Latino 139,346 28.27% CVAP Not Hispanic or Latino (NH) 353,677 71.75% CVAP NH White alone 130,138 26.40% CVAP NH Black or African American Alone 13,279 2.69% CVAP NH Asian Alone 195,252 39.61% CVAP NH American Indian and Alaska Native Alone 931 0.19% CVAP NH Native Hawaiian and Other Pacific Islander alone 2,311 0.47% CVAP NH Black or African American and White 1,181 0.24% CVAP NH Asian and White 6,023 1.22% CVAP NH American Indian or Alaska Native and White 1,569 0.32% CVAP NH American Indian or Alaska Native and Black or African American 79 0.02% CVAP NH Remainder of Two or More Race 2,922 0.59% CVAP DOJ NH Black or African American 14,460 2.93% CVAP DOJ NH Asian 201,275 40.83% CVAP DOJ NH American Indian and Alaska Native 2,500 0.51%
Counties In District Name Count Percent Los Angeles 157,730 1.57% Orange 602,338 18.86%
Places In District Name Count Percent LOS ANGELES: Artesia(C) 16,447 100.00% LOS ANGELES: Cerritos(C) 49,696 100.00% LOS ANGELES: Hawaiian Gardens(C) 14,230 100.00% LOS ANGELES: Lakewood(C) 21,696 26.23% LOS ANGELES: Norwalk(C) 55,065 53.37% LOS ANGELES: Remainder of Los Angeles(R) 596 0.68% ORANGE: Buena Park(C) 84,188 100.00% ORANGE: Cypress(C) 50,235 100.00% ORANGE: Fountain Valley(C) 57,120 100.00% ORANGE: Fullerton(C) 65,668 45.63% ORANGE: Garden Grove(C) 172,347 100.00% ORANGE: La Palma(C) 15,597 100.00% ORANGE: Los Alamitos(C) 890 7.55% ORANGE: Midway City(U) 8,845 100.00% ORANGE: Placentia(C) 14,884 28.66% ORANGE: Santa Ana(C) 23,846 7.66% ORANGE: Seal Beach(C) 607 2.40% ORANGE: Stanton(C) 13,258 34.83% ORANGE: Westminster(C) 91,083 100.00% ORANGE: Remainder of Orange(R) 3,770 13.54%
Senate Office of Demographics 02/2026