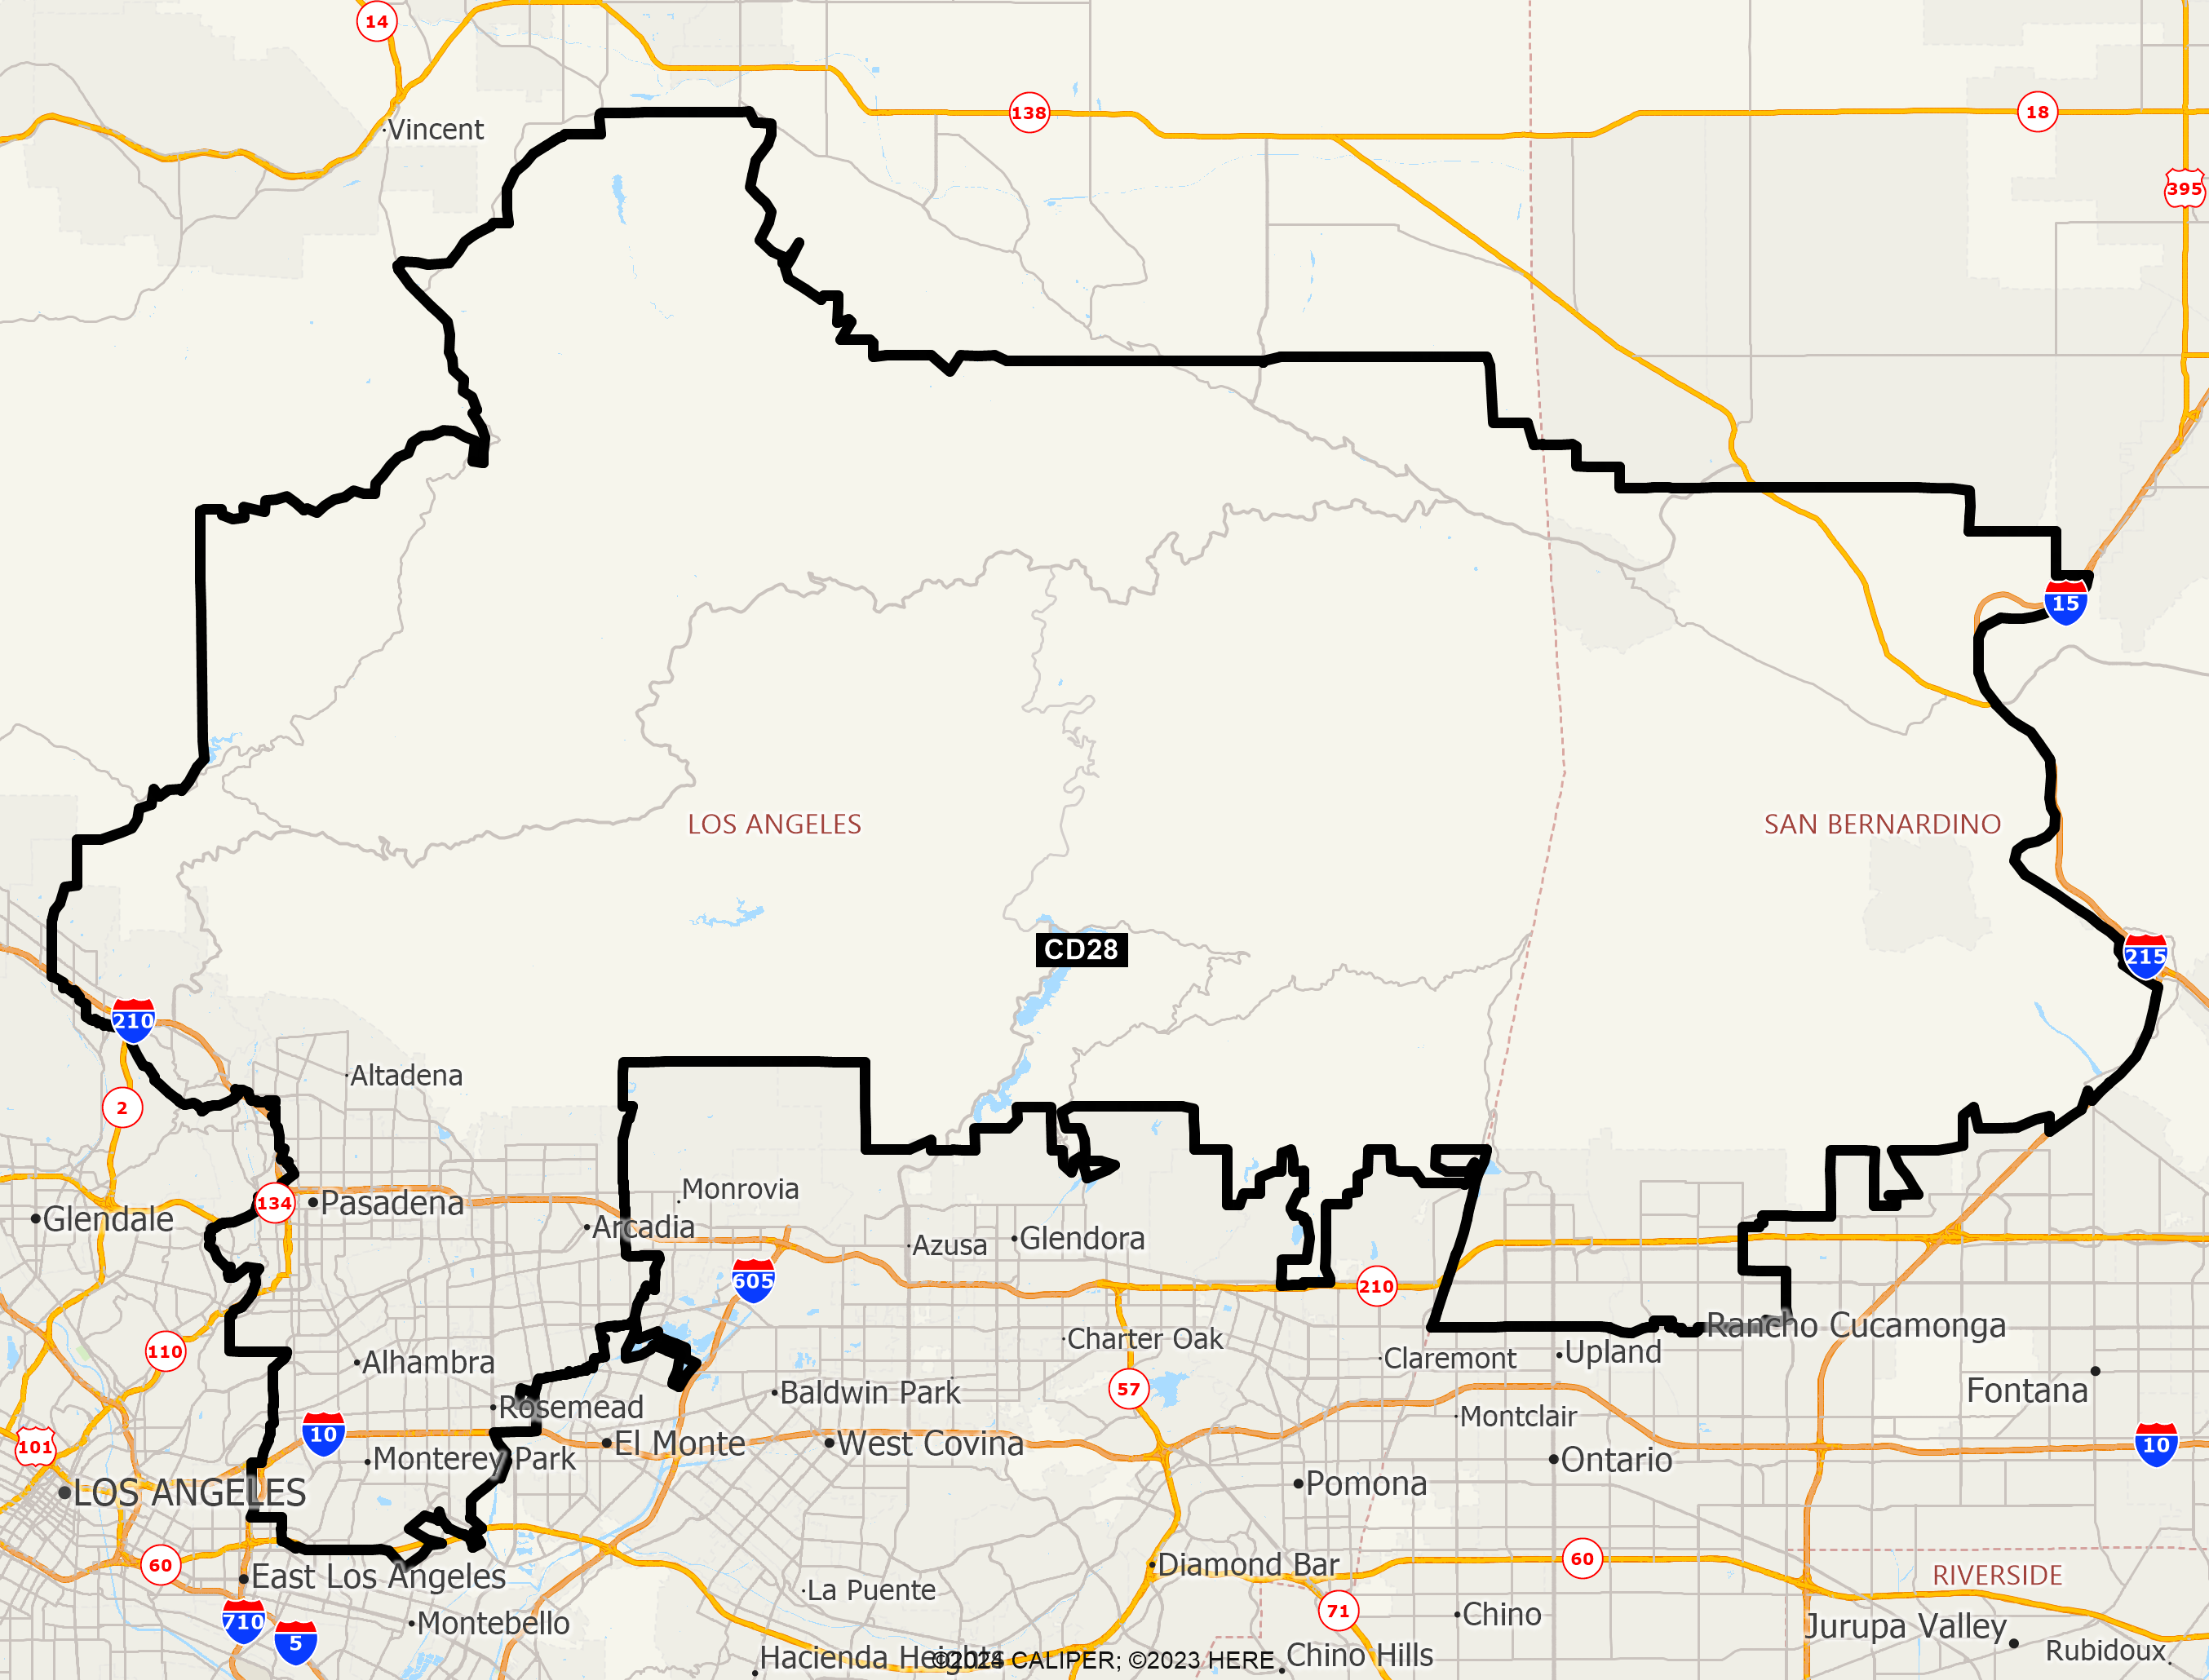
This Congressional district was established by the voters of California with the passage of Proposition 50 (2025) on November 4, 2025 and will go into effect after the November 2026 elections and upon seating of the 120th Congress, January 3, 2027. This district will stay in use until the California Citizens Redistricting Commission draws new maps following the 2030 U.S. Census .
DISTRICT CD28
2020 Census Population (adj Elec. §21003 - SWDB 9/27/2021) Name Count Percent Total Population (POP) 760,065 100.00% POP Hispanic or Latino 210,705 27.72% POP Not Hispanic or Latino (NH) 549,360 72.28% POP NH Population of one race 524,363 68.99% POP NH White alone 200,882 26.43% POP NH Black or African American alone 29,396 3.87% POP NH Asian alone 288,737 37.99% POP NH American Indian and Alaska Native alone 1,116 0.15% POP NH Native Hawaiian and Other Pacific Islander alone 664 0.09% POP NH Some Other Race alone 3,568 0.47% POP NH Population of two or more races 24,997 3.29% POP DOJ NH Black or African American 32,365 4.26% POP DOJ NH Asian 300,006 39.47% POP DOJ NH American Indian and Alaska Native 3,722 0.49% POP DOJ NH Native Hawaiian and Other Pacific Islander 961 0.13% POP DOJ NH Some Other Race 6,306 0.83% POP DOJ NH Balance of Population of two or more races 5,118 0.67%
2020 Census Voting Age Population (adj Elec. §21003 - SWDB 9/27/2021) Name Count Percent Total Voting Age Population (VAP) 619,450 100.00% VAP Hispanic or Latino 159,685 25.78% VAP Not Hispanic or Latino (NH) 459,765 74.22% VAP NH Population of one race 444,071 71.69% VAP NH White alone 174,025 28.09% VAP NH Black or African American alone 24,945 4.03% VAP NH Asian alone 241,047 38.91% VAP NH American Indian and Alaska Native alone 939 0.15% VAP NH Native Hawaiian and Other Pacific Islander alone 503 0.08% VAP NH Some Other Race alone 2,612 0.42% VAP NH Population of two or more races 15,694 2.53% VAP DOJ NH Black or African American 26,828 4.33% VAP DOJ NH Asian 246,706 39.83% VAP DOJ NH American Indian and Alaska Native 3,141 0.51% VAP DOJ NH Native Hawaiian and Other Pacific Islander 724 0.12% VAP DOJ NH Some Other Race 4,752 0.77% VAP DOJ NH Balance of Population of two or more races 3,589 0.58%
2020 Census Housing Occupancy Status Name Count Percent Total Housing Units 284,186 100.00% Occupied 270,835 95.30% Vacant 13,351 4.70%
2020 Census Group Quarters Population (adj Elec. §21003 - SWDB 9/27/2021) Name Count Percent Total Group Quarters Population: 8,947 100.00% Institutionalized population: 4,390 49.07% Correctional facilities for adults 21 0.23% Juvenile facilities 429 4.79% Nursing facilities/Skilled-nursing facilities 3,784 42.29% Other institutional facilities 156 1.74% Noninstitutionalized population: 4,557 50.93% College/University student housing 713 7.97% Military quarters 0 0.00% Other noninstitutional facilities 3,844 42.96%
2019-2023 ACS Citizen Population (adj Elec. §21003 - SWDB 7/16/2025) Name Count Percent Total Citizen Population (CITZ) 656,474 100.00% CITZ Hispanic or Latino 183,831 28.00% CITZ Not Hispanic or Latino (NH) 472,590 71.99% CITZ NH White alone 195,403 29.77% CITZ NH Black or African American Alone 30,219 4.60% CITZ NH Asian Alone 220,141 33.53% CITZ NH American Indian and Alaska Native Alone 1,611 0.25% CITZ NH Native Hawaiian and Other Pacific Islander alone 1,208 0.18% CITZ NH Black or African American and White 4,159 0.63% CITZ NH American Indian or Alaska Native and White 12,987 1.98% CITZ NH Asian and White 2,017 0.31% CITZ NH American Indian or Alaska Native and Black or African American 567 0.09% CITZ NH Remainder of Two or More Race 4,222 0.64% CITZ DOJ NH Black or African American 34,378 5.24% CITZ DOJ NH Asian 233,128 35.51% CITZ DOJ NH American Indian and Alaska Native 3,628 0.55%
2019-2023 ACS Citizen Voting Age Population (adj Elec. §21003 - SWDB 7/16/2025) Name Count Percent Total Citizen Voting Age Population (CVAP) 519,416 100.00% CVAP Hispanic or Latino 133,810 25.76% CVAP Not Hispanic or Latino (NH) 385,652 74.25% CVAP NH White alone 168,593 32.46% CVAP NH Black or African American Alone 25,987 5.00% CVAP NH Asian Alone 176,156 33.91% CVAP NH American Indian and Alaska Native Alone 1,290 0.25% CVAP NH Native Hawaiian and Other Pacific Islander alone 906 0.17% CVAP NH Black or African American and White 2,419 0.47% CVAP NH Asian and White 5,552 1.07% CVAP NH American Indian or Alaska Native and White 1,663 0.32% CVAP NH American Indian or Alaska Native and Black or African American 462 0.09% CVAP NH Remainder of Two or More Race 2,608 0.50% CVAP DOJ NH Black or African American 28,406 5.47% CVAP DOJ NH Asian 181,708 34.98% CVAP DOJ NH American Indian and Alaska Native 2,953 0.57%
Counties In District Name Count Percent Los Angeles 635,328 6.32% San Bernardino 124,740 5.72%
Places In District Name Count Percent LOS ANGELES: Alhambra(C) 83,109 100.00% LOS ANGELES: Altadena(U) 43,015 100.00% LOS ANGELES: Arcadia(C) 56,781 100.00% LOS ANGELES: East Pasadena(U) 6,036 100.00% LOS ANGELES: East San Gabriel(U) 22,828 100.00% LOS ANGELES: La Canada Flintridge(C) 20,602 100.00% LOS ANGELES: La Crescenta-Montrose(U) 19,990 99.74% LOS ANGELES: Los Angeles(C) 154 0.00% LOS ANGELES: Monterey Park(C) 61,255 100.00% LOS ANGELES: Pasadena(C) 130,263 93.54% LOS ANGELES: Rosemead(C) 51,337 100.00% LOS ANGELES: San Gabriel(C) 39,688 100.00% LOS ANGELES: San Marino(C) 12,536 100.00% LOS ANGELES: San Pasqual(U) 2,107 100.00% LOS ANGELES: Sierra Madre(C) 11,302 100.00% LOS ANGELES: South Pasadena(C) 27,020 100.00% LOS ANGELES: South San Gabriel(U) 7,954 100.00% LOS ANGELES: Temple City(C) 36,591 100.00% LOS ANGELES: Remainder of Los Angeles(R) 2,760 3.15% SAN BERNARDINO: Lytle Creek(U) 725 100.00% SAN BERNARDINO: Rancho Cucamonga(C) 74,152 42.42% SAN BERNARDINO: San Antonio Heights(U) 3,454 100.00% SAN BERNARDINO: San Bernardino(C) 0 0.00% SAN BERNARDINO: Upland(C) 40,399 50.90% SAN BERNARDINO: Wrightwood(U) 4,727 100.00% SAN BERNARDINO: Remainder of San Bernardino(R) 1,283 1.06%
Senate Office of Demographics 02/2026