This Congressional district was established by the voters of California with the passage of Proposition 50 (2025) on November 4, 2025 and will go into effect after the November 2026 elections and upon seating of the 120th Congress, January 3, 2027. This district will stay in use until the California Citizens Redistricting Commission draws new maps following the 2030 U.S. Census .
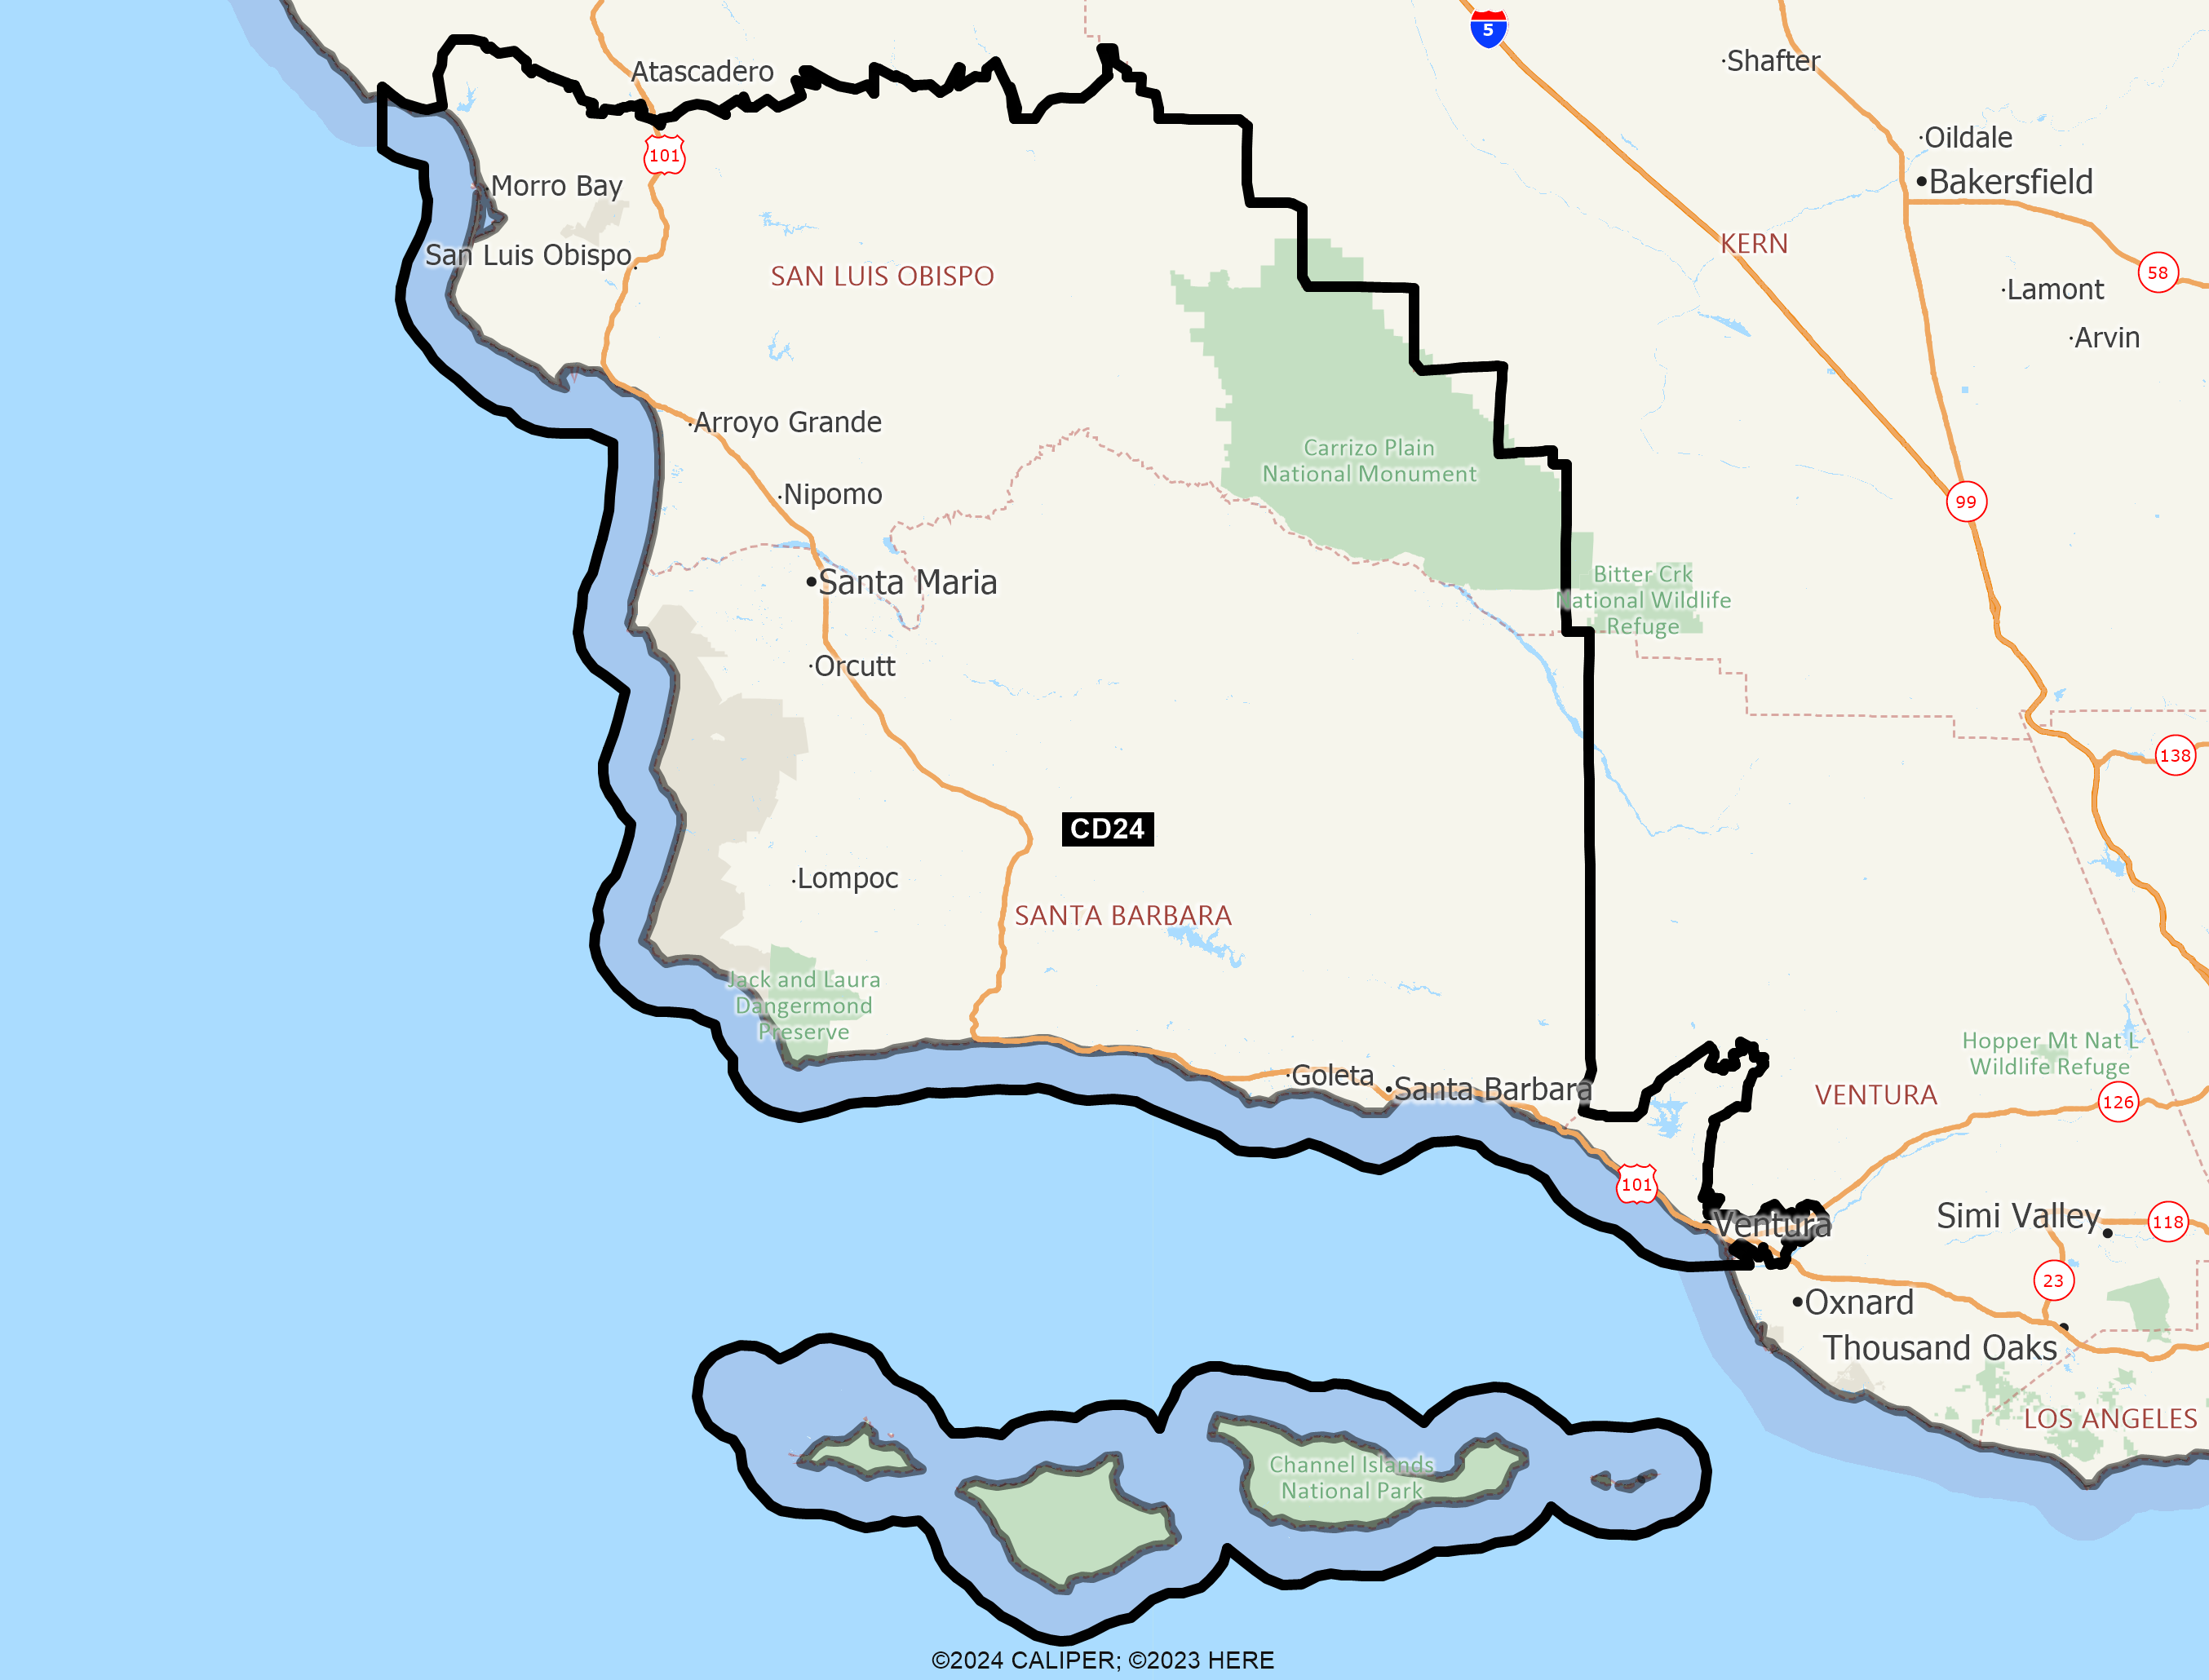
Congressional District 24 includes the San Nicholas and Santa Barbara Islands not shown here
DISTRICT CD24
2020 Census Population (adj Elec. §21003 - SWDB 9/27/2021) Name Count Percent Total Population (POP) 760,065 100.00% POP Hispanic or Latino 294,734 38.78% POP Not Hispanic or Latino (NH) 465,331 61.22% POP NH Population of one race 433,770 57.07% POP NH White alone 378,230 49.76% POP NH Black or African American alone 9,615 1.27% POP NH Asian alone 37,890 4.99% POP NH American Indian and Alaska Native alone 2,809 0.37% POP NH Native Hawaiian and Other Pacific Islander alone 910 0.12% POP NH Some Other Race alone 4,316 0.57% POP NH Population of two or more races 31,561 4.15% POP DOJ NH Black or African American 13,108 1.72% POP DOJ NH Asian 48,068 6.32% POP DOJ NH American Indian and Alaska Native 10,048 1.32% POP DOJ NH Native Hawaiian and Other Pacific Islander 1,722 0.23% POP DOJ NH Some Other Race 10,468 1.38% POP DOJ NH Balance of Population of two or more races 3,687 0.49%
2020 Census Voting Age Population (adj Elec. §21003 - SWDB 9/27/2021) Name Count Percent Total Voting Age Population (VAP) 607,277 100.00% VAP Hispanic or Latino 206,673 34.03% VAP Not Hispanic or Latino (NH) 400,604 65.97% VAP NH Population of one race 378,140 62.27% VAP NH White alone 329,668 54.29% VAP NH Black or African American alone 8,305 1.37% VAP NH Asian alone 33,754 5.56% VAP NH American Indian and Alaska Native alone 2,303 0.38% VAP NH Native Hawaiian and Other Pacific Islander alone 741 0.12% VAP NH Some Other Race alone 3,369 0.55% VAP NH Population of two or more races 22,464 3.70% VAP DOJ NH Black or African American 10,495 1.73% VAP DOJ NH Asian 40,282 6.63% VAP DOJ NH American Indian and Alaska Native 8,214 1.35% VAP DOJ NH Native Hawaiian and Other Pacific Islander 1,309 0.22% VAP DOJ NH Some Other Race 8,102 1.33% VAP DOJ NH Balance of Population of two or more races 2,534 0.42%
2020 Census Housing Occupancy Status Name Count Percent Total Housing Units 292,688 100.00% Occupied 269,259 92.00% Vacant 23,429 8.00%
2020 Census Group Quarters Population (adj Elec. §21003 - SWDB 9/27/2021) Name Count Percent Total Group Quarters Population: 32,775 100.00% Institutionalized population: 4,632 14.13% Correctional facilities for adults 1,182 3.61% Juvenile facilities 204 0.62% Nursing facilities/Skilled-nursing facilities 3,239 9.88% Other institutional facilities 7 0.02% Noninstitutionalized population: 28,143 85.87% College/University student housing 20,297 61.93% Military quarters 358 1.09% Other noninstitutional facilities 7,488 22.85%
2019-2023 ACS Citizen Population (adj Elec. §21003 - SWDB 7/16/2025) Name Count Percent Total Citizen Population (CITZ) 682,553 100.00% CITZ Hispanic or Latino 239,825 35.14% CITZ Not Hispanic or Latino (NH) 442,861 64.88% CITZ NH White alone 379,171 55.55% CITZ NH Black or African American Alone 9,984 1.46% CITZ NH Asian Alone 27,789 4.07% CITZ NH American Indian and Alaska Native Alone 1,380 0.20% CITZ NH Native Hawaiian and Other Pacific Islander alone 876 0.13% CITZ NH Black or African American and White 4,391 0.64% CITZ NH American Indian or Alaska Native and White 10,489 1.54% CITZ NH Asian and White 5,069 0.74% CITZ NH American Indian or Alaska Native and Black or African American 214 0.03% CITZ NH Remainder of Two or More Race 3,376 0.49% CITZ DOJ NH Black or African American 14,375 2.11% CITZ DOJ NH Asian 38,278 5.61% CITZ DOJ NH American Indian and Alaska Native 6,449 0.94%
2019-2023 ACS Citizen Voting Age Population (adj Elec. §21003 - SWDB 7/16/2025) Name Count Percent Total Citizen Voting Age Population (CVAP) 532,407 100.00% CVAP Hispanic or Latino 150,929 28.35% CVAP Not Hispanic or Latino (NH) 381,606 71.68% CVAP NH White alone 330,619 62.10% CVAP NH Black or African American Alone 9,052 1.70% CVAP NH Asian Alone 23,857 4.48% CVAP NH American Indian and Alaska Native Alone 1,285 0.24% CVAP NH Native Hawaiian and Other Pacific Islander alone 787 0.15% CVAP NH Black or African American and White 2,562 0.48% CVAP NH Asian and White 6,840 1.28% CVAP NH American Indian or Alaska Native and White 4,162 0.78% CVAP NH American Indian or Alaska Native and Black or African American 214 0.04% CVAP NH Remainder of Two or More Race 2,215 0.42% CVAP DOJ NH Black or African American 11,614 2.18% CVAP DOJ NH Asian 30,697 5.77% CVAP DOJ NH American Indian and Alaska Native 5,447 1.02%
Counties In District Name Count Percent San Luis Obispo 178,170 63.81% Santa Barbara 446,704 100.00% Ventura 135,192 15.99%
Places In District Name Count Percent SAN LUIS OBISPO: Arroyo Grande(C) 18,469 100.00% SAN LUIS OBISPO: Avila Beach(U) 1,580 100.00% SAN LUIS OBISPO: Blacklake(U) 1,016 100.00% SAN LUIS OBISPO: California Polytechnic State University(U) 8,585 100.00% SAN LUIS OBISPO: Callender(U) 1,284 100.00% SAN LUIS OBISPO: Cayucos(U) 2,515 100.00% SAN LUIS OBISPO: Edna(U) 184 100.00% SAN LUIS OBISPO: Garden Farms(U) 449 100.00% SAN LUIS OBISPO: Grover Beach(C) 12,739 100.00% SAN LUIS OBISPO: Los Berros(U) 625 100.00% SAN LUIS OBISPO: Los Osos(U) 14,494 100.00% SAN LUIS OBISPO: Los Ranchos(U) 1,516 100.00% SAN LUIS OBISPO: Morro Bay(C) 10,784 100.00% SAN LUIS OBISPO: Nipomo(U) 18,222 100.00% SAN LUIS OBISPO: Oceano(U) 7,218 100.00% SAN LUIS OBISPO: Pismo Beach(C) 8,086 100.00% SAN LUIS OBISPO: San Luis Obispo(C) 47,160 100.00% SAN LUIS OBISPO: Santa Margarita(U) 1,294 100.00% SAN LUIS OBISPO: Woodlands(U) 1,933 100.00% SAN LUIS OBISPO: Remainder of San Luis Obispo(R) 20,017 54.02% SANTA BARBARA: Ballard(U) 769 100.00% SANTA BARBARA: Buellton(C) 5,175 100.00% SANTA BARBARA: Carpinteria(C) 13,293 100.00% SANTA BARBARA: Casmalia(U) 150 100.00% SANTA BARBARA: Cuyama(U) 37 100.00% SANTA BARBARA: Eastern Goleta Valley(U) 28,693 100.00% SANTA BARBARA: Garey(U) 74 100.00% SANTA BARBARA: Goleta(C) 32,754 100.00% SANTA BARBARA: Guadalupe(C) 8,075 100.00% SANTA BARBARA: Isla Vista(U) 15,513 100.00% SANTA BARBARA: Lompoc(C) 41,866 100.00% SANTA BARBARA: Los Alamos(U) 1,842 100.00% SANTA BARBARA: Los Olivos(U) 1,203 100.00% SANTA BARBARA: Mission Canyon(U) 2,544 100.00% SANTA BARBARA: Mission Hills(U) 3,585 100.00% SANTA BARBARA: Montecito(U) 8,648 100.00% SANTA BARBARA: New Cuyama(U) 546 100.00% SANTA BARBARA: Orcutt(U) 32,094 100.00% SANTA BARBARA: Santa Barbara(C) 88,928 100.00% SANTA BARBARA: Santa Maria(C) 110,135 100.00% SANTA BARBARA: Santa Ynez(U) 4,512 100.00% SANTA BARBARA: Sisquoc(U) 191 100.00% SANTA BARBARA: Solvang(C) 6,135 100.00% SANTA BARBARA: Summerland(U) 1,224 100.00% SANTA BARBARA: Toro Canyon(U) 1,836 100.00% SANTA BARBARA: University of California-Santa Barbara(U) 9,715 100.00% SANTA BARBARA: Vandenberg AFB(U) 3,566 100.00% SANTA BARBARA: Vandenberg Village(U) 7,322 100.00% SANTA BARBARA: Remainder of Santa Barbara(R) 16,279 100.00% VENTURA: Mira Monte(U) 6,631 100.00% VENTURA: Oak View(U) 6,229 100.00% VENTURA: Ojai(C) 7,653 100.00% VENTURA: San Buenaventura (Ventura)(C) 111,008 100.00% VENTURA: Saticoy(U) 1,134 100.00% VENTURA: Remainder of Ventura(R) 2,537 6.87%
Senate Office of Demographics 02/2026