This Congressional district was established by the voters of California with the passage of Proposition 50 (2025) on November 4, 2025 and will go into effect after the November 2026 elections and upon seating of the 120th Congress, January 3, 2027. This district will stay in use until the California Citizens Redistricting Commission draws new maps following the 2030 U.S. Census .
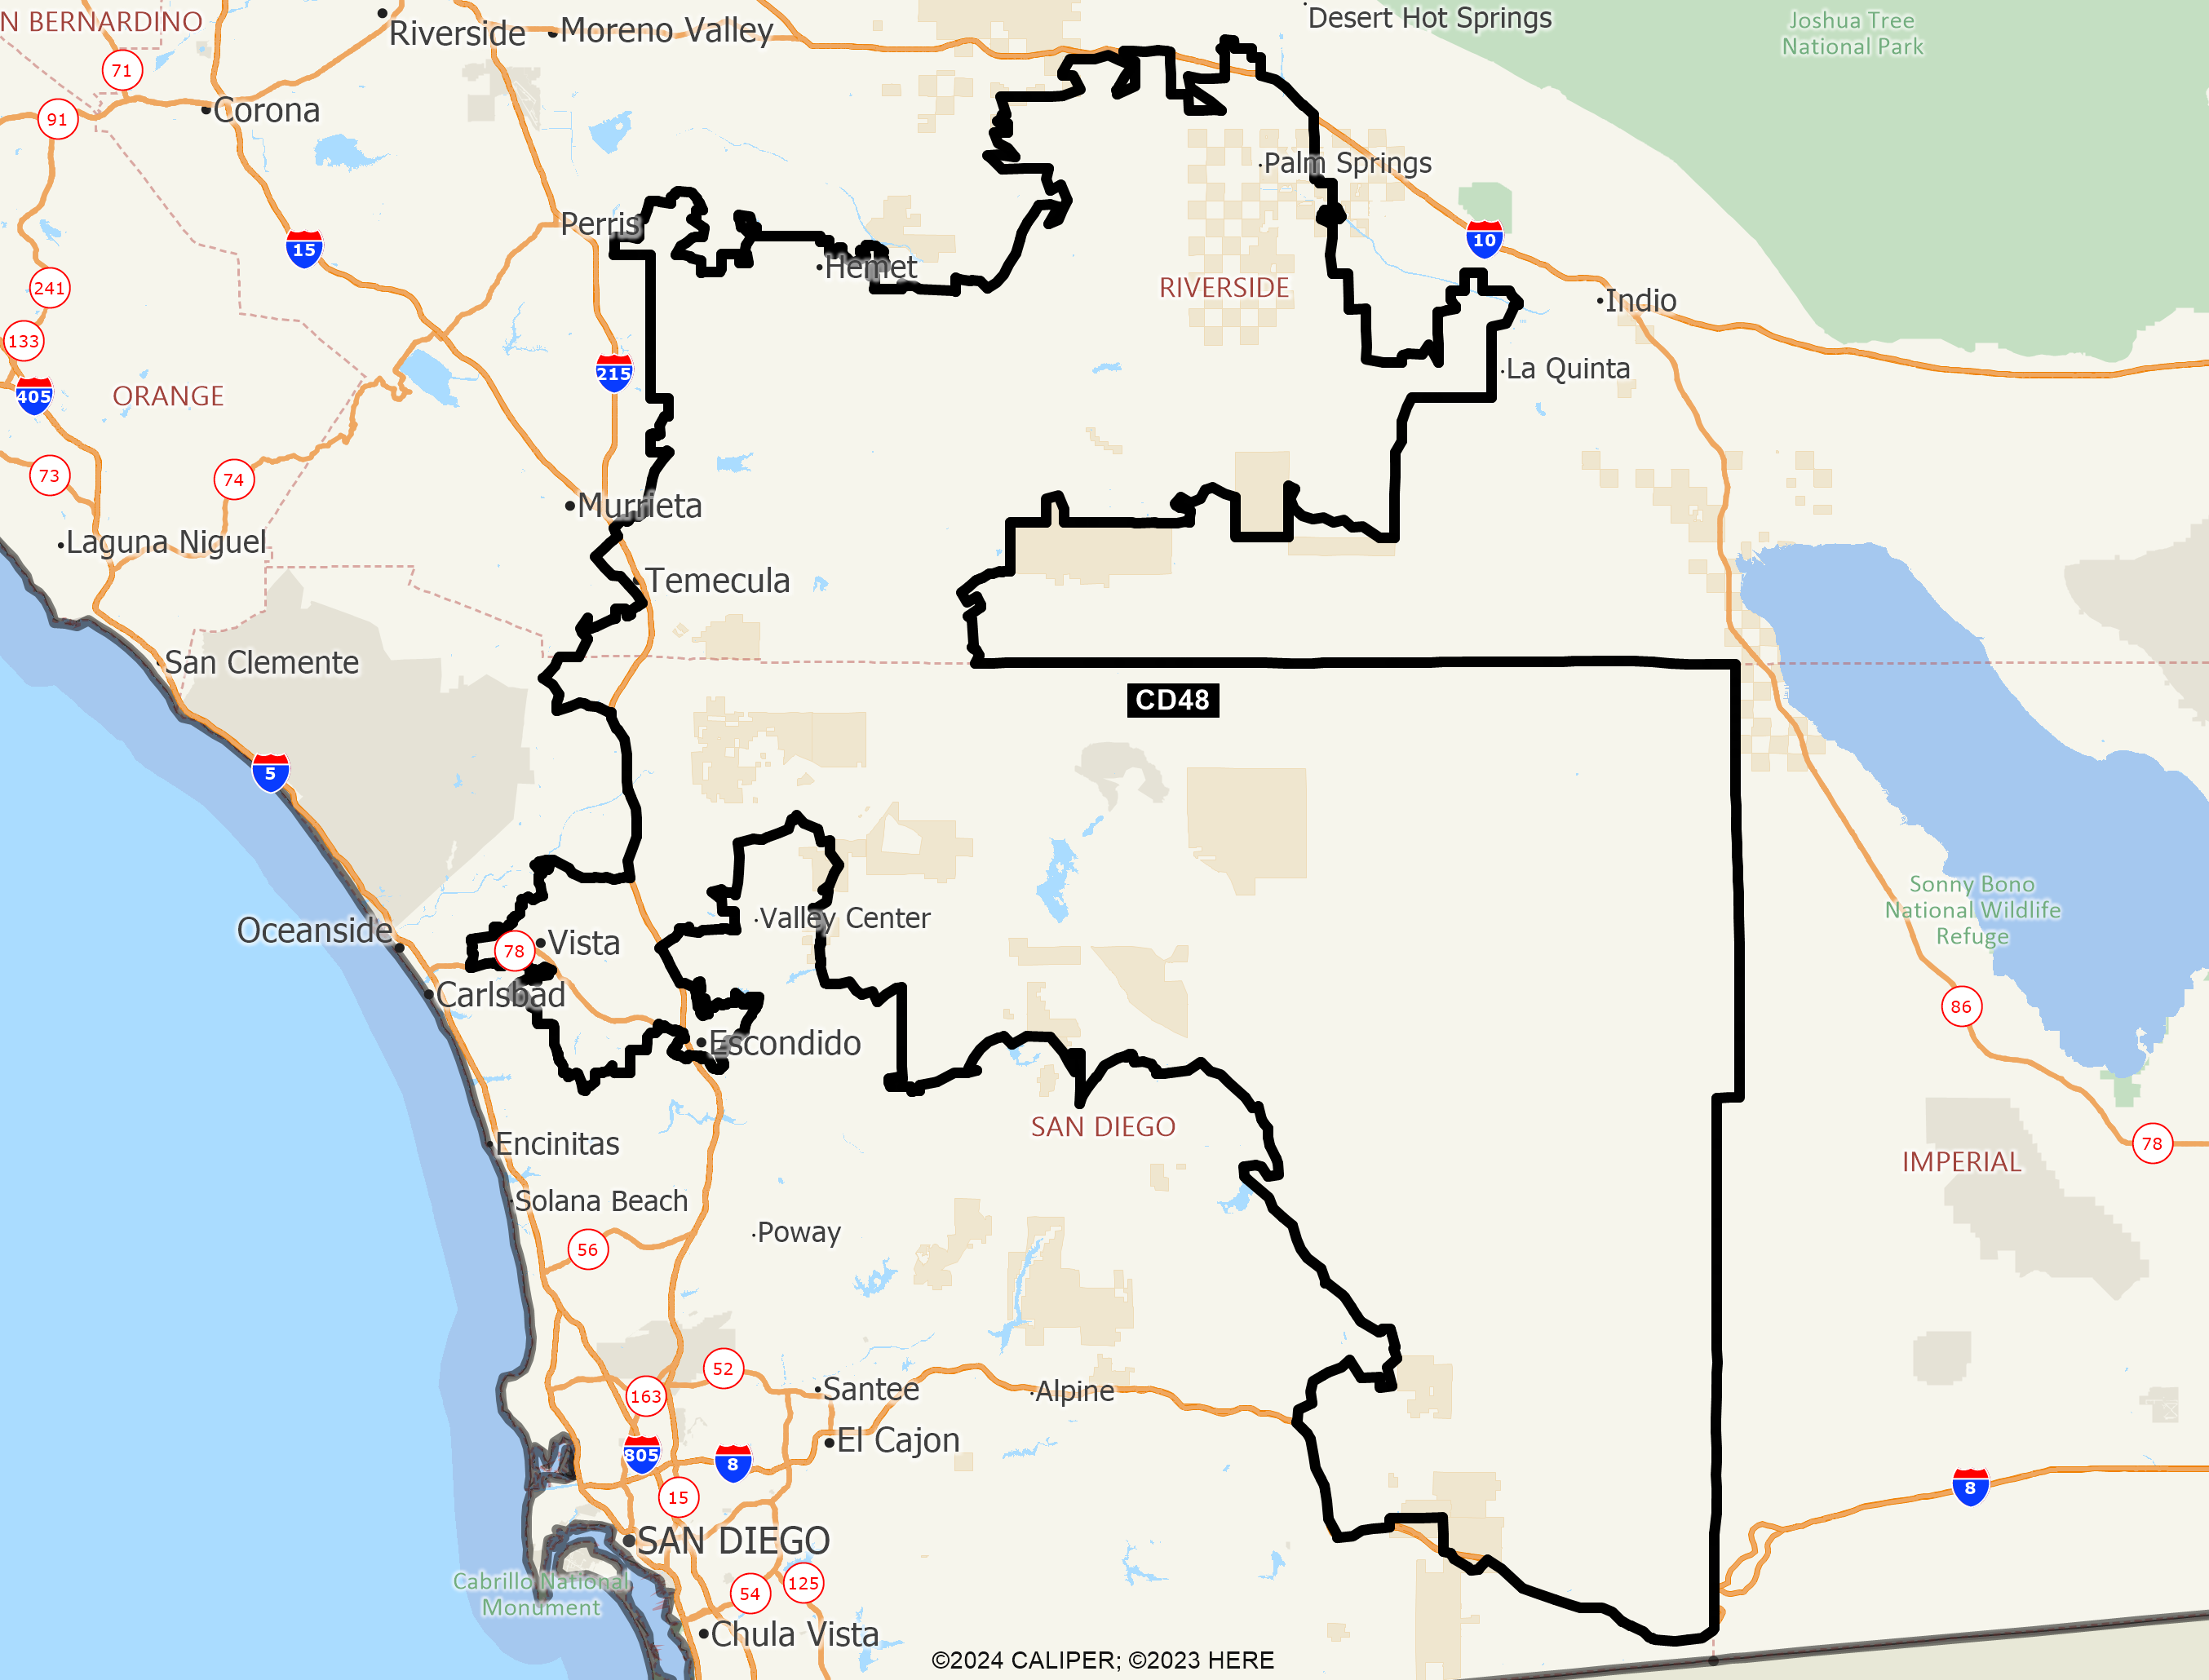
DISTRICT CD48
2020 Census Population (adj Elec. §21003 - SWDB 9/27/2021) Name Count Percent Total Population (POP) 760,066 100.00% POP Hispanic or Latino 304,909 40.12% POP Not Hispanic or Latino (NH) 455,157 59.88% POP NH Population of one race 420,659 55.35% POP NH White alone 325,779 42.86% POP NH Black or African American alone 29,370 3.86% POP NH Asian alone 52,867 6.96% POP NH American Indian and Alaska Native alone 6,012 0.79% POP NH Native Hawaiian and Other Pacific Islander alone 2,773 0.36% POP NH Some Other Race alone 3,858 0.51% POP NH Population of two or more races 34,498 4.54% POP DOJ NH Black or African American 34,485 4.54% POP DOJ NH Asian 64,049 8.43% POP DOJ NH American Indian and Alaska Native 12,327 1.62% POP DOJ NH Native Hawaiian and Other Pacific Islander 3,853 0.51% POP DOJ NH Some Other Race 8,562 1.13% POP DOJ NH Balance of Population of two or more races 6,102 0.80%
2020 Census Voting Age Population (adj Elec. §21003 - SWDB 9/27/2021) Name Count Percent Total Voting Age Population (VAP) 582,286 100.00% VAP Hispanic or Latino 209,404 35.96% VAP Not Hispanic or Latino (NH) 372,882 64.04% VAP NH Population of one race 350,804 60.25% VAP NH White alone 275,264 47.27% VAP NH Black or African American alone 22,934 3.94% VAP NH Asian alone 43,152 7.41% VAP NH American Indian and Alaska Native alone 4,435 0.76% VAP NH Native Hawaiian and Other Pacific Islander alone 2,249 0.39% VAP NH Some Other Race alone 2,770 0.48% VAP NH Population of two or more races 22,078 3.79% VAP DOJ NH Black or African American 25,720 4.42% VAP DOJ NH Asian 49,325 8.47% VAP DOJ NH American Indian and Alaska Native 9,464 1.63% VAP DOJ NH Native Hawaiian and Other Pacific Islander 2,958 0.51% VAP DOJ NH Some Other Race 6,261 1.08% VAP DOJ NH Balance of Population of two or more races 3,890 0.67%
2020 Census Housing Occupancy Status Name Count Percent Total Housing Units 289,864 100.00% Occupied 260,722 89.95% Vacant 29,142 10.05%
2020 Census Group Quarters Population (adj Elec. §21003 - SWDB 9/27/2021) Name Count Percent Total Group Quarters Population: 9,582 100.00% Institutionalized population: 3,976 41.49% Correctional facilities for adults 693 7.23% Juvenile facilities 176 1.84% Nursing facilities/Skilled-nursing facilities 3,065 31.99% Other institutional facilities 42 0.44% Noninstitutionalized population: 5,606 58.51% College/University student housing 1,815 18.94% Military quarters 0 0.00% Other noninstitutional facilities 3,791 39.56%
2019-2023 ACS Citizen Population (adj Elec. §21003 - SWDB 7/16/2025) Name Count Percent Total Citizen Population (CITZ) 695,975 100.00% CITZ Hispanic or Latino 259,744 37.32% CITZ Not Hispanic or Latino (NH) 436,242 62.68% CITZ NH White alone 322,301 46.31% CITZ NH Black or African American Alone 29,873 4.29% CITZ NH Asian Alone 46,159 6.63% CITZ NH American Indian and Alaska Native Alone 4,641 0.67% CITZ NH Native Hawaiian and Other Pacific Islander alone 3,200 0.46% CITZ NH Black or African American and White 5,806 0.83% CITZ NH American Indian or Alaska Native and White 12,183 1.75% CITZ NH Asian and White 4,420 0.64% CITZ NH American Indian or Alaska Native and Black or African American 636 0.09% CITZ NH Remainder of Two or More Race 6,771 0.97% CITZ DOJ NH Black or African American 35,679 5.13% CITZ DOJ NH Asian 58,342 8.38% CITZ DOJ NH American Indian and Alaska Native 9,061 1.30%
2019-2023 ACS Citizen Voting Age Population (adj Elec. §21003 - SWDB 7/16/2025) Name Count Percent Total Citizen Voting Age Population (CVAP) 518,620 100.00% CVAP Hispanic or Latino 166,118 32.03% CVAP Not Hispanic or Latino (NH) 352,377 67.95% CVAP NH White alone 268,028 51.68% CVAP NH Black or African American Alone 24,275 4.68% CVAP NH Asian Alone 36,945 7.12% CVAP NH American Indian and Alaska Native Alone 3,396 0.65% CVAP NH Native Hawaiian and Other Pacific Islander alone 2,282 0.44% CVAP NH Black or African American and White 3,298 0.64% CVAP NH Asian and White 6,404 1.23% CVAP NH American Indian or Alaska Native and White 3,090 0.60% CVAP NH American Indian or Alaska Native and Black or African American 571 0.11% CVAP NH Remainder of Two or More Race 3,931 0.76% CVAP DOJ NH Black or African American 27,573 5.32% CVAP DOJ NH Asian 43,349 8.36% CVAP DOJ NH American Indian and Alaska Native 6,486 1.25%
Counties In District Name Count Percent Riverside 366,026 15.14% San Diego 394,034 11.93%
Places In District Name Count Percent RIVERSIDE: Aguanga(U) 989 100.00% RIVERSIDE: Anza(U) 3,094 100.00% RIVERSIDE: East Hemet(U) 18,998 97.28% RIVERSIDE: French Valley(U) 35,324 100.00% RIVERSIDE: Green Acres(U) 2,933 100.00% RIVERSIDE: Hemet(C) 90,349 100.00% RIVERSIDE: Homeland(U) 6,801 100.00% RIVERSIDE: Idyllwild-Pine Cove(U) 4,170 100.00% RIVERSIDE: Indian Wells(C) 4,762 100.00% RIVERSIDE: Lake Riverside(U) 1,377 100.00% RIVERSIDE: Mountain Center(U) 66 100.00% RIVERSIDE: Palm Springs(C) 44,785 100.00% RIVERSIDE: Romoland(U) 1,192 59.27% RIVERSIDE: Sage(U) 3,381 100.00% RIVERSIDE: Temecula(C) 110,239 100.00% RIVERSIDE: Winchester(U) 3,083 100.00% RIVERSIDE: Remainder of Riverside(R) 34,483 44.37% SAN DIEGO: Borrego Springs(U) 3,076 100.00% SAN DIEGO: Escondido(C) 111,679 73.71% SAN DIEGO: Hidden Meadows(U) 4,493 100.00% SAN DIEGO: Lake San Marcos(U) 5,336 100.00% SAN DIEGO: Oceanside(C) 24,937 14.28% SAN DIEGO: Pala(U) 1,500 100.00% SAN DIEGO: Rainbow(U) 1,811 100.00% SAN DIEGO: San Marcos(C) 95,034 100.00% SAN DIEGO: Vista(C) 98,709 100.00% SAN DIEGO: Remainder of San Diego(R) 47,459 29.50%
Senate Office of Demographics 02/2026