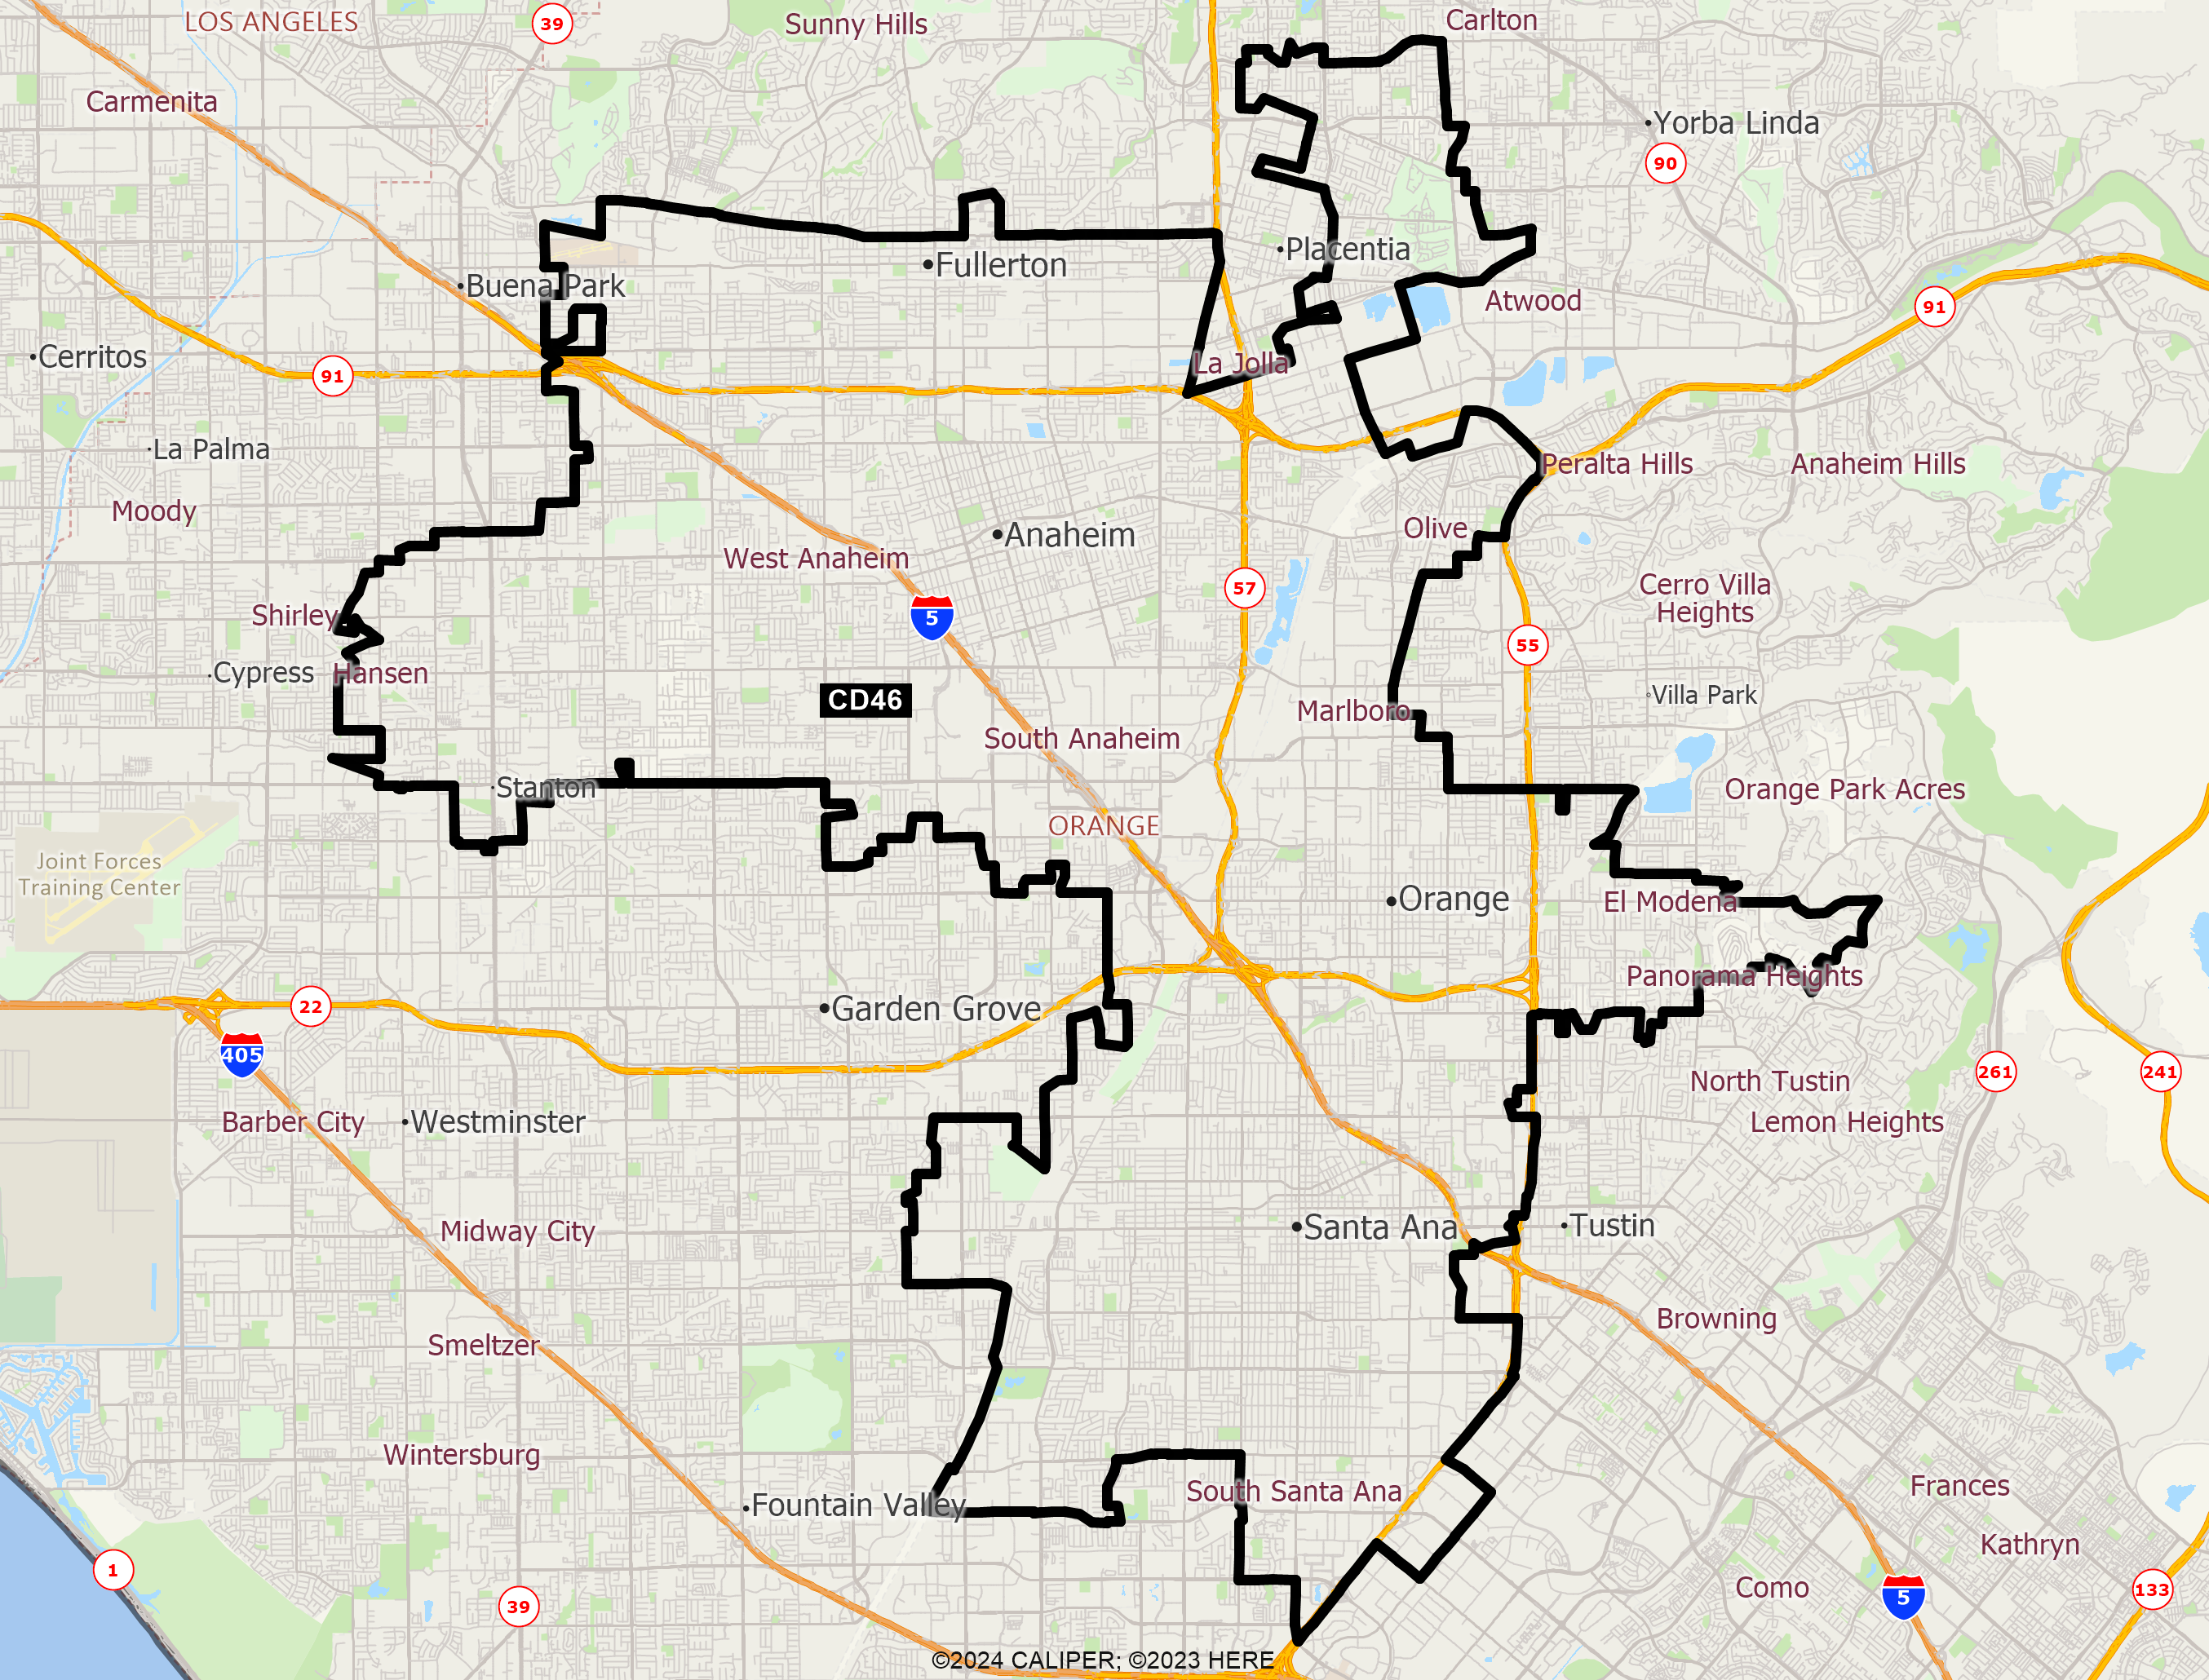
This Congressional district was established by the voters of California with the passage of Proposition 50 (2025) on November 4, 2025 and will go into effect after the November 2026 elections and upon seating of the 120th Congress, January 3, 2027. This district will stay in use until the California Citizens Redistricting Commission draws new maps following the 2030 U.S. Census .
DISTRICT CD46
2020 Census Population (adj Elec. §21003 - SWDB 9/27/2021) Name Count Percent Total Population (POP) 760,066 100.00% POP Hispanic or Latino 486,278 63.98% POP Not Hispanic or Latino (NH) 273,788 36.02% POP NH Population of one race 257,911 33.93% POP NH White alone 132,689 17.46% POP NH Black or African American alone 13,812 1.82% POP NH Asian alone 104,743 13.78% POP NH American Indian and Alaska Native alone 1,430 0.19% POP NH Native Hawaiian and Other Pacific Islander alone 2,228 0.29% POP NH Some Other Race alone 3,009 0.40% POP NH Population of two or more races 15,877 2.09% POP DOJ NH Black or African American 15,536 2.04% POP DOJ NH Asian 110,736 14.57% POP DOJ NH American Indian and Alaska Native 3,828 0.50% POP DOJ NH Native Hawaiian and Other Pacific Islander 2,744 0.36% POP DOJ NH Some Other Race 5,085 0.67% POP DOJ NH Balance of Population of two or more races 3,170 0.42%
2020 Census Voting Age Population (adj Elec. §21003 - SWDB 9/27/2021) Name Count Percent Total Voting Age Population (VAP) 582,211 100.00% VAP Hispanic or Latino 348,461 59.85% VAP Not Hispanic or Latino (NH) 233,750 40.15% VAP NH Population of one race 222,626 38.24% VAP NH White alone 117,365 20.16% VAP NH Black or African American alone 11,550 1.98% VAP NH Asian alone 88,659 15.23% VAP NH American Indian and Alaska Native alone 1,177 0.20% VAP NH Native Hawaiian and Other Pacific Islander alone 1,778 0.31% VAP NH Some Other Race alone 2,097 0.36% VAP NH Population of two or more races 11,124 1.91% VAP DOJ NH Black or African American 12,621 2.17% VAP DOJ NH Asian 92,445 15.88% VAP DOJ NH American Indian and Alaska Native 3,206 0.55% VAP DOJ NH Native Hawaiian and Other Pacific Islander 2,122 0.36% VAP DOJ NH Some Other Race 3,756 0.65% VAP DOJ NH Balance of Population of two or more races 2,235 0.38%
2020 Census Housing Occupancy Status Name Count Percent Total Housing Units 222,373 100.00% Occupied 213,599 96.05% Vacant 8,774 3.95%
2020 Census Group Quarters Population (adj Elec. §21003 - SWDB 9/27/2021) Name Count Percent Total Group Quarters Population: 17,415 100.00% Institutionalized population: 8,217 47.18% Correctional facilities for adults 5,712 32.80% Juvenile facilities 205 1.18% Nursing facilities/Skilled-nursing facilities 2,160 12.40% Other institutional facilities 140 0.80% Noninstitutionalized population: 9,198 52.82% College/University student housing 3,854 22.13% Military quarters 0 0.00% Other noninstitutional facilities 5,344 30.69%
2019-2023 ACS Citizen Population (adj Elec. §21003 - SWDB 7/16/2025) Name Count Percent Total Citizen Population (CITZ) 614,488 100.00% CITZ Hispanic or Latino 364,602 59.33% CITZ Not Hispanic or Latino (NH) 249,746 40.64% CITZ NH White alone 130,090 21.17% CITZ NH Black or African American Alone 12,191 1.98% CITZ NH Asian Alone 90,252 14.69% CITZ NH American Indian and Alaska Native Alone 1,025 0.17% CITZ NH Native Hawaiian and Other Pacific Islander alone 2,396 0.39% CITZ NH Black or African American and White 2,323 0.38% CITZ NH American Indian or Alaska Native and White 7,262 1.18% CITZ NH Asian and White 1,647 0.27% CITZ NH American Indian or Alaska Native and Black or African American 122 0.02% CITZ NH Remainder of Two or More Race 2,452 0.40% CITZ DOJ NH Black or African American 14,514 2.36% CITZ DOJ NH Asian 97,514 15.87% CITZ DOJ NH American Indian and Alaska Native 2,672 0.43%
2019-2023 ACS Citizen Voting Age Population (adj Elec. §21003 - SWDB 7/16/2025) Name Count Percent Total Citizen Voting Age Population (CVAP) 446,787 100.00% CVAP Hispanic or Latino 235,309 52.67% CVAP Not Hispanic or Latino (NH) 211,265 47.29% CVAP NH White alone 114,678 25.67% CVAP NH Black or African American Alone 9,926 2.22% CVAP NH Asian Alone 75,330 16.86% CVAP NH American Indian and Alaska Native Alone 766 0.17% CVAP NH Native Hawaiian and Other Pacific Islander alone 1,876 0.42% CVAP NH Black or African American and White 1,419 0.32% CVAP NH Asian and White 3,944 0.88% CVAP NH American Indian or Alaska Native and White 1,365 0.31% CVAP NH American Indian or Alaska Native and Black or African American 81 0.02% CVAP NH Remainder of Two or More Race 1,864 0.42% CVAP DOJ NH Black or African American 11,345 2.54% CVAP DOJ NH Asian 79,274 17.74% CVAP DOJ NH American Indian and Alaska Native 2,131 0.48%
Counties In District Name Count Percent Orange 760,068 23.80%
Places In District Name Count Percent ORANGE: Anaheim(C) 290,993 83.68% ORANGE: Fullerton(C) 61,113 42.46% ORANGE: North Tustin(U) 362 1.41% ORANGE: Orange(C) 87,918 62.71% ORANGE: Placentia(C) 22,481 43.29% ORANGE: Santa Ana(C) 256,904 82.50% ORANGE: Stanton(C) 24,809 65.17% ORANGE: Remainder of Orange(R) 15,488 55.63%
Senate Office of Demographics 02/2026