This Congressional district was established by the voters of California with the passage of Proposition 50 (2025) on November 4, 2025 and will go into effect after the November 2026 elections and upon seating of the 120th Congress, January 3, 2027. This district will stay in use until the California Citizens Redistricting Commission draws new maps following the 2030 U.S. Census .
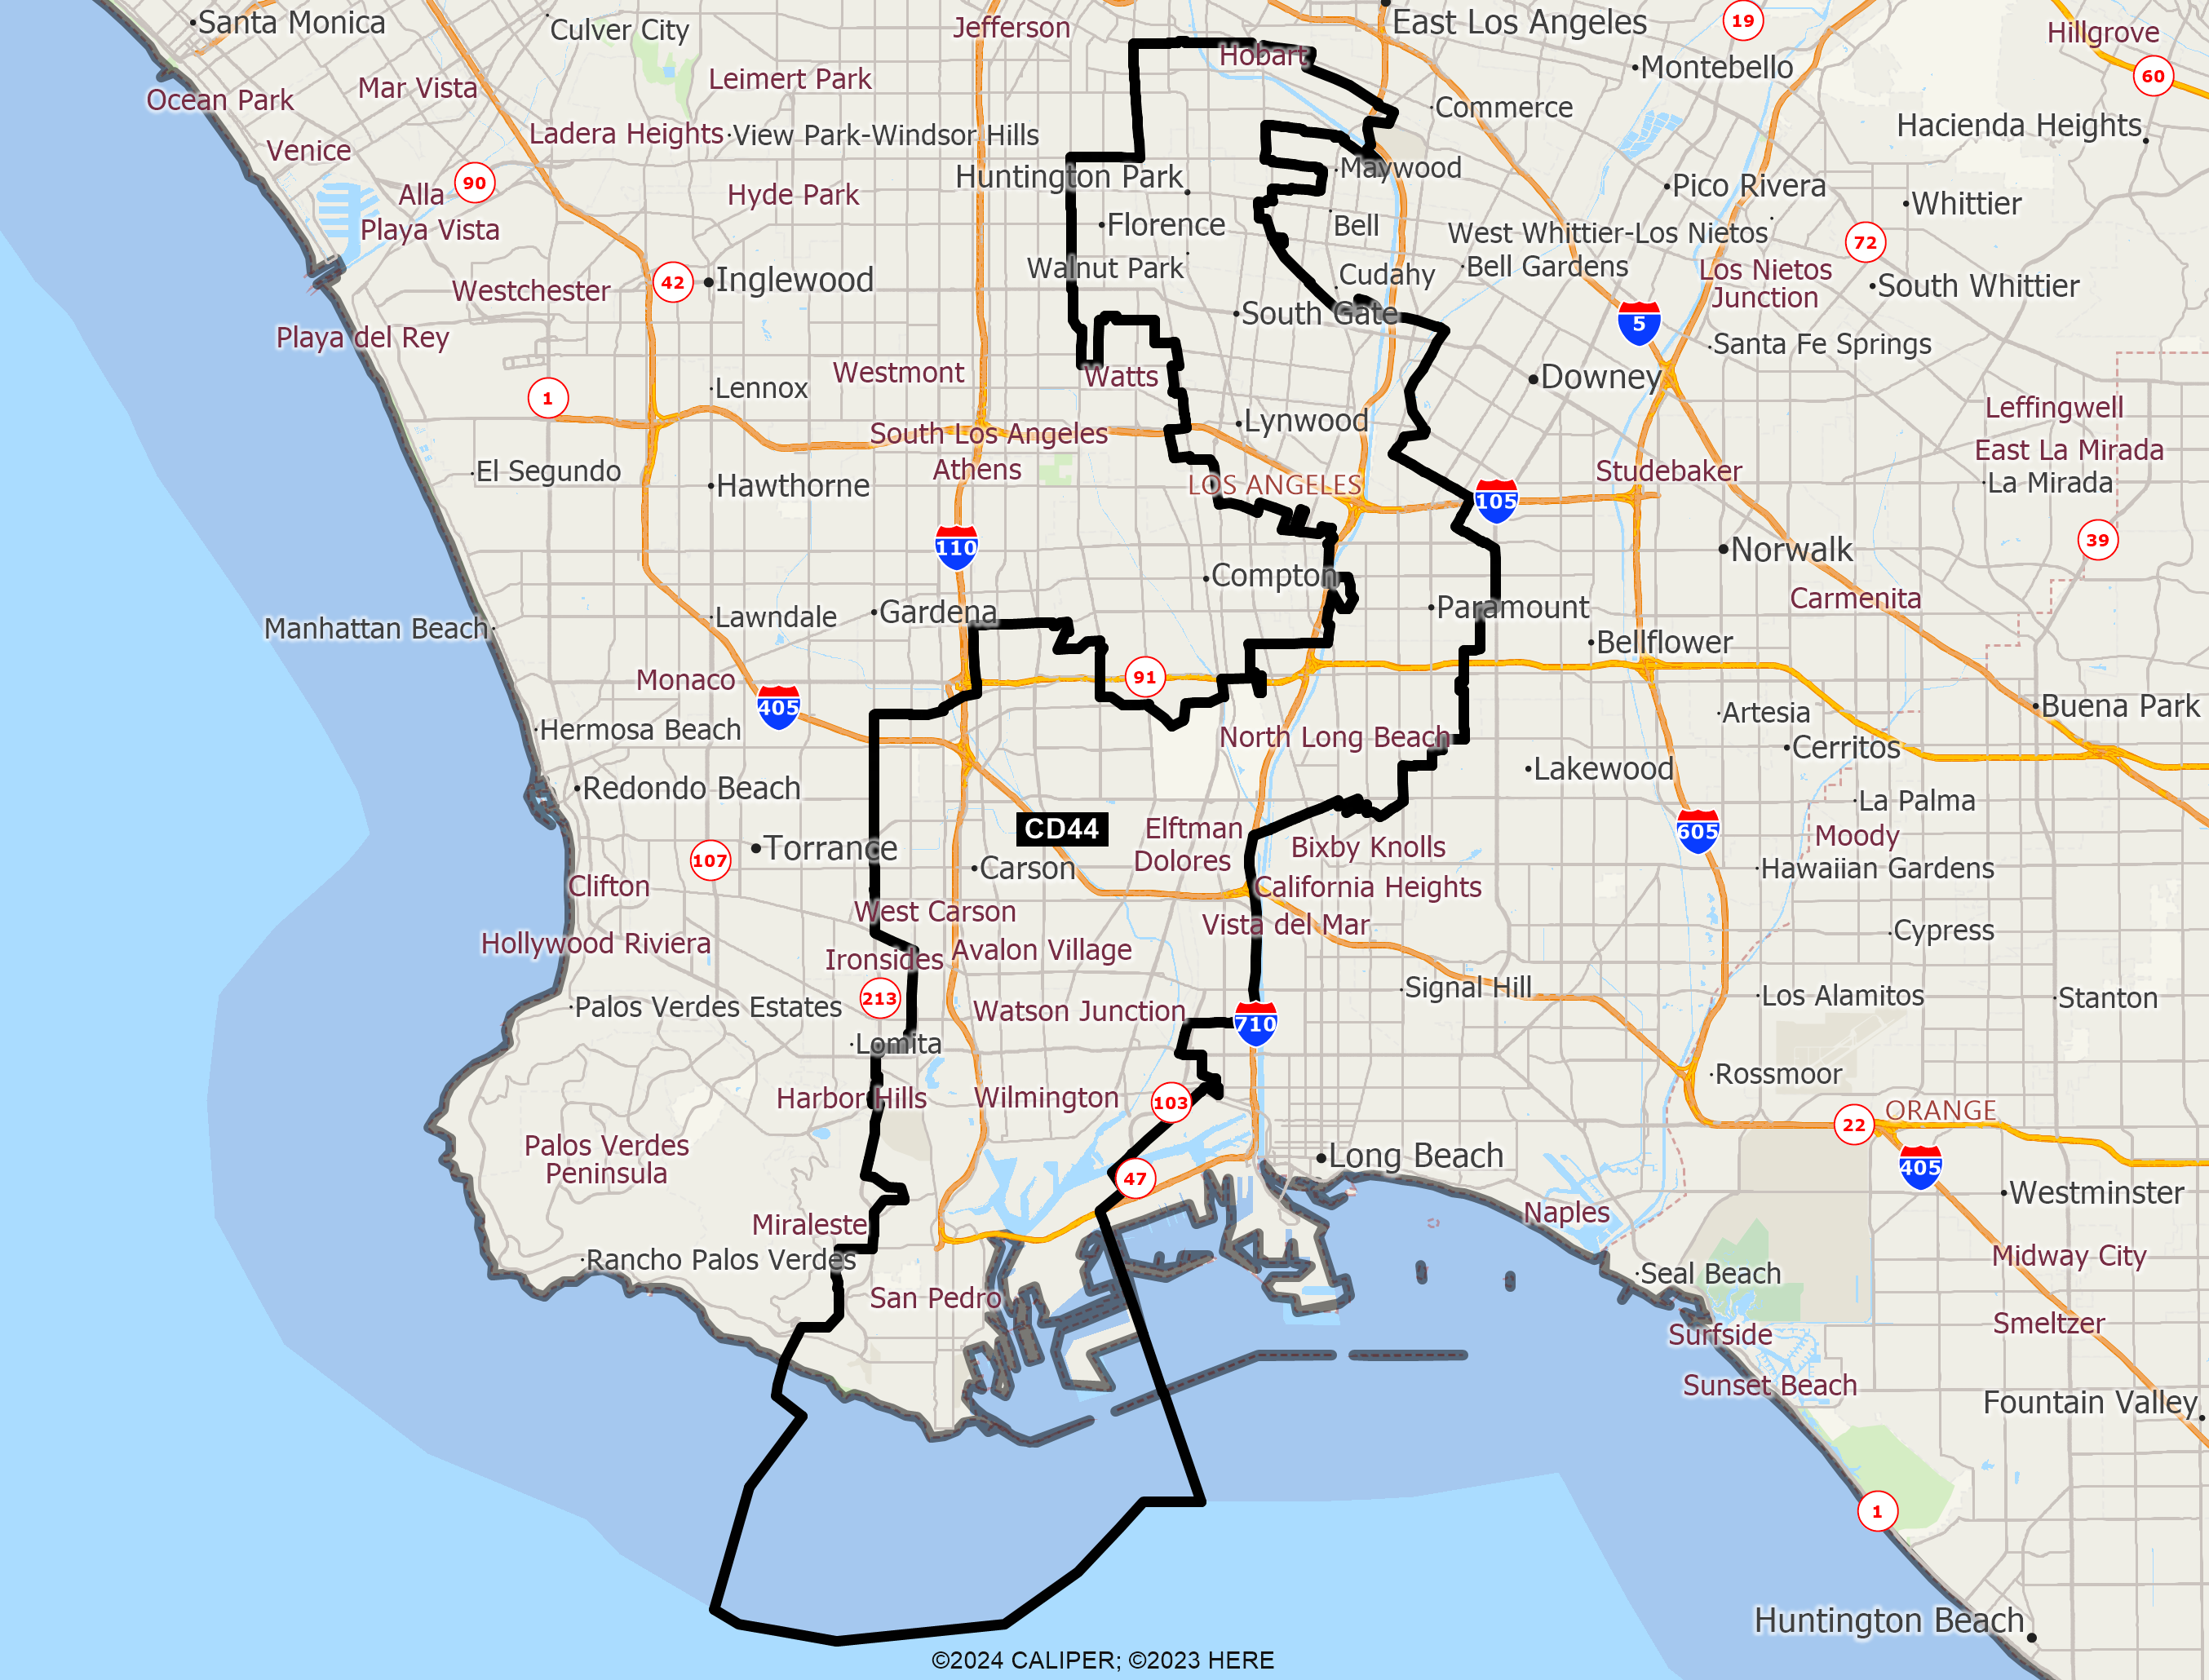
DISTRICT CD44
2020 Census Population (adj Elec. §21003 - SWDB 9/27/2021) Name Count Percent Total Population (POP) 760,067 100.00% POP Hispanic or Latino 535,795 70.49% POP Not Hispanic or Latino (NH) 224,272 29.51% POP NH Population of one race 210,276 27.67% POP NH White alone 60,389 7.95% POP NH Black or African American alone 71,568 9.42% POP NH Asian alone 67,863 8.93% POP NH American Indian and Alaska Native alone 1,310 0.17% POP NH Native Hawaiian and Other Pacific Islander alone 5,381 0.71% POP NH Some Other Race alone 3,765 0.50% POP NH Population of two or more races 13,996 1.84% POP DOJ NH Black or African American 73,898 9.72% POP DOJ NH Asian 71,219 9.37% POP DOJ NH American Indian and Alaska Native 2,540 0.33% POP DOJ NH Native Hawaiian and Other Pacific Islander 5,818 0.77% POP DOJ NH Some Other Race 4,855 0.64% POP DOJ NH Balance of Population of two or more races 5,553 0.73%
2020 Census Voting Age Population (adj Elec. §21003 - SWDB 9/27/2021) Name Count Percent Total Voting Age Population (VAP) 579,636 100.00% VAP Hispanic or Latino 392,684 67.75% VAP Not Hispanic or Latino (NH) 186,952 32.25% VAP NH Population of one race 177,016 30.54% VAP NH White alone 53,736 9.27% VAP NH Black or African American alone 57,148 9.86% VAP NH Asian alone 58,292 10.06% VAP NH American Indian and Alaska Native alone 1,119 0.19% VAP NH Native Hawaiian and Other Pacific Islander alone 4,212 0.73% VAP NH Some Other Race alone 2,509 0.43% VAP NH Population of two or more races 9,936 1.71% VAP DOJ NH Black or African American 58,682 10.12% VAP DOJ NH Asian 60,555 10.45% VAP DOJ NH American Indian and Alaska Native 2,152 0.37% VAP DOJ NH Native Hawaiian and Other Pacific Islander 4,538 0.78% VAP DOJ NH Some Other Race 3,360 0.58% VAP DOJ NH Balance of Population of two or more races 3,929 0.68%
2020 Census Housing Occupancy Status Name Count Percent Total Housing Units 222,697 100.00% Occupied 216,330 97.14% Vacant 6,367 2.86%
2020 Census Group Quarters Population (adj Elec. §21003 - SWDB 9/27/2021) Name Count Percent Total Group Quarters Population: 12,868 100.00% Institutionalized population: 4,615 35.86% Correctional facilities for adults 1,605 12.47% Juvenile facilities 97 0.75% Nursing facilities/Skilled-nursing facilities 2,453 19.06% Other institutional facilities 460 3.57% Noninstitutionalized population: 8,253 64.14% College/University student housing 938 7.29% Military quarters 63 0.49% Other noninstitutional facilities 7,252 56.36%
2019-2023 ACS Citizen Population (adj Elec. §21003 - SWDB 7/16/2025) Name Count Percent Total Citizen Population (CITZ) 611,707 100.00% CITZ Hispanic or Latino 410,534 67.11% CITZ Not Hispanic or Latino (NH) 201,232 32.90% CITZ NH White alone 58,347 9.54% CITZ NH Black or African American Alone 67,410 11.02% CITZ NH Asian Alone 57,624 9.42% CITZ NH American Indian and Alaska Native Alone 731 0.12% CITZ NH Native Hawaiian and Other Pacific Islander alone 3,427 0.56% CITZ NH Black or African American and White 2,767 0.45% CITZ NH American Indian or Alaska Native and White 3,684 0.60% CITZ NH Asian and White 1,242 0.20% CITZ NH American Indian or Alaska Native and Black or African American 943 0.15% CITZ NH Remainder of Two or More Race 4,992 0.82% CITZ DOJ NH Black or African American 70,177 11.47% CITZ DOJ NH Asian 61,308 10.02% CITZ DOJ NH American Indian and Alaska Native 1,973 0.32%
2019-2023 ACS Citizen Voting Age Population (adj Elec. §21003 - SWDB 7/16/2025) Name Count Percent Total Citizen Voting Age Population (CVAP) 437,942 100.00% CVAP Hispanic or Latino 272,815 62.29% CVAP Not Hispanic or Latino (NH) 165,144 37.71% CVAP NH White alone 51,362 11.73% CVAP NH Black or African American Alone 53,876 12.30% CVAP NH Asian Alone 47,652 10.88% CVAP NH American Indian and Alaska Native Alone 636 0.15% CVAP NH Native Hawaiian and Other Pacific Islander alone 3,015 0.69% CVAP NH Black or African American and White 1,776 0.41% CVAP NH Asian and White 2,125 0.49% CVAP NH American Indian or Alaska Native and White 987 0.23% CVAP NH American Indian or Alaska Native and Black or African American 684 0.16% CVAP NH Remainder of Two or More Race 2,957 0.68% CVAP DOJ NH Black or African American 55,652 12.71% CVAP DOJ NH Asian 49,777 11.37% CVAP DOJ NH American Indian and Alaska Native 1,623 0.37%
Counties In District Name Count Percent Los Angeles 760,070 7.56%
Places In District Name Count Percent LOS ANGELES: Carson(C) 95,995 100.00% LOS ANGELES: Florence-Graham(U) 62,456 100.00% LOS ANGELES: Huntington Park(C) 55,140 100.00% LOS ANGELES: Long Beach(C) 118,965 25.37% LOS ANGELES: Los Angeles(C) 169,238 4.33% LOS ANGELES: Lynwood(C) 67,621 100.00% LOS ANGELES: Paramount(C) 54,003 100.00% LOS ANGELES: South Gate(C) 93,114 100.00% LOS ANGELES: Vernon(C) 226 100.00% LOS ANGELES: Walnut Park(U) 15,288 100.00% LOS ANGELES: West Carson(U) 22,940 100.00% LOS ANGELES: Remainder of Los Angeles(R) 5,084 5.80%
Senate Office of Demographics 02/2026