This Congressional district was established by the voters of California with the passage of Proposition 50 (2025) on November 4, 2025 and will go into effect after the November 2026 elections and upon seating of the 120th Congress, January 3, 2027. This district will stay in use until the California Citizens Redistricting Commission draws new maps following the 2030 U.S. Census .
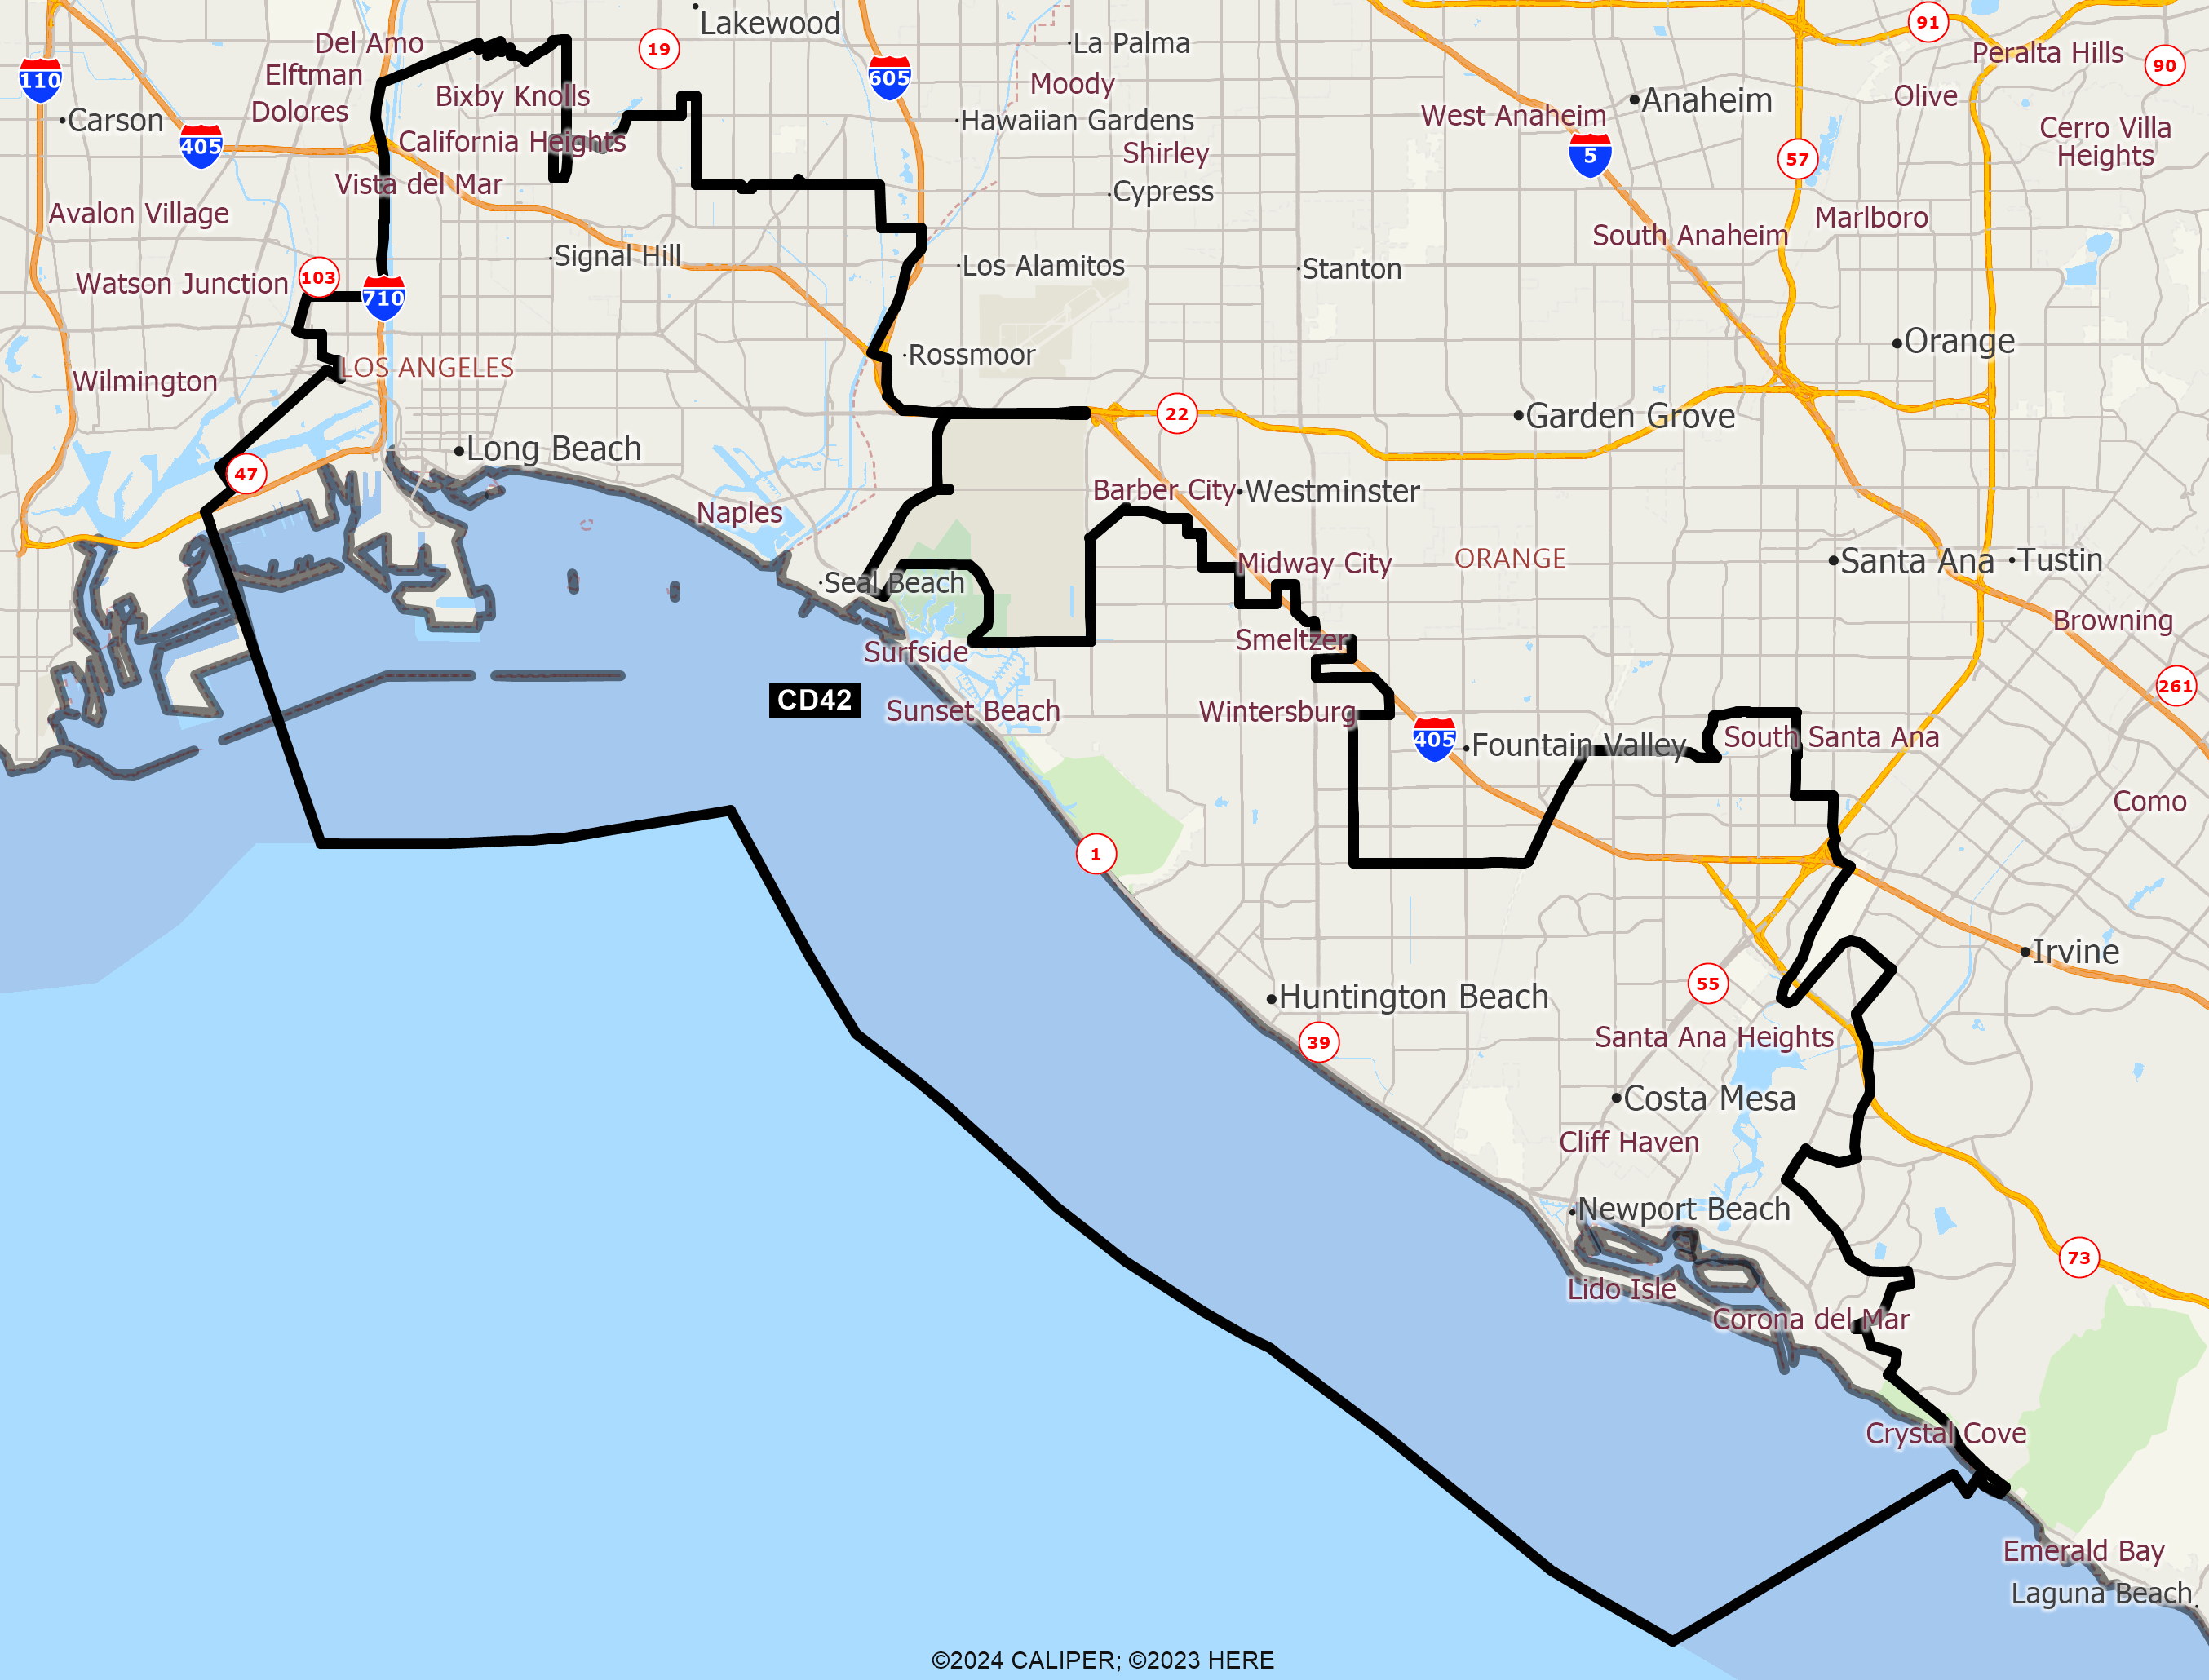
Congressional District 42 includes the Santa Catalina and San Clamente Islands not shown here
DISTRICT CD42
2020 Census Population (adj Elec. §21003 - SWDB 9/27/2021) Name Count Percent Total Population (POP) 760,067 100.00% POP Hispanic or Latino 240,878 31.69% POP Not Hispanic or Latino (NH) 519,189 68.31% POP NH Population of one race 482,949 63.54% POP NH White alone 343,883 45.24% POP NH Black or African American alone 41,828 5.50% POP NH Asian alone 88,034 11.58% POP NH American Indian and Alaska Native alone 1,733 0.23% POP NH Native Hawaiian and Other Pacific Islander alone 2,904 0.38% POP NH Some Other Race alone 4,567 0.60% POP NH Population of two or more races 36,240 4.77% POP DOJ NH Black or African American 46,450 6.11% POP DOJ NH Asian 101,566 13.36% POP DOJ NH American Indian and Alaska Native 7,003 0.92% POP DOJ NH Native Hawaiian and Other Pacific Islander 4,012 0.53% POP DOJ NH Some Other Race 9,887 1.30% POP DOJ NH Balance of Population of two or more races 6,388 0.84%
2020 Census Voting Age Population (adj Elec. §21003 - SWDB 9/27/2021) Name Count Percent Total Voting Age Population (VAP) 622,608 100.00% VAP Hispanic or Latino 177,727 28.55% VAP Not Hispanic or Latino (NH) 444,881 71.45% VAP NH Population of one race 419,825 67.43% VAP NH White alone 301,853 48.48% VAP NH Black or African American alone 34,523 5.54% VAP NH Asian alone 75,872 12.19% VAP NH American Indian and Alaska Native alone 1,548 0.25% VAP NH Native Hawaiian and Other Pacific Islander alone 2,417 0.39% VAP NH Some Other Race alone 3,612 0.58% VAP NH Population of two or more races 25,056 4.02% VAP DOJ NH Black or African American 37,661 6.05% VAP DOJ NH Asian 83,845 13.47% VAP DOJ NH American Indian and Alaska Native 6,017 0.97% VAP DOJ NH Native Hawaiian and Other Pacific Islander 3,220 0.52% VAP DOJ NH Some Other Race 7,897 1.27% VAP DOJ NH Balance of Population of two or more races 4,388 0.70%
2020 Census Housing Occupancy Status Name Count Percent Total Housing Units 324,816 100.00% Occupied 303,291 93.37% Vacant 21,525 6.63%
2020 Census Group Quarters Population (adj Elec. §21003 - SWDB 9/27/2021) Name Count Percent Total Group Quarters Population: 15,468 100.00% Institutionalized population: 4,517 29.20% Correctional facilities for adults 31 0.20% Juvenile facilities 330 2.13% Nursing facilities/Skilled-nursing facilities 3,602 23.29% Other institutional facilities 554 3.58% Noninstitutionalized population: 10,951 70.80% College/University student housing 2,899 18.74% Military quarters 160 1.03% Other noninstitutional facilities 7,892 51.02%
2019-2023 ACS Citizen Population (adj Elec. §21003 - SWDB 7/16/2025) Name Count Percent Total Citizen Population (CITZ) 679,669 100.00% CITZ Hispanic or Latino 193,121 28.41% CITZ Not Hispanic or Latino (NH) 486,612 71.60% CITZ NH White alone 340,674 50.12% CITZ NH Black or African American Alone 39,174 5.76% CITZ NH Asian Alone 73,913 10.87% CITZ NH American Indian and Alaska Native Alone 1,714 0.25% CITZ NH Native Hawaiian and Other Pacific Islander alone 2,458 0.36% CITZ NH Black or African American and White 5,068 0.75% CITZ NH American Indian or Alaska Native and White 13,587 2.00% CITZ NH Asian and White 3,288 0.48% CITZ NH American Indian or Alaska Native and Black or African American 777 0.11% CITZ NH Remainder of Two or More Race 5,897 0.87% CITZ DOJ NH Black or African American 44,242 6.51% CITZ DOJ NH Asian 87,500 12.87% CITZ DOJ NH American Indian and Alaska Native 5,002 0.74%
2019-2023 ACS Citizen Voting Age Population (adj Elec. §21003 - SWDB 7/16/2025) Name Count Percent Total Citizen Voting Age Population (CVAP) 547,320 100.00% CVAP Hispanic or Latino 134,603 24.59% CVAP Not Hispanic or Latino (NH) 412,782 75.42% CVAP NH White alone 295,693 54.03% CVAP NH Black or African American Alone 33,002 6.03% CVAP NH Asian Alone 62,887 11.49% CVAP NH American Indian and Alaska Native Alone 1,557 0.28% CVAP NH Native Hawaiian and Other Pacific Islander alone 2,029 0.37% CVAP NH Black or African American and White 3,073 0.56% CVAP NH Asian and White 6,949 1.27% CVAP NH American Indian or Alaska Native and White 2,790 0.51% CVAP NH American Indian or Alaska Native and Black or African American 767 0.14% CVAP NH Remainder of Two or More Race 3,906 0.71% CVAP DOJ NH Black or African American 36,075 6.59% CVAP DOJ NH Asian 69,836 12.76% CVAP DOJ NH American Indian and Alaska Native 4,347 0.79%
Counties In District Name Count Percent Los Angeles 335,486 3.34% Orange 424,577 13.30%
Places In District Name Count Percent LOS ANGELES: Avalon(C) 3,467 100.00% LOS ANGELES: Long Beach(C) 319,693 68.18% LOS ANGELES: Signal Hill(C) 11,911 100.00% LOS ANGELES: Remainder of Los Angeles(R) 415 0.47% ORANGE: Costa Mesa(C) 112,137 100.00% ORANGE: Huntington Beach(C) 199,030 100.00% ORANGE: Newport Beach(C) 63,229 74.09% ORANGE: Santa Ana(C) 30,643 9.84% ORANGE: Seal Beach(C) 18,578 73.48% ORANGE: Remainder of Orange(R) 960 3.45%
Senate Office of Demographics 02/2026