This Congressional district was established by the voters of California with the passage of Proposition 50 (2025) on November 4, 2025 and will go into effect after the November 2026 elections and upon seating of the 120th Congress, January 3, 2027. This district will stay in use until the California Citizens Redistricting Commission draws new maps following the 2030 U.S. Census .
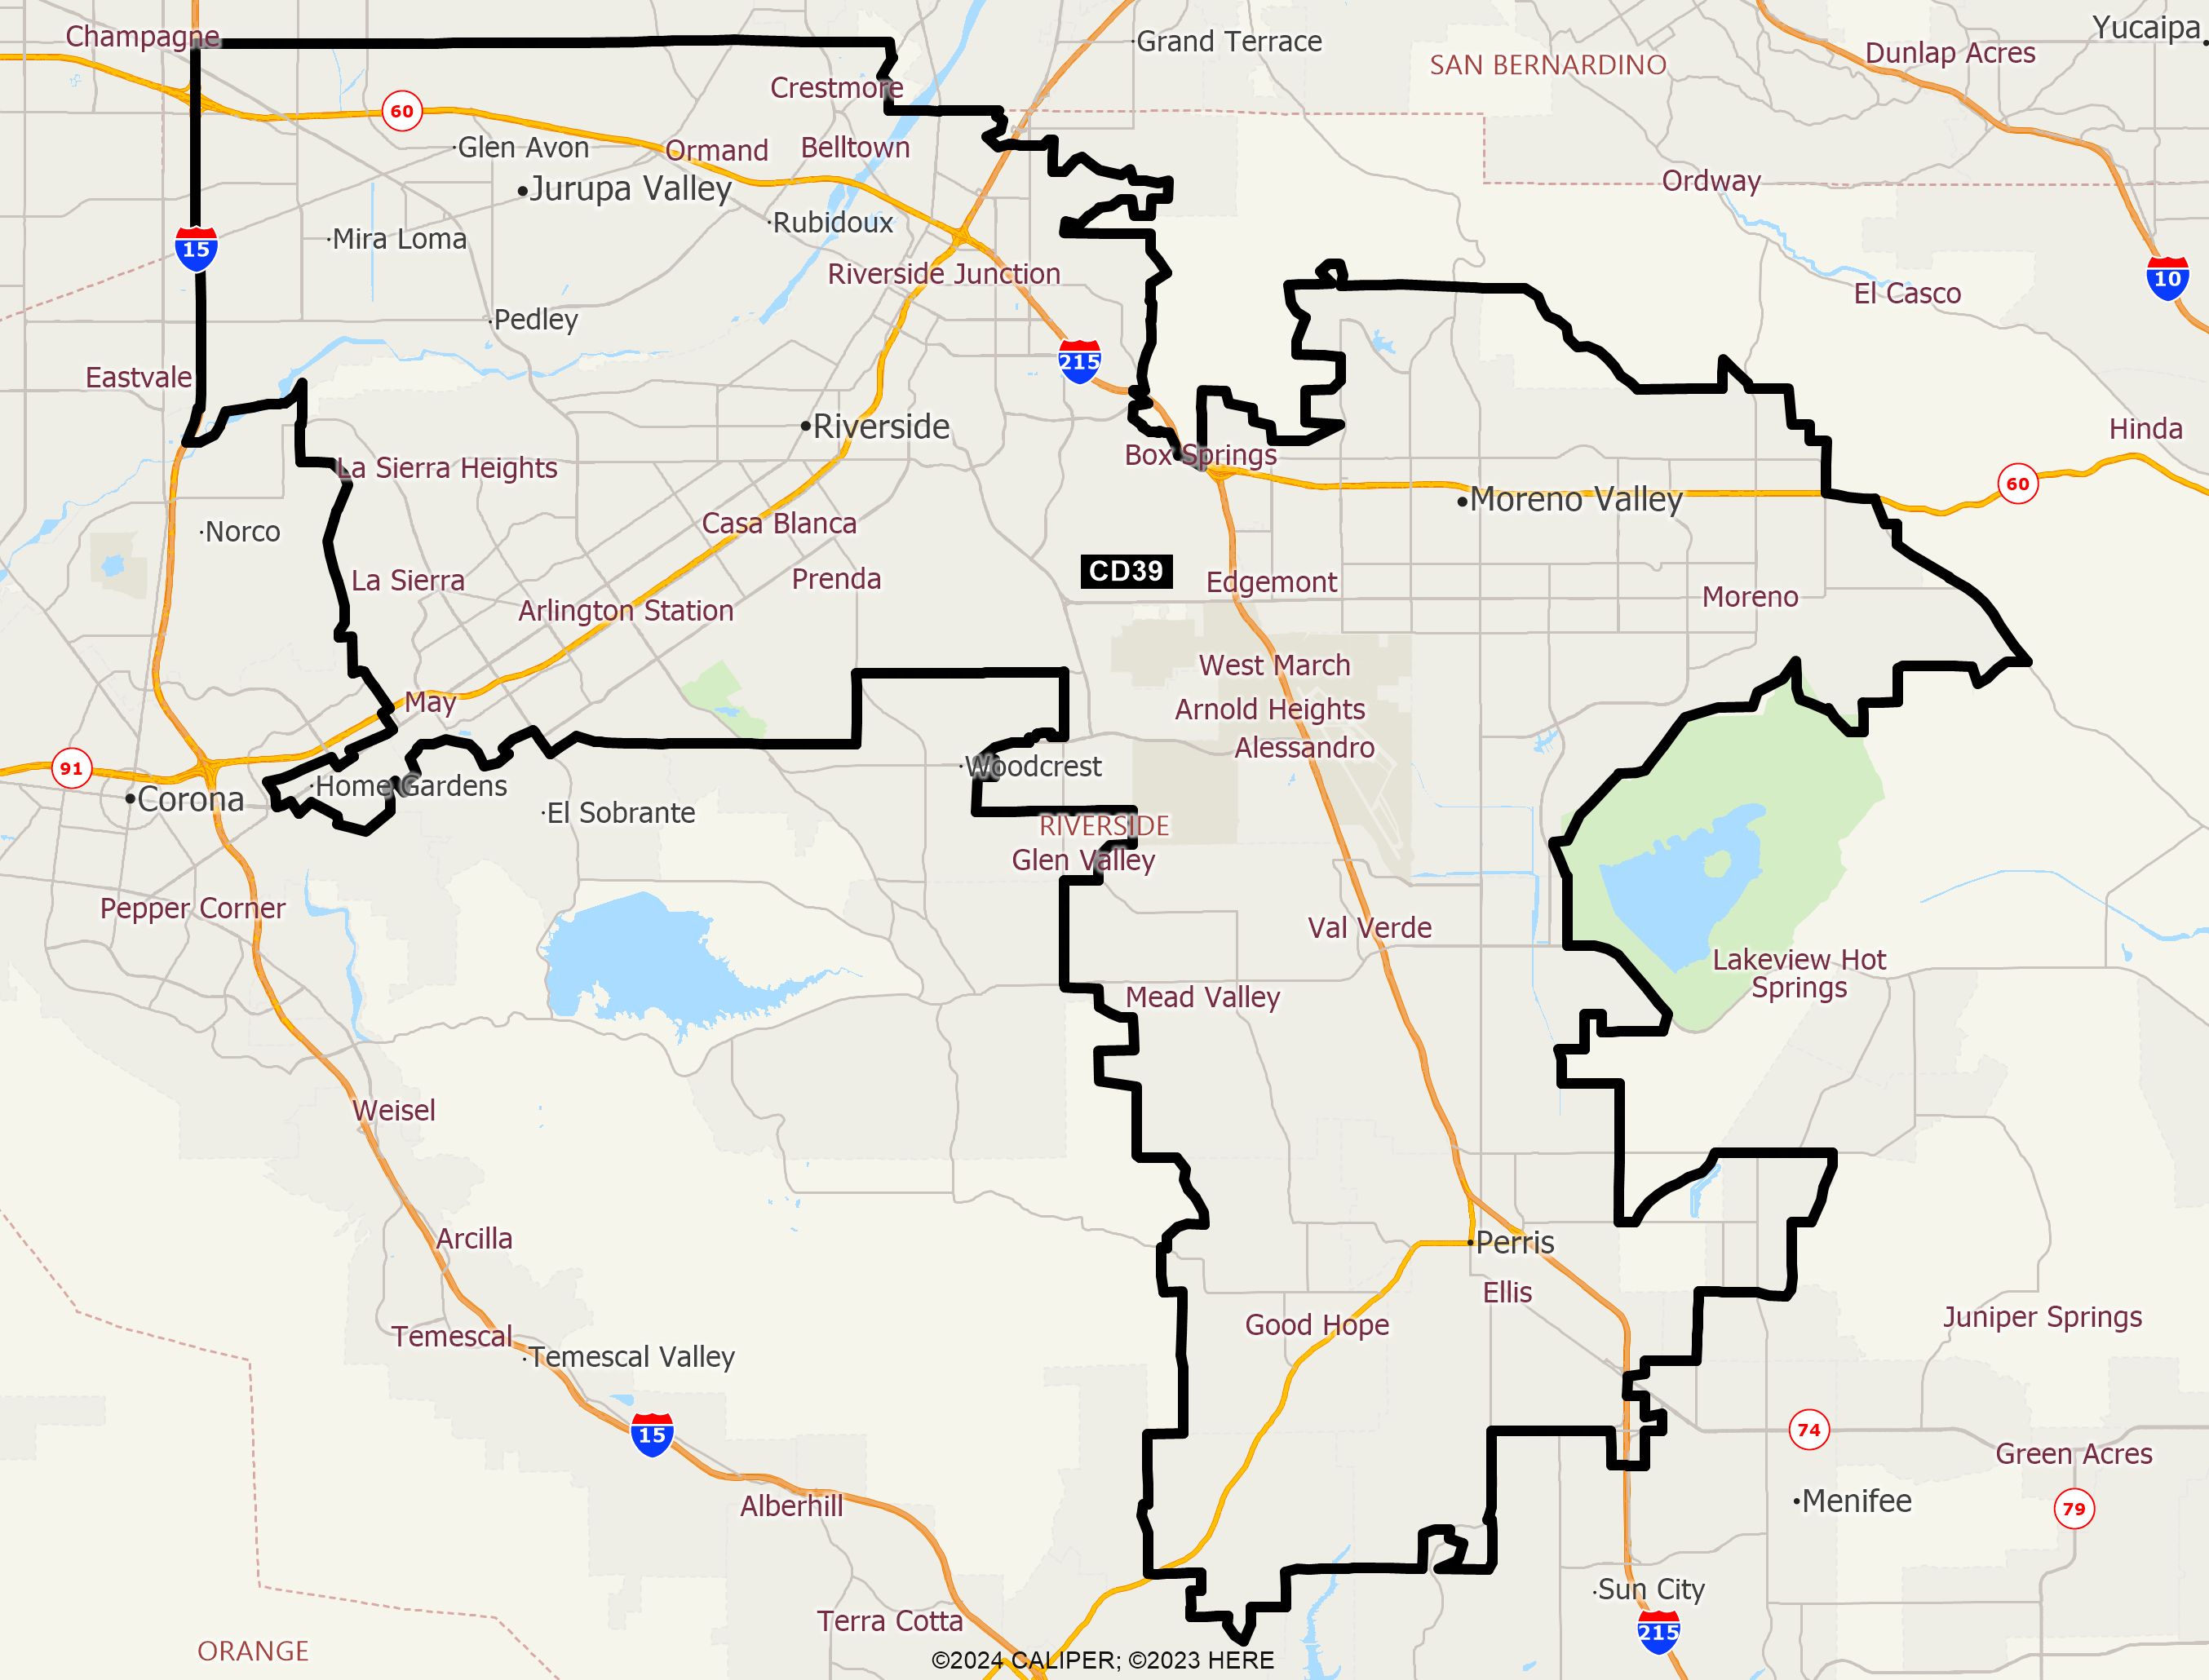
DISTRICT CD39
2020 Census Population (adj Elec. §21003 - SWDB 9/27/2021) Name Count Percent Total Population (POP) 760,067 100.00% POP Hispanic or Latino 473,263 62.27% POP Not Hispanic or Latino (NH) 286,804 37.73% POP NH Population of one race 265,835 34.98% POP NH White alone 148,509 19.54% POP NH Black or African American alone 64,448 8.48% POP NH Asian alone 43,859 5.77% POP NH American Indian and Alaska Native alone 2,338 0.31% POP NH Native Hawaiian and Other Pacific Islander alone 2,499 0.33% POP NH Some Other Race alone 4,182 0.55% POP NH Population of two or more races 20,969 2.76% POP DOJ NH Black or African American 68,981 9.08% POP DOJ NH Asian 48,532 6.39% POP DOJ NH American Indian and Alaska Native 5,735 0.75% POP DOJ NH Native Hawaiian and Other Pacific Islander 2,981 0.39% POP DOJ NH Some Other Race 6,449 0.85% POP DOJ NH Balance of Population of two or more races 5,617 0.74%
2020 Census Voting Age Population (adj Elec. §21003 - SWDB 9/27/2021) Name Count Percent Total Voting Age Population (VAP) 564,428 100.00% VAP Hispanic or Latino 330,111 58.49% VAP Not Hispanic or Latino (NH) 234,317 41.51% VAP NH Population of one race 219,982 38.97% VAP NH White alone 126,409 22.40% VAP NH Black or African American alone 49,878 8.84% VAP NH Asian alone 37,013 6.56% VAP NH American Indian and Alaska Native alone 1,896 0.34% VAP NH Native Hawaiian and Other Pacific Islander alone 1,895 0.34% VAP NH Some Other Race alone 2,891 0.51% VAP NH Population of two or more races 14,335 2.54% VAP DOJ NH Black or African American 52,513 9.30% VAP DOJ NH Asian 40,050 7.10% VAP DOJ NH American Indian and Alaska Native 4,720 0.84% VAP DOJ NH Native Hawaiian and Other Pacific Islander 2,234 0.40% VAP DOJ NH Some Other Race 4,676 0.83% VAP DOJ NH Balance of Population of two or more races 3,715 0.66%
2020 Census Housing Occupancy Status Name Count Percent Total Housing Units 219,012 100.00% Occupied 211,384 96.52% Vacant 7,628 3.48%
2020 Census Group Quarters Population (adj Elec. §21003 - SWDB 9/27/2021) Name Count Percent Total Group Quarters Population: 13,802 100.00% Institutionalized population: 2,998 21.72% Correctional facilities for adults 720 5.22% Juvenile facilities 116 0.84% Nursing facilities/Skilled-nursing facilities 1,927 13.96% Other institutional facilities 235 1.70% Noninstitutionalized population: 10,804 78.28% College/University student housing 7,354 53.28% Military quarters 0 0.00% Other noninstitutional facilities 3,450 25.00%
2019-2023 ACS Citizen Population (adj Elec. §21003 - SWDB 7/16/2025) Name Count Percent Total Citizen Population (CITZ) 674,088 100.00% CITZ Hispanic or Latino 399,160 59.21% CITZ Not Hispanic or Latino (NH) 274,921 40.78% CITZ NH White alone 149,162 22.13% CITZ NH Black or African American Alone 67,049 9.95% CITZ NH Asian Alone 38,671 5.74% CITZ NH American Indian and Alaska Native Alone 1,164 0.17% CITZ NH Native Hawaiian and Other Pacific Islander alone 2,598 0.39% CITZ NH Black or African American and White 5,597 0.83% CITZ NH American Indian or Alaska Native and White 4,262 0.63% CITZ NH Asian and White 2,186 0.32% CITZ NH American Indian or Alaska Native and Black or African American 422 0.06% CITZ NH Remainder of Two or More Race 3,469 0.51% CITZ DOJ NH Black or African American 72,646 10.78% CITZ DOJ NH Asian 42,933 6.37% CITZ DOJ NH American Indian and Alaska Native 3,350 0.50%
2019-2023 ACS Citizen Voting Age Population (adj Elec. §21003 - SWDB 7/16/2025) Name Count Percent Total Citizen Voting Age Population (CVAP) 486,150 100.00% CVAP Hispanic or Latino 263,801 54.26% CVAP Not Hispanic or Latino (NH) 222,383 45.74% CVAP NH White alone 125,591 25.83% CVAP NH Black or African American Alone 52,243 10.75% CVAP NH Asian Alone 31,306 6.44% CVAP NH American Indian and Alaska Native Alone 995 0.20% CVAP NH Native Hawaiian and Other Pacific Islander alone 1,952 0.40% CVAP NH Black or African American and White 3,023 0.62% CVAP NH Asian and White 2,540 0.52% CVAP NH American Indian or Alaska Native and White 1,750 0.36% CVAP NH American Indian or Alaska Native and Black or African American 374 0.08% CVAP NH Remainder of Two or More Race 2,291 0.47% CVAP DOJ NH Black or African American 55,266 11.37% CVAP DOJ NH Asian 33,846 6.96% CVAP DOJ NH American Indian and Alaska Native 2,745 0.56%
Counties In District Name Count Percent Riverside 760,072 31.44%
Places In District Name Count Percent RIVERSIDE: Good Hope(U) 9,532 100.00% RIVERSIDE: Home Gardens(U) 11,259 100.00% RIVERSIDE: Jurupa Valley(C) 105,456 100.00% RIVERSIDE: March ARB(U) 811 100.00% RIVERSIDE: Meadowbrook(U) 3,161 100.00% RIVERSIDE: Mead Valley(U) 19,953 100.00% RIVERSIDE: Moreno Valley(C) 209,667 100.00% RIVERSIDE: Nuevo(U) 3,290 48.72% RIVERSIDE: Perris(C) 79,090 100.00% RIVERSIDE: Riverside(C) 316,452 100.00% RIVERSIDE: Romoland(U) 819 40.73% RIVERSIDE: Remainder of Riverside(R) 582 0.75%
Senate Office of Demographics 02/2026