This Congressional district was established by the voters of California with the passage of Proposition 50 (2025) on November 4, 2025 and will go into effect after the November 2026 elections and upon seating of the 120th Congress, January 3, 2027. This district will stay in use until the California Citizens Redistricting Commission draws new maps following the 2030 U.S. Census .
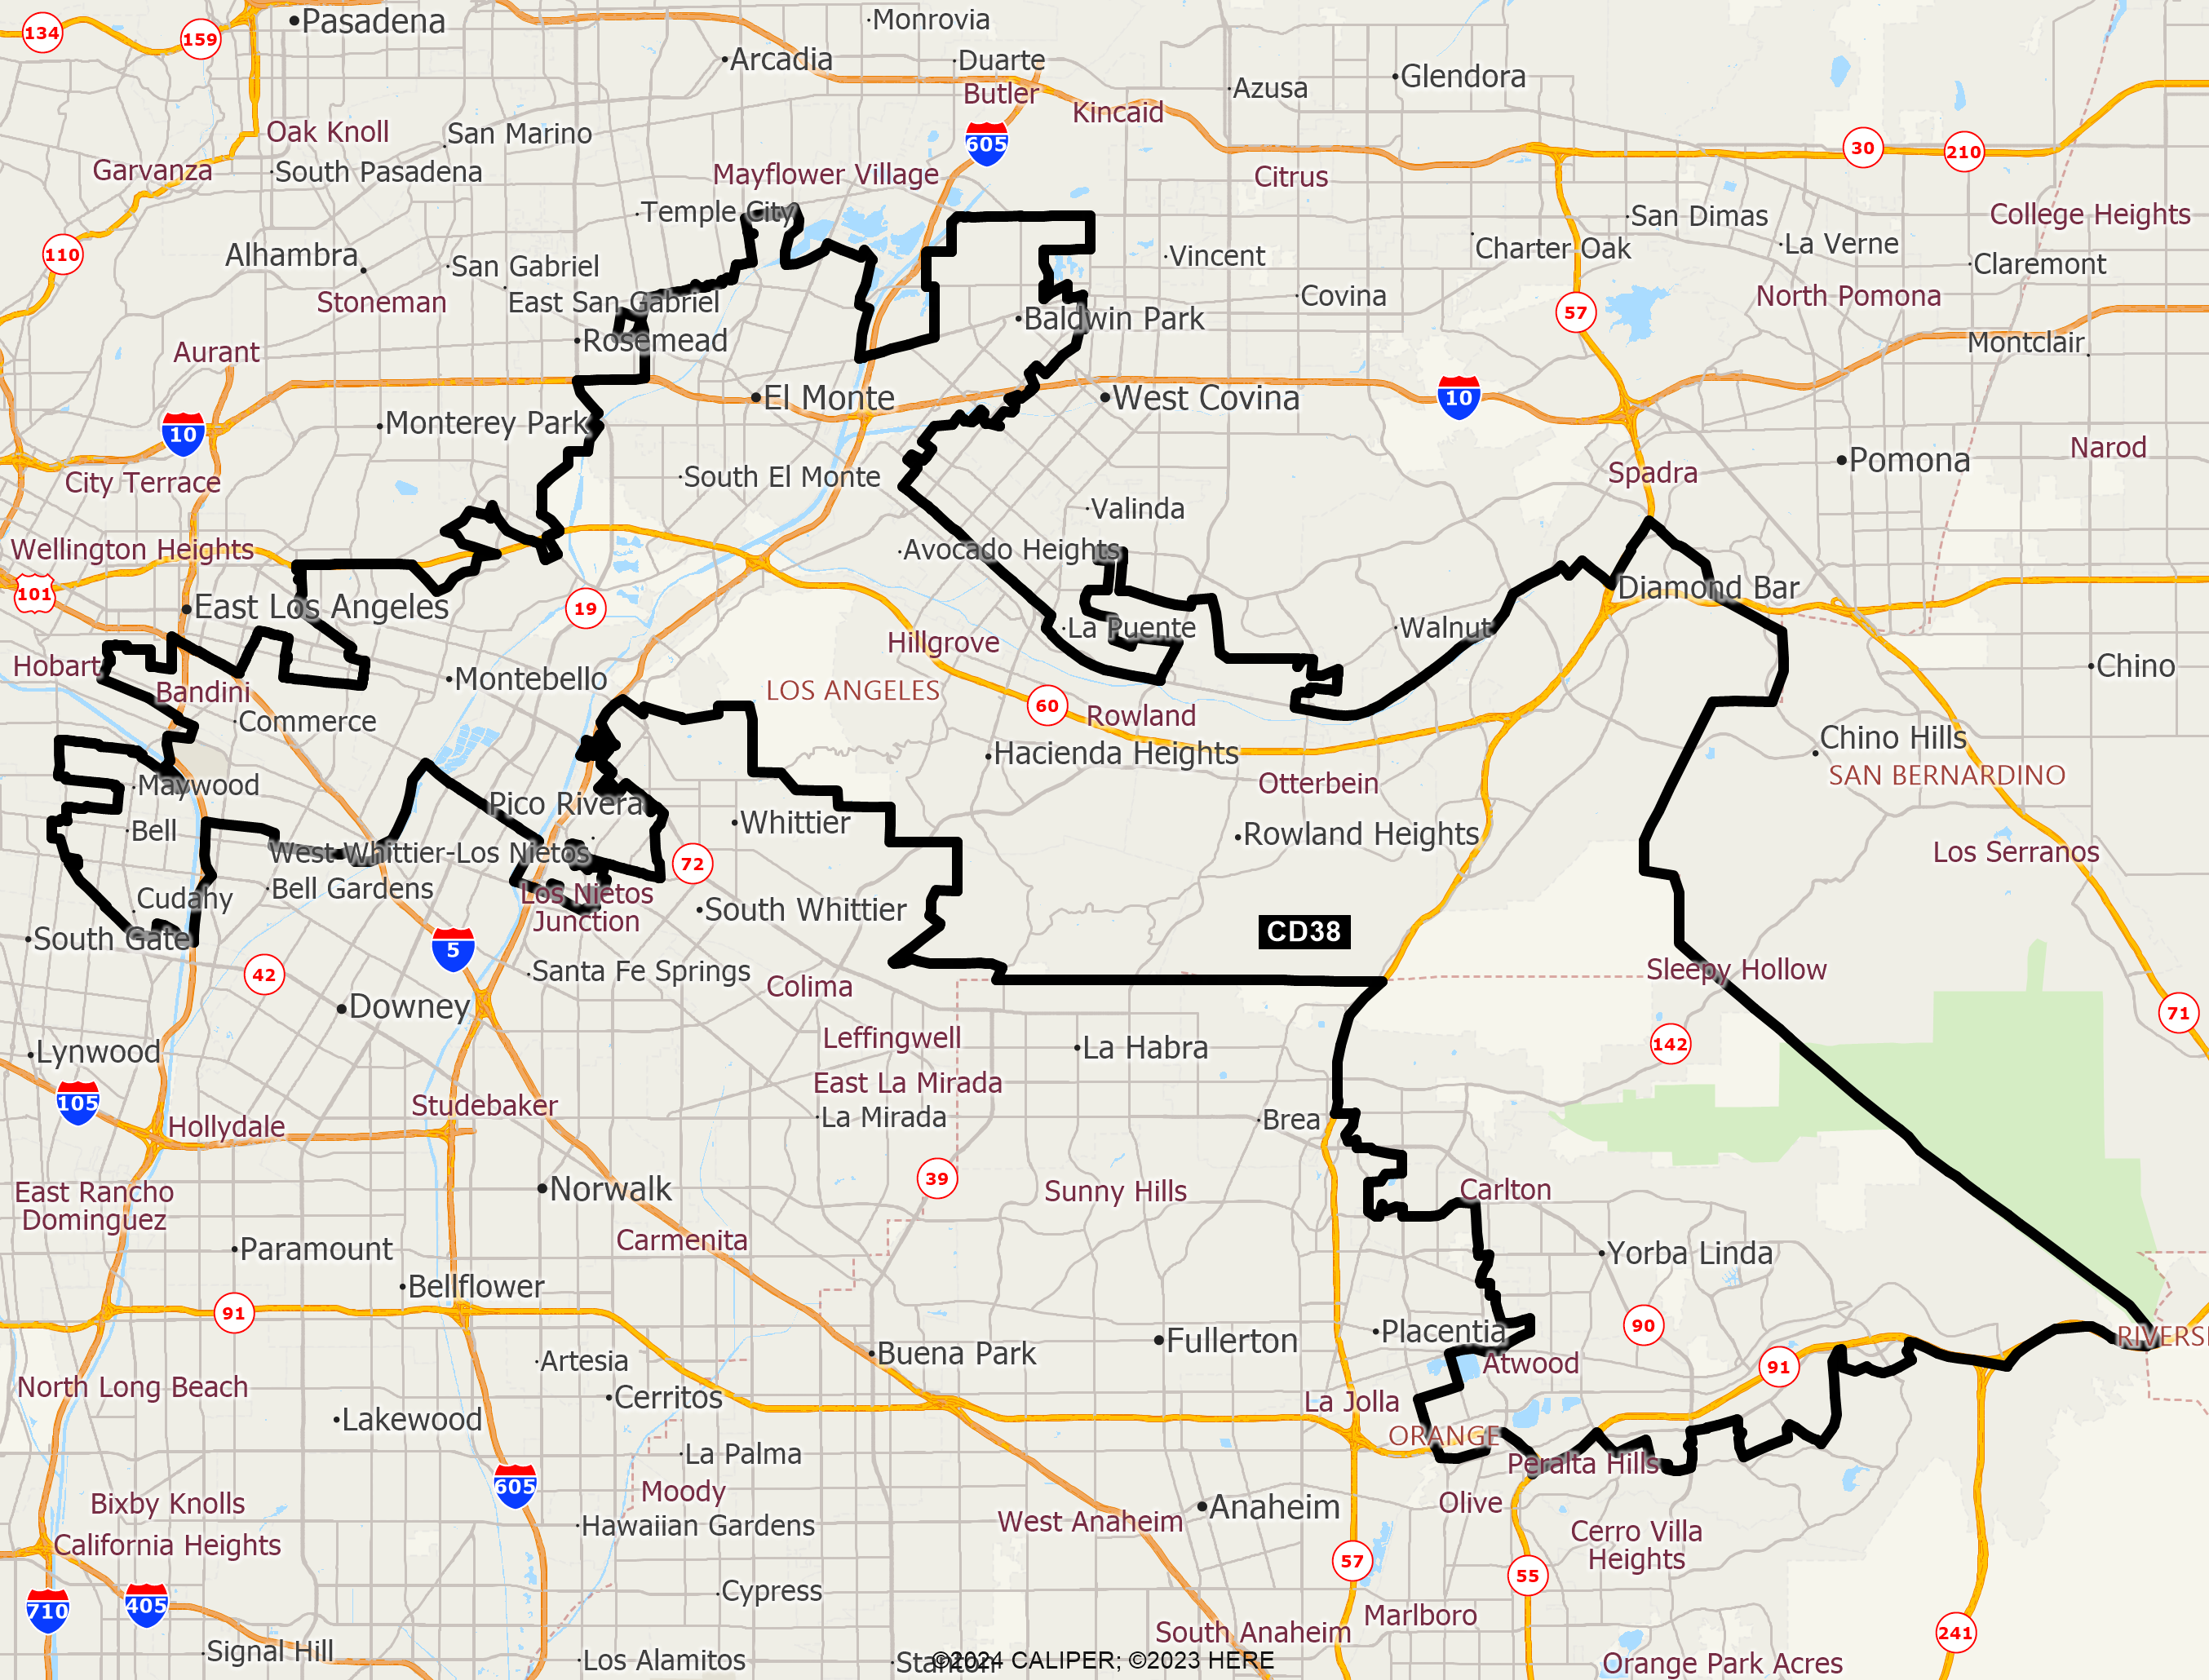
DISTRICT CD38
2020 Census Population (adj Elec. §21003 - SWDB 9/27/2021) Name Count Percent Total Population (POP) 760,067 100.00% POP Hispanic or Latino 450,094 59.22% POP Not Hispanic or Latino (NH) 309,973 40.78% POP NH Population of one race 297,786 39.18% POP NH White alone 101,616 13.37% POP NH Black or African American alone 8,544 1.12% POP NH Asian alone 182,917 24.07% POP NH American Indian and Alaska Native alone 1,201 0.16% POP NH Native Hawaiian and Other Pacific Islander alone 622 0.08% POP NH Some Other Race alone 2,886 0.38% POP NH Population of two or more races 12,187 1.60% POP DOJ NH Black or African American 9,546 1.26% POP DOJ NH Asian 187,814 24.71% POP DOJ NH American Indian and Alaska Native 2,755 0.36% POP DOJ NH Native Hawaiian and Other Pacific Islander 855 0.11% POP DOJ NH Some Other Race 4,427 0.58% POP DOJ NH Balance of Population of two or more races 2,960 0.39%
2020 Census Voting Age Population (adj Elec. §21003 - SWDB 9/27/2021) Name Count Percent Total Voting Age Population (VAP) 594,562 100.00% VAP Hispanic or Latino 336,831 56.65% VAP Not Hispanic or Latino (NH) 257,731 43.35% VAP NH Population of one race 249,902 42.03% VAP NH White alone 86,889 14.61% VAP NH Black or African American alone 7,238 1.22% VAP NH Asian alone 152,393 25.63% VAP NH American Indian and Alaska Native alone 1,013 0.17% VAP NH Native Hawaiian and Other Pacific Islander alone 495 0.08% VAP NH Some Other Race alone 1,874 0.32% VAP NH Population of two or more races 7,829 1.32% VAP DOJ NH Black or African American 7,841 1.32% VAP DOJ NH Asian 155,031 26.07% VAP DOJ NH American Indian and Alaska Native 2,254 0.38% VAP DOJ NH Native Hawaiian and Other Pacific Islander 658 0.11% VAP DOJ NH Some Other Race 3,012 0.51% VAP DOJ NH Balance of Population of two or more races 2,046 0.34%
2020 Census Housing Occupancy Status Name Count Percent Total Housing Units 226,605 100.00% Occupied 220,535 97.32% Vacant 6,070 2.68%
2020 Census Group Quarters Population (adj Elec. §21003 - SWDB 9/27/2021) Name Count Percent Total Group Quarters Population: 4,986 100.00% Institutionalized population: 2,472 49.58% Correctional facilities for adults 48 0.96% Juvenile facilities 132 2.65% Nursing facilities/Skilled-nursing facilities 2,264 45.41% Other institutional facilities 28 0.56% Noninstitutionalized population: 2,514 50.42% College/University student housing 19 0.38% Military quarters 0 0.00% Other noninstitutional facilities 2,495 50.04%
2019-2023 ACS Citizen Population (adj Elec. §21003 - SWDB 7/16/2025) Name Count Percent Total Citizen Population (CITZ) 620,249 100.00% CITZ Hispanic or Latino 348,196 56.14% CITZ Not Hispanic or Latino (NH) 271,973 43.85% CITZ NH White alone 98,841 15.94% CITZ NH Black or African American Alone 9,648 1.56% CITZ NH Asian Alone 149,498 24.10% CITZ NH American Indian and Alaska Native Alone 1,505 0.24% CITZ NH Native Hawaiian and Other Pacific Islander alone 867 0.14% CITZ NH Black or African American and White 1,104 0.18% CITZ NH American Indian or Alaska Native and White 6,507 1.05% CITZ NH Asian and White 1,086 0.18% CITZ NH American Indian or Alaska Native and Black or African American 107 0.02% CITZ NH Remainder of Two or More Race 2,807 0.45% CITZ DOJ NH Black or African American 10,752 1.73% CITZ DOJ NH Asian 156,005 25.15% CITZ DOJ NH American Indian and Alaska Native 2,591 0.42%
2019-2023 ACS Citizen Voting Age Population (adj Elec. §21003 - SWDB 7/16/2025) Name Count Percent Total Citizen Voting Age Population (CVAP) 465,896 100.00% CVAP Hispanic or Latino 245,091 52.61% CVAP Not Hispanic or Latino (NH) 220,759 47.38% CVAP NH White alone 84,848 18.21% CVAP NH Black or African American Alone 7,525 1.62% CVAP NH Asian Alone 119,739 25.70% CVAP NH American Indian and Alaska Native Alone 1,219 0.26% CVAP NH Native Hawaiian and Other Pacific Islander alone 797 0.17% CVAP NH Black or African American and White 579 0.12% CVAP NH Asian and White 3,056 0.66% CVAP NH American Indian or Alaska Native and White 819 0.18% CVAP NH American Indian or Alaska Native and Black or African American 72 0.02% CVAP NH Remainder of Two or More Race 2,044 0.44% CVAP DOJ NH Black or African American 8,104 1.74% CVAP DOJ NH Asian 122,795 26.36% CVAP DOJ NH American Indian and Alaska Native 2,038 0.44%
Counties In District Name Count Percent Los Angeles 633,569 6.31% Orange 126,489 3.96%
Places In District Name Count Percent LOS ANGELES: Avocado Heights(U) 13,368 100.00% LOS ANGELES: Baldwin Park(C) 72,488 100.00% LOS ANGELES: Bell(C) 33,700 100.00% LOS ANGELES: Commerce(C) 12,445 100.00% LOS ANGELES: Cudahy(C) 22,903 100.00% LOS ANGELES: Diamond Bar(C) 55,179 100.00% LOS ANGELES: El Monte(C) 109,905 100.00% LOS ANGELES: Hacienda Heights(U) 54,328 100.00% LOS ANGELES: Industry(C) 276 100.00% LOS ANGELES: La Habra Heights(C) 5,711 100.00% LOS ANGELES: Maywood(C) 25,254 100.00% LOS ANGELES: Montebello(C) 62,879 100.00% LOS ANGELES: North El Monte(U) 3,736 100.00% LOS ANGELES: Pico Rivera(C) 38,102 61.13% LOS ANGELES: Rose Hills(U) 2,931 100.00% LOS ANGELES: Rowland Heights(U) 48,358 100.00% LOS ANGELES: South El Monte(C) 19,649 100.00% LOS ANGELES: South San Jose Hills(U) 19,775 99.12% LOS ANGELES: West Puente Valley(U) 99 0.43% LOS ANGELES: West Whittier-Los Nietos(U) 25,189 98.99% LOS ANGELES: Whittier(C) 0 0.00% LOS ANGELES: Remainder of Los Angeles(R) 7,294 8.32% ORANGE: Anaheim(C) 24,419 7.02% ORANGE: Brea(C) 16,644 35.12% ORANGE: Placentia(C) 14,561 28.04% ORANGE: Yorba Linda(C) 68,414 100.00% ORANGE: Remainder of Orange(R) 2,451 8.80%
Senate Office of Demographics 02/2026