This Congressional district was established by the voters of California with the passage of Proposition 50 (2025) on November 4, 2025 and will go into effect after the November 2026 elections and upon seating of the 120th Congress, January 3, 2027. This district will stay in use until the California Citizens Redistricting Commission draws new maps following the 2030 U.S. Census .
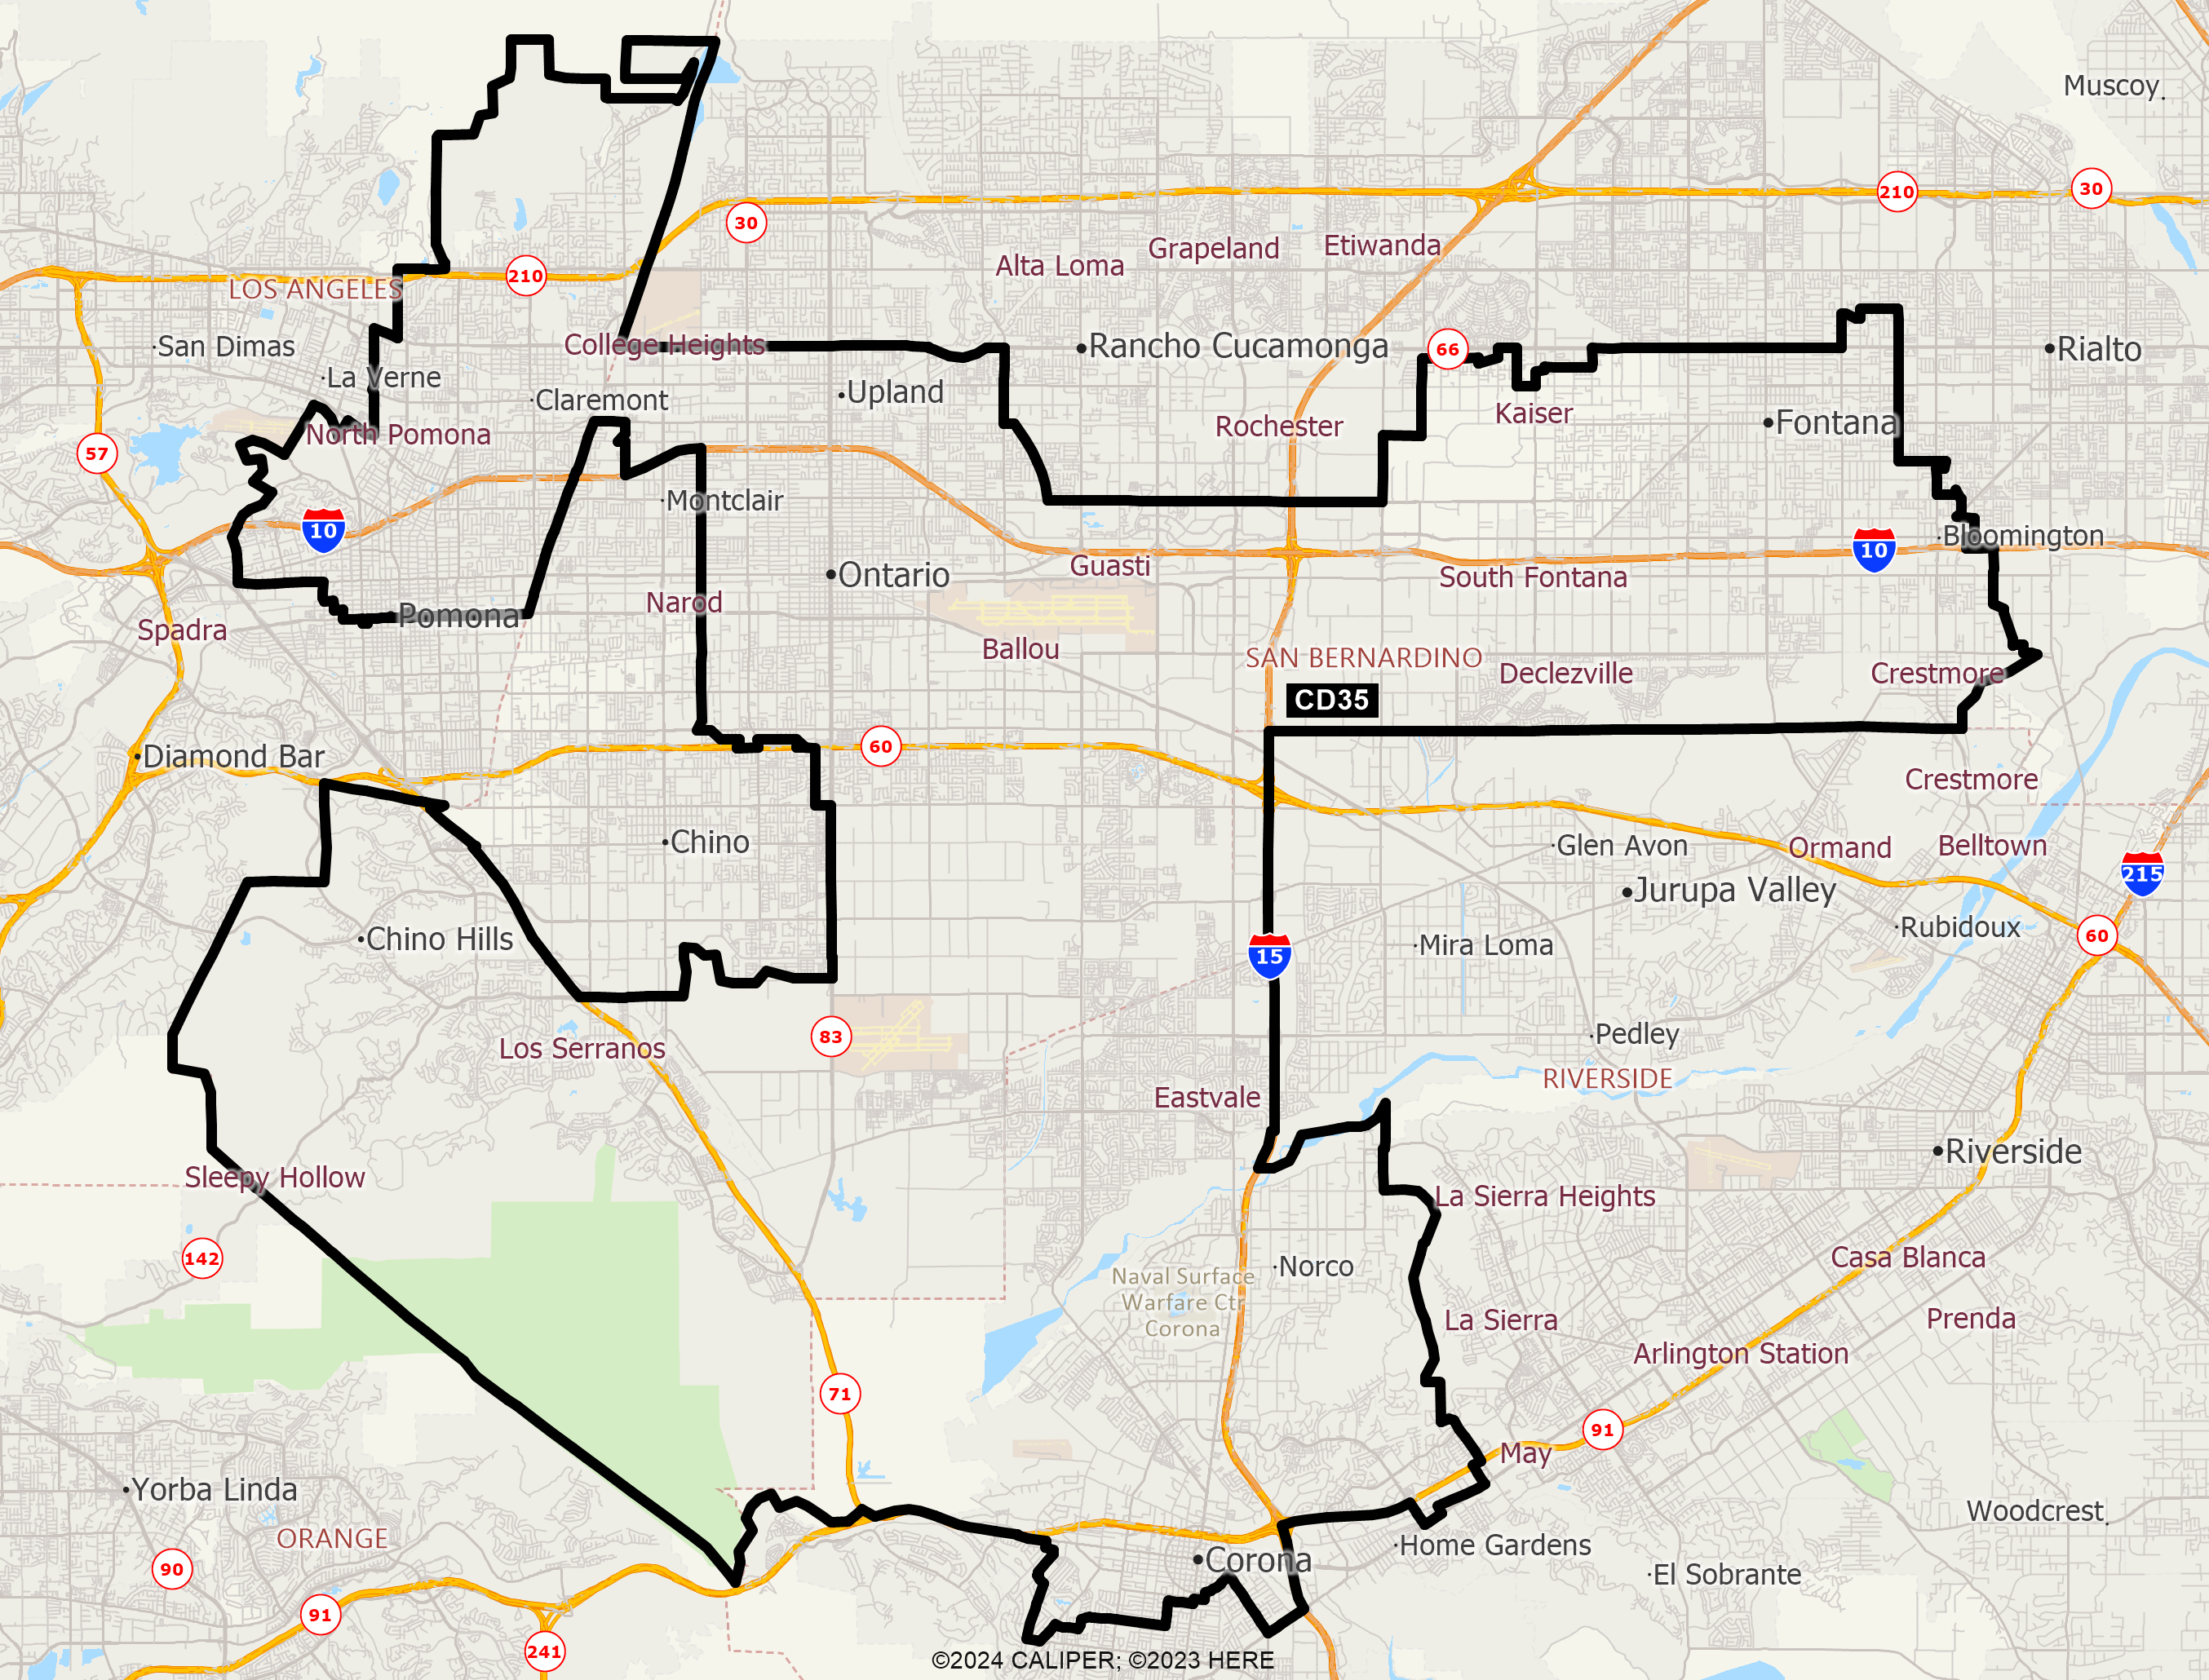
DISTRICT CD35
2020 Census Population (adj Elec. §21003 - SWDB 9/27/2021) Name Count Percent Total Population (POP) 760,066 100.00% POP Hispanic or Latino 446,255 58.71% POP Not Hispanic or Latino (NH) 313,811 41.29% POP NH Population of one race 294,042 38.69% POP NH White alone 140,468 18.48% POP NH Black or African American alone 44,462 5.85% POP NH Asian alone 101,513 13.36% POP NH American Indian and Alaska Native alone 1,789 0.24% POP NH Native Hawaiian and Other Pacific Islander alone 1,644 0.22% POP NH Some Other Race alone 4,166 0.55% POP NH Population of two or more races 19,769 2.60% POP DOJ NH Black or African American 47,788 6.29% POP DOJ NH Asian 107,687 14.17% POP DOJ NH American Indian and Alaska Native 4,547 0.60% POP DOJ NH Native Hawaiian and Other Pacific Islander 2,115 0.28% POP DOJ NH Some Other Race 6,191 0.81% POP DOJ NH Balance of Population of two or more races 5,015 0.66%
2020 Census Voting Age Population (adj Elec. §21003 - SWDB 9/27/2021) Name Count Percent Total Voting Age Population (VAP) 572,024 100.00% VAP Hispanic or Latino 317,740 55.55% VAP Not Hispanic or Latino (NH) 254,284 44.45% VAP NH Population of one race 241,206 42.17% VAP NH White alone 119,304 20.86% VAP NH Black or African American alone 35,266 6.17% VAP NH Asian alone 81,019 14.16% VAP NH American Indian and Alaska Native alone 1,430 0.25% VAP NH Native Hawaiian and Other Pacific Islander alone 1,263 0.22% VAP NH Some Other Race alone 2,924 0.51% VAP NH Population of two or more races 13,078 2.29% VAP DOJ NH Black or African American 37,216 6.51% VAP DOJ NH Asian 84,562 14.78% VAP DOJ NH American Indian and Alaska Native 3,661 0.64% VAP DOJ NH Native Hawaiian and Other Pacific Islander 1,564 0.27% VAP DOJ NH Some Other Race 4,530 0.79% VAP DOJ NH Balance of Population of two or more races 3,447 0.60%
2020 Census Housing Occupancy Status Name Count Percent Total Housing Units 228,041 100.00% Occupied 220,694 96.78% Vacant 7,347 3.22%
2020 Census Group Quarters Population (adj Elec. §21003 - SWDB 9/27/2021) Name Count Percent Total Group Quarters Population: 11,193 100.00% Institutionalized population: 2,752 24.59% Correctional facilities for adults 0 0.00% Juvenile facilities 173 1.55% Nursing facilities/Skilled-nursing facilities 2,561 22.88% Other institutional facilities 18 0.16% Noninstitutionalized population: 8,441 75.41% College/University student housing 5,928 52.96% Military quarters 0 0.00% Other noninstitutional facilities 2,513 22.45%
2019-2023 ACS Citizen Population (adj Elec. §21003 - SWDB 7/16/2025) Name Count Percent Total Citizen Population (CITZ) 663,138 100.00% CITZ Hispanic or Latino 381,254 57.49% CITZ Not Hispanic or Latino (NH) 281,949 42.52% CITZ NH White alone 139,171 20.99% CITZ NH Black or African American Alone 42,853 6.46% CITZ NH Asian Alone 81,121 12.23% CITZ NH American Indian and Alaska Native Alone 1,319 0.20% CITZ NH Native Hawaiian and Other Pacific Islander alone 1,285 0.19% CITZ NH Black or African American and White 3,885 0.59% CITZ NH American Indian or Alaska Native and White 5,840 0.88% CITZ NH Asian and White 2,664 0.40% CITZ NH American Indian or Alaska Native and Black or African American 640 0.10% CITZ NH Remainder of Two or More Race 3,494 0.53% CITZ DOJ NH Black or African American 46,738 7.05% CITZ DOJ NH Asian 86,961 13.11% CITZ DOJ NH American Indian and Alaska Native 3,983 0.60%
2019-2023 ACS Citizen Voting Age Population (adj Elec. §21003 - SWDB 7/16/2025) Name Count Percent Total Citizen Voting Age Population (CVAP) 481,931 100.00% CVAP Hispanic or Latino 255,710 53.06% CVAP Not Hispanic or Latino (NH) 226,284 46.95% CVAP NH White alone 117,299 24.34% CVAP NH Black or African American Alone 35,344 7.33% CVAP NH Asian Alone 61,075 12.67% CVAP NH American Indian and Alaska Native Alone 1,236 0.26% CVAP NH Native Hawaiian and Other Pacific Islander alone 1,014 0.21% CVAP NH Black or African American and White 2,586 0.54% CVAP NH Asian and White 2,996 0.62% CVAP NH American Indian or Alaska Native and White 2,038 0.42% CVAP NH American Indian or Alaska Native and Black or African American 550 0.11% CVAP NH Remainder of Two or More Race 2,466 0.51% CVAP DOJ NH Black or African American 37,930 7.87% CVAP DOJ NH Asian 64,071 13.29% CVAP DOJ NH American Indian and Alaska Native 3,274 0.68%
Counties In District Name Count Percent Los Angeles 118,992 1.18% Riverside 168,693 6.98% San Bernardino 472,382 21.67%
Places In District Name Count Percent LOS ANGELES: Claremont(C) 37,412 100.00% LOS ANGELES: Pomona(C) 80,397 52.70% LOS ANGELES: Remainder of Los Angeles(R) 1,183 1.35% RIVERSIDE: Corona(C) 76,320 48.40% RIVERSIDE: Eastvale(C) 69,901 100.00% RIVERSIDE: Norco(C) 22,406 100.00% RIVERSIDE: Remainder of Riverside(R) 66 0.08% SAN BERNARDINO: Bloomington(U) 24,414 100.00% SAN BERNARDINO: Chino(C) 13,704 15.83% SAN BERNARDINO: Chino Hills(C) 78,545 100.00% SAN BERNARDINO: Fontana(C) 108,421 51.86% SAN BERNARDINO: Montclair(C) 1,737 4.57% SAN BERNARDINO: Ontario(C) 175,837 100.00% SAN BERNARDINO: Rancho Cucamonga(C) 8,098 4.63% SAN BERNARDINO: Upland(C) 38,970 49.10% SAN BERNARDINO: Remainder of San Bernardino(R) 22,656 18.68%
Senate Office of Demographics 02/2026