This Congressional district was established by the voters of California with the passage of Proposition 50 (2025) on November 4, 2025 and will go into effect after the November 2026 elections and upon seating of the 120th Congress, January 3, 2027. This district will stay in use until the California Citizens Redistricting Commission draws new maps following the 2030 U.S. Census .
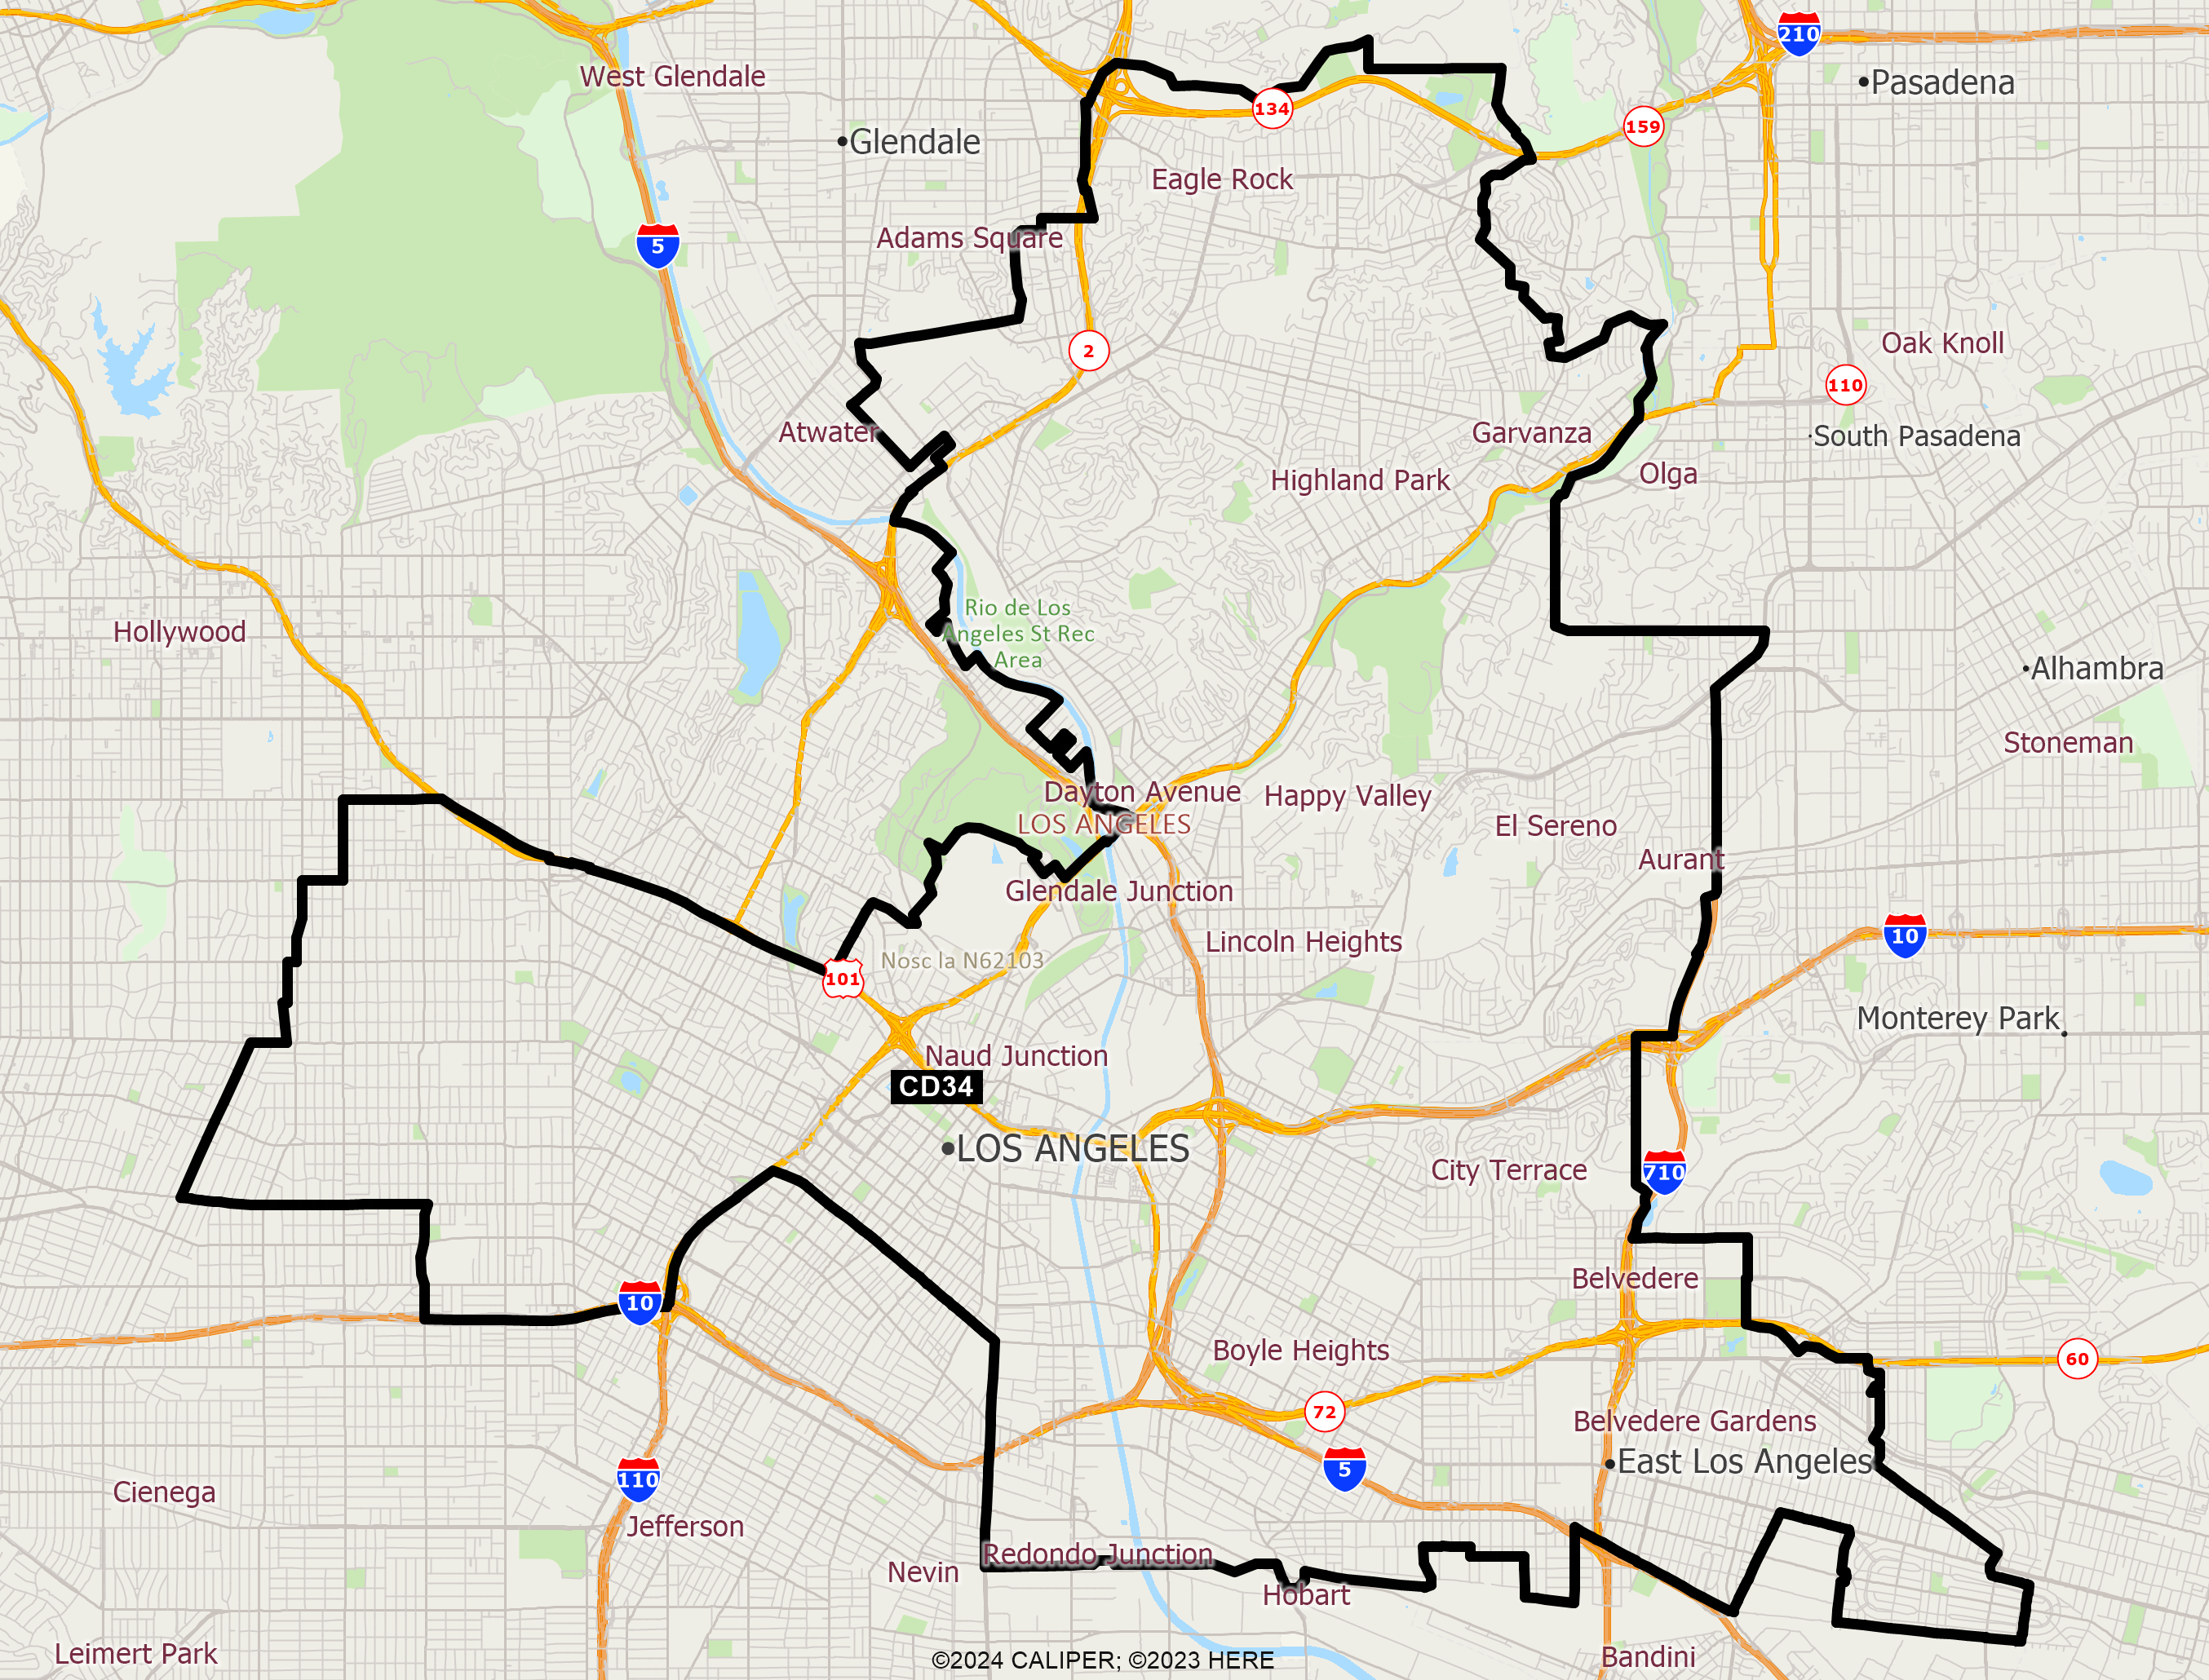
DISTRICT CD34
2020 Census Population (adj Elec. §21003 - SWDB 9/27/2021) Name Count Percent Total Population (POP) 760,067 100.00% POP Hispanic or Latino 497,280 65.43% POP Not Hispanic or Latino (NH) 262,787 34.57% POP NH Population of one race 248,118 32.64% POP NH White alone 82,569 10.86% POP NH Black or African American alone 30,947 4.07% POP NH Asian alone 128,548 16.91% POP NH American Indian and Alaska Native alone 1,685 0.22% POP NH Native Hawaiian and Other Pacific Islander alone 506 0.07% POP NH Some Other Race alone 3,863 0.51% POP NH Population of two or more races 14,669 1.93% POP DOJ NH Black or African American 33,158 4.36% POP DOJ NH Asian 133,774 17.60% POP DOJ NH American Indian and Alaska Native 2,989 0.39% POP DOJ NH Native Hawaiian and Other Pacific Islander 708 0.09% POP DOJ NH Some Other Race 5,546 0.73% POP DOJ NH Balance of Population of two or more races 4,043 0.53%
2020 Census Voting Age Population (adj Elec. §21003 - SWDB 9/27/2021) Name Count Percent Total Voting Age Population (VAP) 612,908 100.00% VAP Hispanic or Latino 377,917 61.66% VAP Not Hispanic or Latino (NH) 234,991 38.34% VAP NH Population of one race 223,872 36.53% VAP NH White alone 75,482 12.32% VAP NH Black or African American alone 27,821 4.54% VAP NH Asian alone 116,091 18.94% VAP NH American Indian and Alaska Native alone 1,383 0.23% VAP NH Native Hawaiian and Other Pacific Islander alone 416 0.07% VAP NH Some Other Race alone 2,679 0.44% VAP NH Population of two or more races 11,119 1.81% VAP DOJ NH Black or African American 29,613 4.83% VAP DOJ NH Asian 119,787 19.54% VAP DOJ NH American Indian and Alaska Native 2,513 0.41% VAP DOJ NH Native Hawaiian and Other Pacific Islander 560 0.09% VAP DOJ NH Some Other Race 4,042 0.66% VAP DOJ NH Balance of Population of two or more races 2,994 0.49%
2020 Census Housing Occupancy Status Name Count Percent Total Housing Units 282,075 100.00% Occupied 265,323 94.06% Vacant 16,752 5.94%
2020 Census Group Quarters Population (adj Elec. §21003 - SWDB 9/27/2021) Name Count Percent Total Group Quarters Population: 27,903 100.00% Institutionalized population: 9,221 33.05% Correctional facilities for adults 5,189 18.60% Juvenile facilities 225 0.81% Nursing facilities/Skilled-nursing facilities 3,500 12.54% Other institutional facilities 307 1.10% Noninstitutionalized population: 18,682 66.95% College/University student housing 3,905 13.99% Military quarters 0 0.00% Other noninstitutional facilities 14,777 52.96%
2019-2023 ACS Citizen Population (adj Elec. §21003 - SWDB 7/16/2025) Name Count Percent Total Citizen Population (CITZ) 569,176 100.00% CITZ Hispanic or Latino 347,923 61.13% CITZ Not Hispanic or Latino (NH) 221,236 38.87% CITZ NH White alone 80,417 14.13% CITZ NH Black or African American Alone 30,993 5.45% CITZ NH Asian Alone 94,263 16.56% CITZ NH American Indian and Alaska Native Alone 1,556 0.27% CITZ NH Native Hawaiian and Other Pacific Islander alone 599 0.11% CITZ NH Black or African American and White 3,098 0.54% CITZ NH American Indian or Alaska Native and White 5,704 1.00% CITZ NH Asian and White 1,255 0.22% CITZ NH American Indian or Alaska Native and Black or African American 782 0.14% CITZ NH Remainder of Two or More Race 2,504 0.44% CITZ DOJ NH Black or African American 34,091 5.99% CITZ DOJ NH Asian 99,967 17.56% CITZ DOJ NH American Indian and Alaska Native 2,811 0.49%
2019-2023 ACS Citizen Voting Age Population (adj Elec. §21003 - SWDB 7/16/2025) Name Count Percent Total Citizen Voting Age Population (CVAP) 430,418 100.00% CVAP Hispanic or Latino 236,352 54.91% CVAP Not Hispanic or Latino (NH) 194,059 45.09% CVAP NH White alone 71,835 16.69% CVAP NH Black or African American Alone 28,132 6.54% CVAP NH Asian Alone 82,183 19.09% CVAP NH American Indian and Alaska Native Alone 1,425 0.33% CVAP NH Native Hawaiian and Other Pacific Islander alone 571 0.13% CVAP NH Black or African American and White 2,518 0.59% CVAP NH Asian and White 3,488 0.81% CVAP NH American Indian or Alaska Native and White 1,051 0.24% CVAP NH American Indian or Alaska Native and Black or African American 778 0.18% CVAP NH Remainder of Two or More Race 2,043 0.47% CVAP DOJ NH Black or African American 30,650 7.12% CVAP DOJ NH Asian 85,671 19.90% CVAP DOJ NH American Indian and Alaska Native 2,476 0.58%
Counties In District Name Count Percent Los Angeles 760,071 7.56%
Places In District Name Count Percent LOS ANGELES: East Los Angeles(U) 119,300 100.00% LOS ANGELES: Los Angeles(C) 640,771 16.38%
Senate Office of Demographics 02/2026