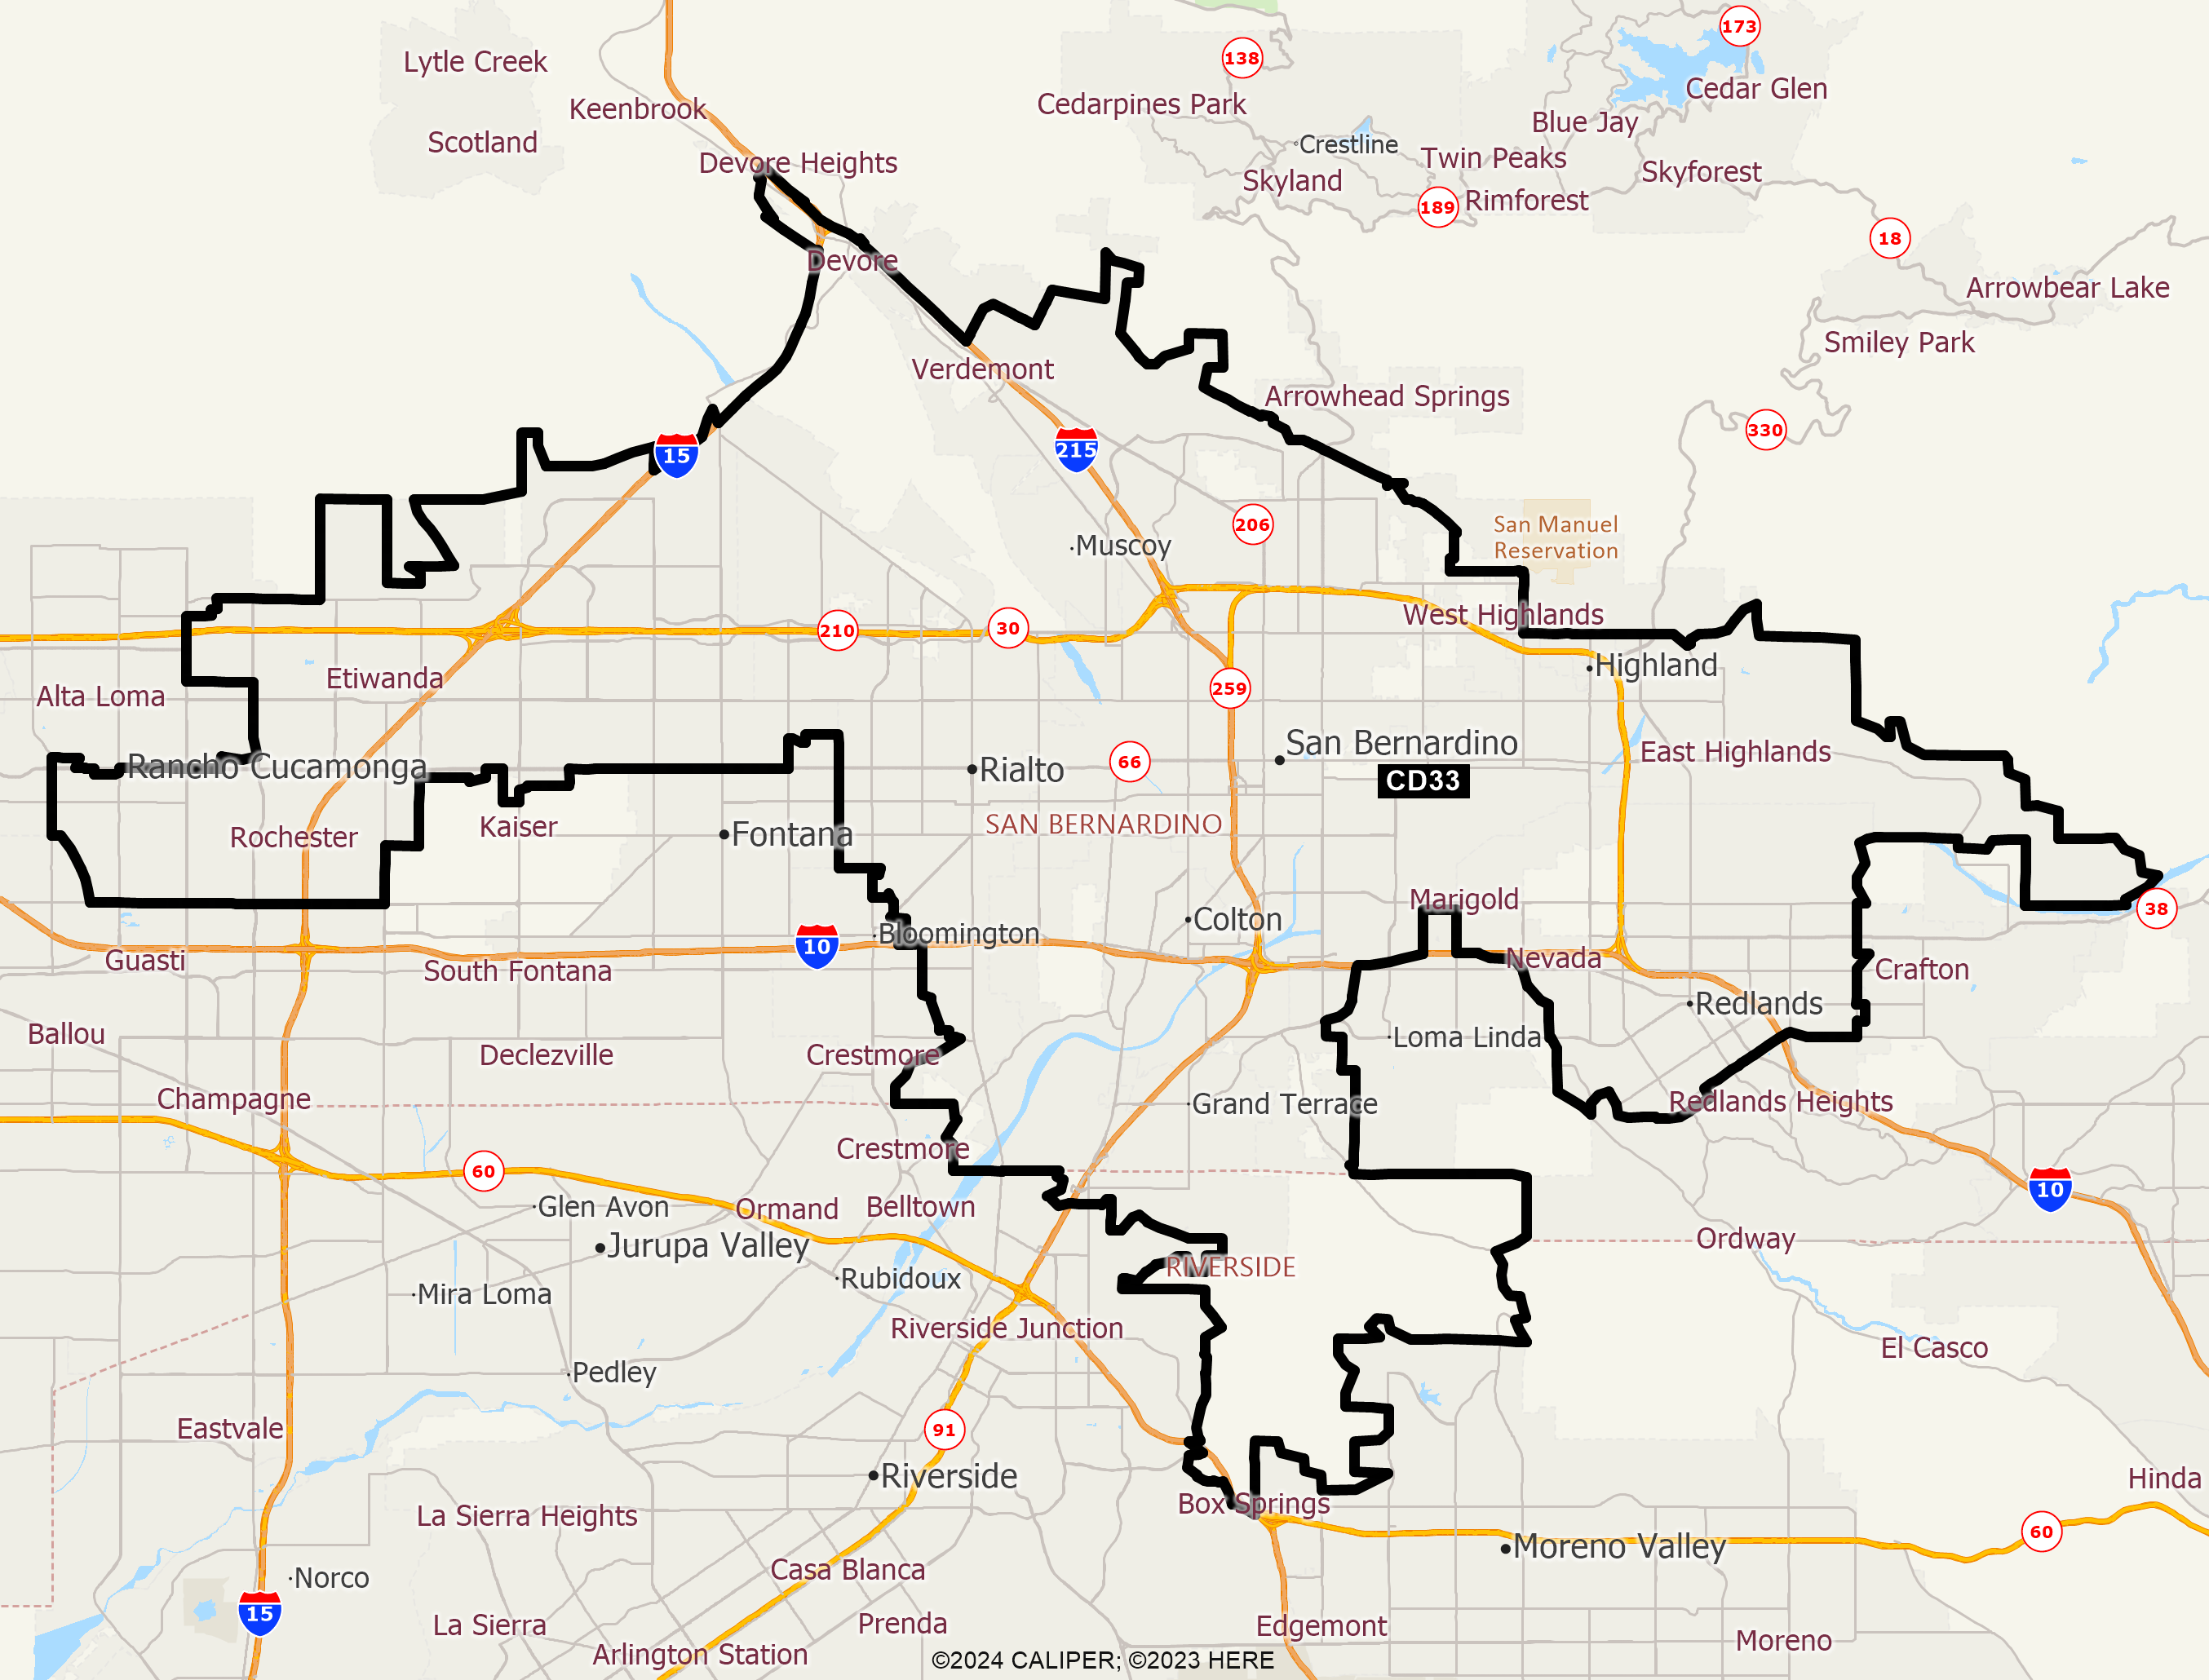
This Congressional district was established by the voters of California with the passage of Proposition 50 (2025) on November 4, 2025 and will go into effect after the November 2026 elections and upon seating of the 120th Congress, January 3, 2027. This district will stay in use until the California Citizens Redistricting Commission draws new maps following the 2030 U.S. Census .
DISTRICT CD33
2020 Census Population (adj Elec. §21003 - SWDB 9/27/2021) Name Count Percent Total Population (POP) 760,067 100.00% POP Hispanic or Latino 459,436 60.45% POP Not Hispanic or Latino (NH) 300,631 39.55% POP NH Population of one race 280,044 36.84% POP NH White alone 138,544 18.23% POP NH Black or African American alone 76,727 10.09% POP NH Asian alone 56,399 7.42% POP NH American Indian and Alaska Native alone 2,183 0.29% POP NH Native Hawaiian and Other Pacific Islander alone 2,020 0.27% POP NH Some Other Race alone 4,171 0.55% POP NH Population of two or more races 20,587 2.71% POP DOJ NH Black or African American 81,416 10.71% POP DOJ NH Asian 61,076 8.04% POP DOJ NH American Indian and Alaska Native 5,072 0.67% POP DOJ NH Native Hawaiian and Other Pacific Islander 2,473 0.33% POP DOJ NH Some Other Race 6,259 0.82% POP DOJ NH Balance of Population of two or more races 5,791 0.76%
2020 Census Voting Age Population (adj Elec. §21003 - SWDB 9/27/2021) Name Count Percent Total Voting Age Population (VAP) 557,952 100.00% VAP Hispanic or Latino 318,221 57.03% VAP Not Hispanic or Latino (NH) 239,731 42.97% VAP NH Population of one race 226,381 40.57% VAP NH White alone 116,060 20.80% VAP NH Black or African American alone 58,936 10.56% VAP NH Asian alone 45,281 8.12% VAP NH American Indian and Alaska Native alone 1,705 0.31% VAP NH Native Hawaiian and Other Pacific Islander alone 1,463 0.26% VAP NH Some Other Race alone 2,936 0.53% VAP NH Population of two or more races 13,350 2.39% VAP DOJ NH Black or African American 61,576 11.04% VAP DOJ NH Asian 47,979 8.60% VAP DOJ NH American Indian and Alaska Native 4,092 0.73% VAP DOJ NH Native Hawaiian and Other Pacific Islander 1,763 0.32% VAP DOJ NH Some Other Race 4,479 0.80% VAP DOJ NH Balance of Population of two or more races 3,782 0.68%
2020 Census Housing Occupancy Status Name Count Percent Total Housing Units 227,386 100.00% Occupied 219,507 96.53% Vacant 7,879 3.47%
2020 Census Group Quarters Population (adj Elec. §21003 - SWDB 9/27/2021) Name Count Percent Total Group Quarters Population: 12,740 100.00% Institutionalized population: 6,917 54.29% Correctional facilities for adults 4,380 34.38% Juvenile facilities 117 0.92% Nursing facilities/Skilled-nursing facilities 2,328 18.27% Other institutional facilities 92 0.72% Noninstitutionalized population: 5,823 45.71% College/University student housing 2,589 20.32% Military quarters 0 0.00% Other noninstitutional facilities 3,234 25.38%
2019-2023 ACS Citizen Population (adj Elec. §21003 - SWDB 7/16/2025) Name Count Percent Total Citizen Population (CITZ) 673,093 100.00% CITZ Hispanic or Latino 396,402 58.89% CITZ Not Hispanic or Latino (NH) 276,743 41.12% CITZ NH White alone 134,862 20.04% CITZ NH Black or African American Alone 73,306 10.89% CITZ NH Asian Alone 45,279 6.73% CITZ NH American Indian and Alaska Native Alone 1,381 0.21% CITZ NH Native Hawaiian and Other Pacific Islander alone 2,109 0.31% CITZ NH Black or African American and White 7,303 1.08% CITZ NH American Indian or Alaska Native and White 5,272 0.78% CITZ NH Asian and White 2,032 0.30% CITZ NH American Indian or Alaska Native and Black or African American 1,126 0.17% CITZ NH Remainder of Two or More Race 4,128 0.61% CITZ DOJ NH Black or African American 80,609 11.98% CITZ DOJ NH Asian 50,551 7.51% CITZ DOJ NH American Indian and Alaska Native 3,413 0.51%
2019-2023 ACS Citizen Voting Age Population (adj Elec. §21003 - SWDB 7/16/2025) Name Count Percent Total Citizen Voting Age Population (CVAP) 475,755 100.00% CVAP Hispanic or Latino 259,509 54.55% CVAP Not Hispanic or Latino (NH) 216,260 45.46% CVAP NH White alone 111,138 23.36% CVAP NH Black or African American Alone 57,090 12.00% CVAP NH Asian Alone 33,960 7.14% CVAP NH American Indian and Alaska Native Alone 1,146 0.24% CVAP NH Native Hawaiian and Other Pacific Islander alone 1,528 0.32% CVAP NH Black or African American and White 3,694 0.78% CVAP NH Asian and White 2,906 0.61% CVAP NH American Indian or Alaska Native and White 1,387 0.29% CVAP NH American Indian or Alaska Native and Black or African American 789 0.17% CVAP NH Remainder of Two or More Race 2,571 0.54% CVAP DOJ NH Black or African American 60,784 12.78% CVAP DOJ NH Asian 36,866 7.75% CVAP DOJ NH American Indian and Alaska Native 2,533 0.53%
Counties In District Name Count Percent Riverside 10,287 0.43% San Bernardino 749,775 34.39%
Places In District Name Count Percent RIVERSIDE: Highgrove(U) 7,544 100.00% RIVERSIDE: Remainder of Riverside(R) 2,743 3.53% SAN BERNARDINO: Colton(C) 54,129 100.00% SAN BERNARDINO: Fontana(C) 100,639 48.14% SAN BERNARDINO: Grand Terrace(C) 13,185 100.00% SAN BERNARDINO: Highland(C) 57,232 100.00% SAN BERNARDINO: Muscoy(U) 10,774 100.00% SAN BERNARDINO: Rancho Cucamonga(C) 92,559 52.95% SAN BERNARDINO: Redlands(C) 62,341 84.95% SAN BERNARDINO: Rialto(C) 104,458 100.00% SAN BERNARDINO: San Bernardino(C) 212,910 95.39% SAN BERNARDINO: Remainder of San Bernardino(R) 41,548 34.26%
Senate Office of Demographics 02/2026