This Congressional district was established by the voters of California with the passage of Proposition 50 (2025) on November 4, 2025 and will go into effect after the November 2026 elections and upon seating of the 120th Congress, January 3, 2027. This district will stay in use until the California Citizens Redistricting Commission draws new maps following the 2030 U.S. Census .
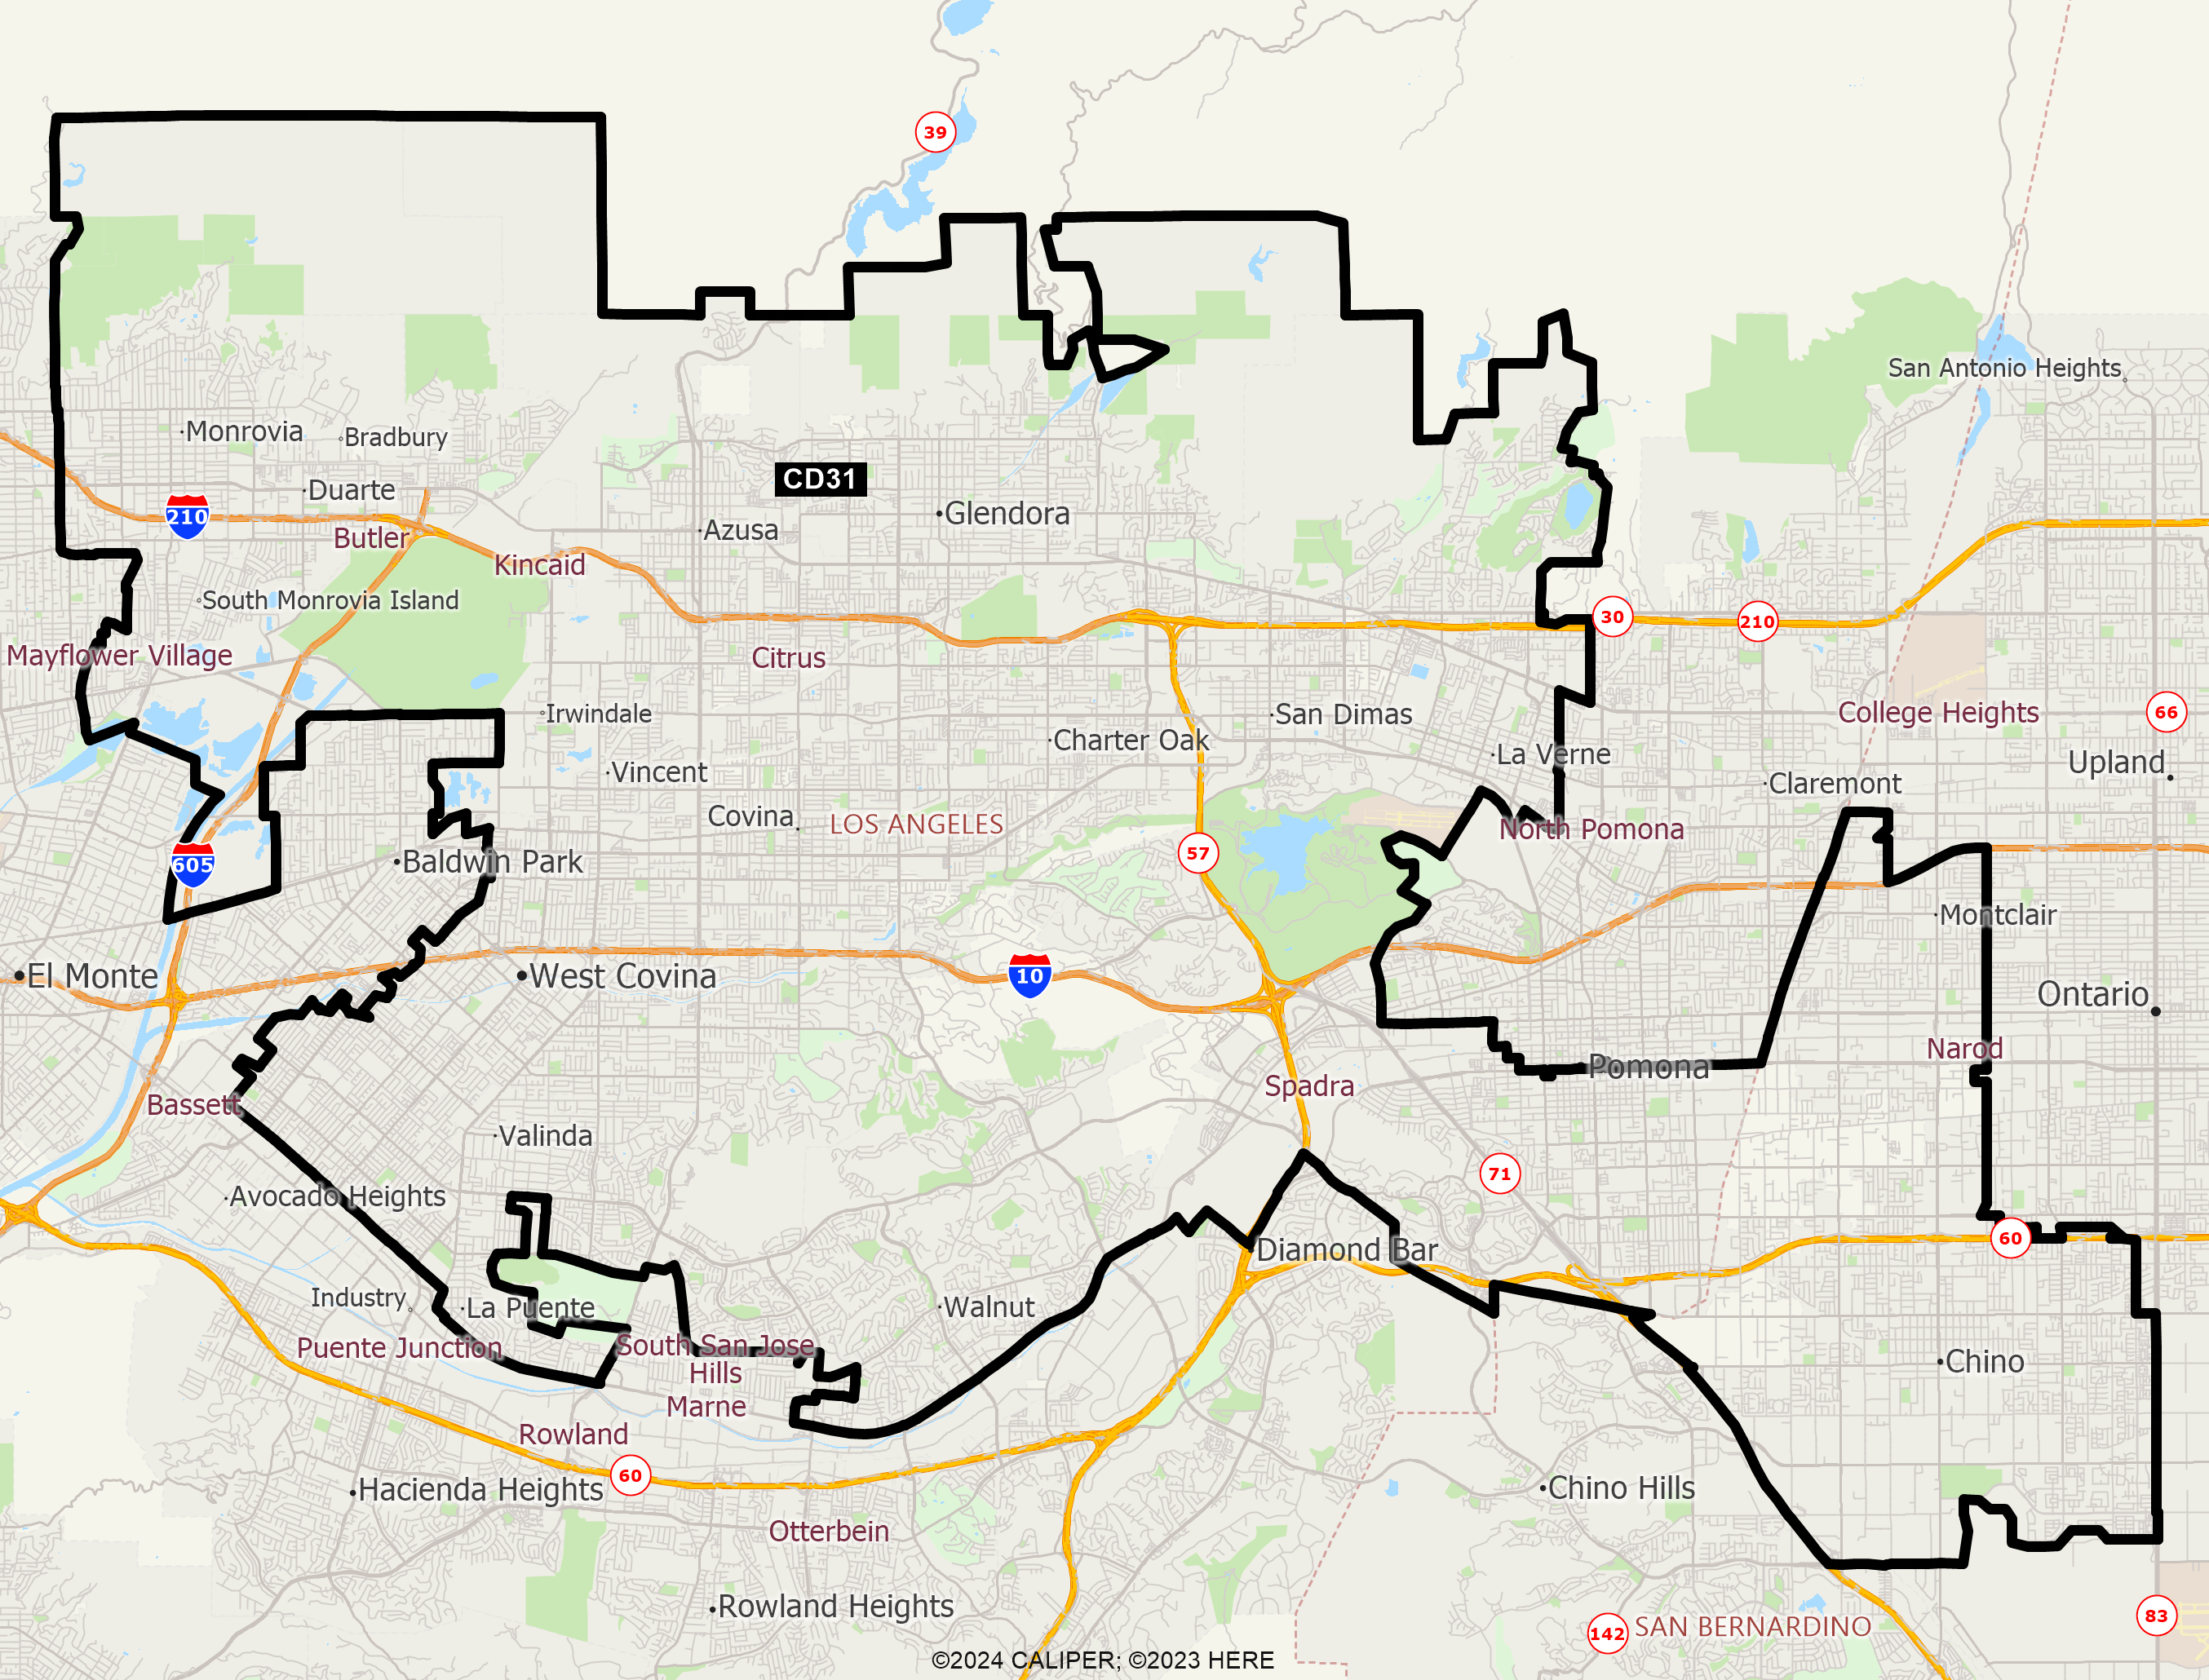
DISTRICT CD31
2020 Census Population (adj Elec. §21003 - SWDB 9/27/2021) Name Count Percent Total Population (POP) 760,066 100.00% POP Hispanic or Latino 429,185 56.47% POP Not Hispanic or Latino (NH) 330,881 43.53% POP NH Population of one race 313,576 41.26% POP NH White alone 142,414 18.74% POP NH Black or African American alone 24,570 3.23% POP NH Asian alone 140,443 18.48% POP NH American Indian and Alaska Native alone 1,617 0.21% POP NH Native Hawaiian and Other Pacific Islander alone 871 0.11% POP NH Some Other Race alone 3,661 0.48% POP NH Population of two or more races 17,305 2.28% POP DOJ NH Black or African American 26,753 3.52% POP DOJ NH Asian 146,610 19.29% POP DOJ NH American Indian and Alaska Native 3,998 0.53% POP DOJ NH Native Hawaiian and Other Pacific Islander 1,159 0.15% POP DOJ NH Some Other Race 5,728 0.75% POP DOJ NH Balance of Population of two or more races 4,219 0.56%
2020 Census Voting Age Population (adj Elec. §21003 - SWDB 9/27/2021) Name Count Percent Total Voting Age Population (VAP) 600,547 100.00% VAP Hispanic or Latino 319,670 53.23% VAP Not Hispanic or Latino (NH) 280,877 46.77% VAP NH Population of one race 268,759 44.75% VAP NH White alone 125,142 20.84% VAP NH Black or African American alone 20,735 3.45% VAP NH Asian alone 118,150 19.67% VAP NH American Indian and Alaska Native alone 1,390 0.23% VAP NH Native Hawaiian and Other Pacific Islander alone 731 0.12% VAP NH Some Other Race alone 2,611 0.43% VAP NH Population of two or more races 12,118 2.02% VAP DOJ NH Black or African American 22,183 3.69% VAP DOJ NH Asian 121,883 20.30% VAP DOJ NH American Indian and Alaska Native 3,425 0.57% VAP DOJ NH Native Hawaiian and Other Pacific Islander 960 0.16% VAP DOJ NH Some Other Race 4,259 0.71% VAP DOJ NH Balance of Population of two or more races 3,025 0.50%
2020 Census Housing Occupancy Status Name Count Percent Total Housing Units 237,248 100.00% Occupied 230,089 96.98% Vacant 7,159 3.02%
2020 Census Group Quarters Population (adj Elec. §21003 - SWDB 9/27/2021) Name Count Percent Total Group Quarters Population: 11,812 100.00% Institutionalized population: 2,974 25.18% Correctional facilities for adults 0 0.00% Juvenile facilities 177 1.50% Nursing facilities/Skilled-nursing facilities 2,760 23.37% Other institutional facilities 37 0.31% Noninstitutionalized population: 8,838 74.82% College/University student housing 5,887 49.84% Military quarters 0 0.00% Other noninstitutional facilities 2,951 24.98%
2019-2023 ACS Citizen Population (adj Elec. §21003 - SWDB 7/16/2025) Name Count Percent Total Citizen Population (CITZ) 656,058 100.00% CITZ Hispanic or Latino 368,474 56.16% CITZ Not Hispanic or Latino (NH) 287,644 43.84% CITZ NH White alone 131,828 20.09% CITZ NH Black or African American Alone 26,561 4.05% CITZ NH Asian Alone 110,797 16.89% CITZ NH American Indian and Alaska Native Alone 2,123 0.32% CITZ NH Native Hawaiian and Other Pacific Islander alone 1,242 0.19% CITZ NH Black or African American and White 3,308 0.50% CITZ NH American Indian or Alaska Native and White 6,932 1.06% CITZ NH Asian and White 1,598 0.24% CITZ NH American Indian or Alaska Native and Black or African American 263 0.04% CITZ NH Remainder of Two or More Race 2,993 0.46% CITZ DOJ NH Black or African American 29,869 4.55% CITZ DOJ NH Asian 117,729 17.94% CITZ DOJ NH American Indian and Alaska Native 3,721 0.57%
2019-2023 ACS Citizen Voting Age Population (adj Elec. §21003 - SWDB 7/16/2025) Name Count Percent Total Citizen Voting Age Population (CVAP) 502,061 100.00% CVAP Hispanic or Latino 262,046 52.19% CVAP Not Hispanic or Latino (NH) 240,031 47.81% CVAP NH White alone 115,404 22.99% CVAP NH Black or African American Alone 22,703 4.52% CVAP NH Asian Alone 89,858 17.90% CVAP NH American Indian and Alaska Native Alone 1,883 0.38% CVAP NH Native Hawaiian and Other Pacific Islander alone 967 0.19% CVAP NH Black or African American and White 1,922 0.38% CVAP NH Asian and White 3,594 0.72% CVAP NH American Indian or Alaska Native and White 1,407 0.28% CVAP NH American Indian or Alaska Native and Black or African American 220 0.04% CVAP NH Remainder of Two or More Race 2,074 0.41% CVAP DOJ NH Black or African American 24,625 4.90% CVAP DOJ NH Asian 93,452 18.61% CVAP DOJ NH American Indian and Alaska Native 3,290 0.66%
Counties In District Name Count Percent Los Angeles 638,351 6.35% San Bernardino 121,717 5.58%
Places In District Name Count Percent LOS ANGELES: Azusa(C) 50,204 100.00% LOS ANGELES: Bradbury(C) 925 100.00% LOS ANGELES: Charter Oak(U) 9,771 100.00% LOS ANGELES: Citrus(U) 10,279 100.00% LOS ANGELES: Covina(C) 51,445 100.00% LOS ANGELES: Duarte(C) 21,798 100.00% LOS ANGELES: Glendora(C) 52,725 100.00% LOS ANGELES: Irwindale(C) 1,483 100.00% LOS ANGELES: La Puente(C) 38,278 100.00% LOS ANGELES: La Verne(C) 31,425 100.00% LOS ANGELES: Mayflower Village(U) 5,418 100.00% LOS ANGELES: Monrovia(C) 38,048 100.00% LOS ANGELES: Pomona(C) 72,157 47.30% LOS ANGELES: San Dimas(C) 35,020 100.00% LOS ANGELES: South Monrovia Island(U) 6,551 100.00% LOS ANGELES: South San Jose Hills(U) 175 0.88% LOS ANGELES: Valinda(U) 22,515 100.00% LOS ANGELES: Vincent(U) 15,766 100.00% LOS ANGELES: Walnut(C) 28,488 100.00% LOS ANGELES: West Covina(C) 109,856 100.00% LOS ANGELES: West Puente Valley(U) 22,962 99.57% LOS ANGELES: Remainder of Los Angeles(R) 13,062 14.91% SAN BERNARDINO: Chino(C) 72,869 84.17% SAN BERNARDINO: Montclair(C) 36,252 95.43% SAN BERNARDINO: Remainder of San Bernardino(R) 12,596 10.39%
Senate Office of Demographics 02/2026