This Congressional district was established by the voters of California with the passage of Proposition 50 (2025) on November 4, 2025 and will go into effect after the November 2026 elections and upon seating of the 120th Congress, January 3, 2027. This district will stay in use until the California Citizens Redistricting Commission draws new maps following the 2030 U.S. Census .
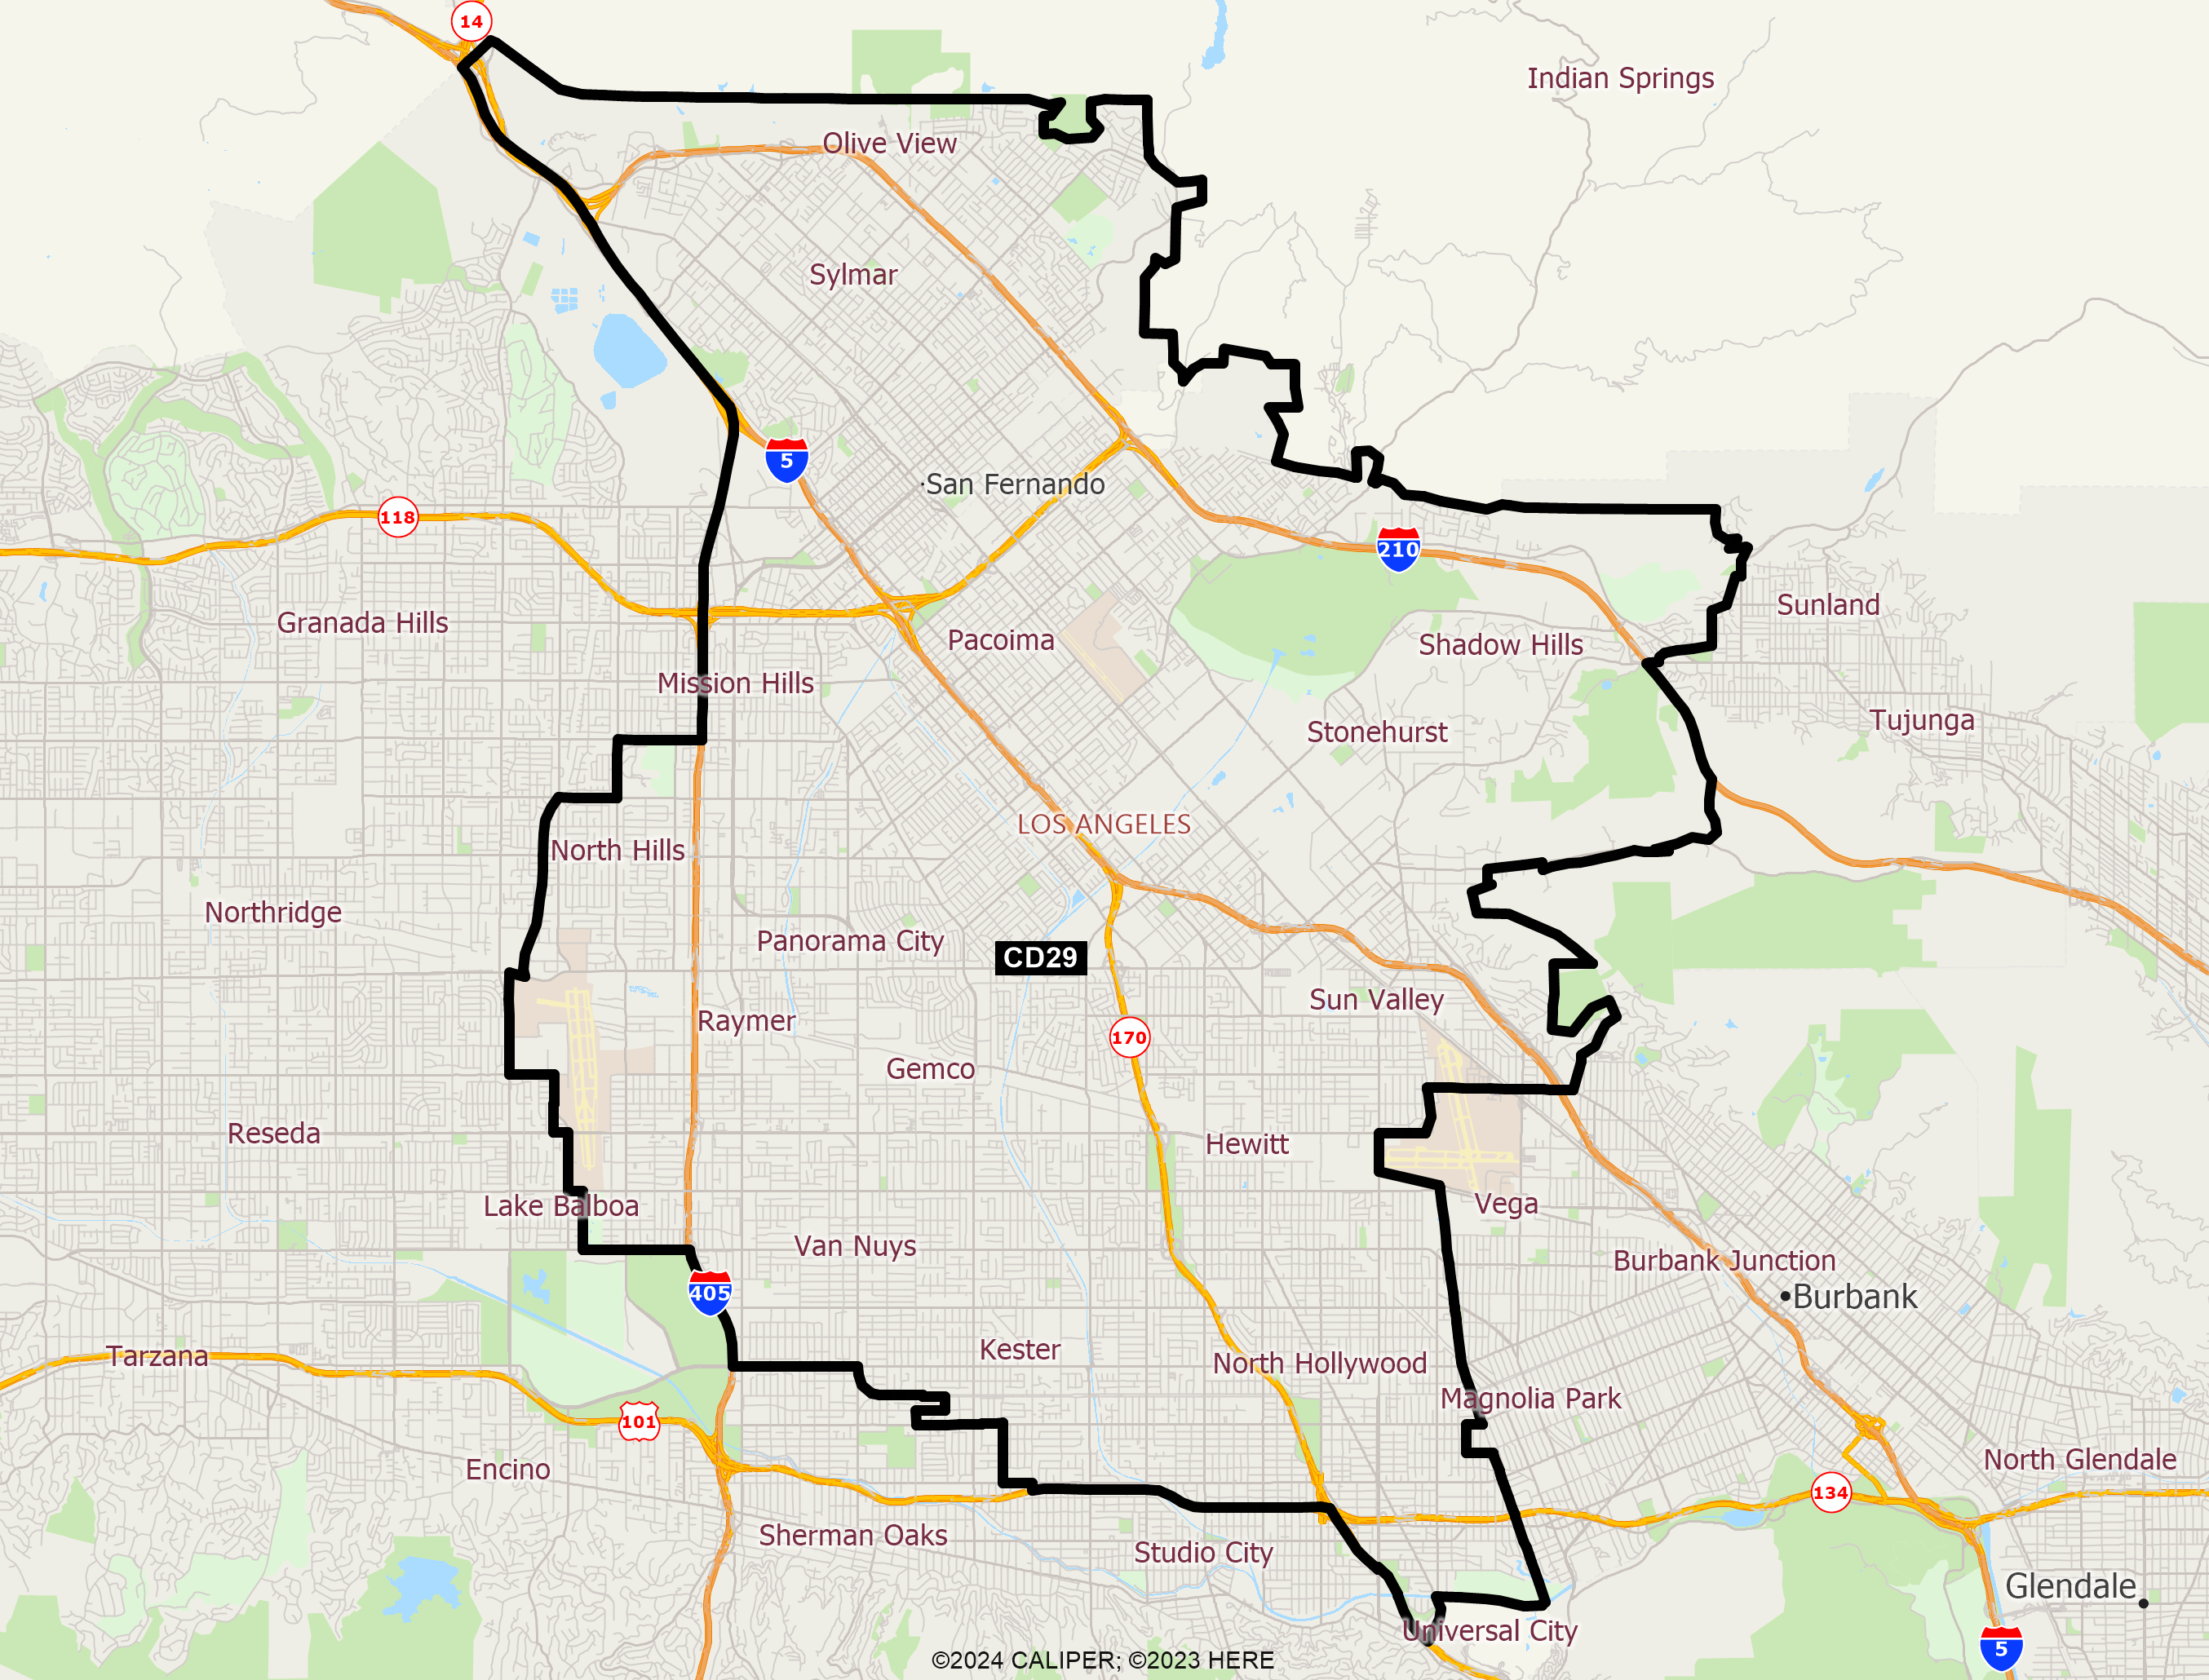
DISTRICT CD29
2020 Census Population (adj Elec. §21003 - SWDB 9/27/2021) Name Count Percent Total Population (POP) 760,066 100.00% POP Hispanic or Latino 477,560 62.83% POP Not Hispanic or Latino (NH) 282,506 37.17% POP NH Population of one race 266,938 35.12% POP NH White alone 173,399 22.81% POP NH Black or African American alone 29,011 3.82% POP NH Asian alone 58,158 7.65% POP NH American Indian and Alaska Native alone 1,239 0.16% POP NH Native Hawaiian and Other Pacific Islander alone 684 0.09% POP NH Some Other Race alone 4,447 0.59% POP NH Population of two or more races 15,568 2.05% POP DOJ NH Black or African American 31,663 4.17% POP DOJ NH Asian 63,055 8.30% POP DOJ NH American Indian and Alaska Native 3,092 0.41% POP DOJ NH Native Hawaiian and Other Pacific Islander 902 0.12% POP DOJ NH Some Other Race 6,459 0.85% POP DOJ NH Balance of Population of two or more races 3,936 0.52%
2020 Census Voting Age Population (adj Elec. §21003 - SWDB 9/27/2021) Name Count Percent Total Voting Age Population (VAP) 597,438 100.00% VAP Hispanic or Latino 355,918 59.57% VAP Not Hispanic or Latino (NH) 241,520 40.43% VAP NH Population of one race 230,014 38.50% VAP NH White alone 149,683 25.05% VAP NH Black or African American alone 24,964 4.18% VAP NH Asian alone 50,651 8.48% VAP NH American Indian and Alaska Native alone 1,045 0.17% VAP NH Native Hawaiian and Other Pacific Islander alone 580 0.10% VAP NH Some Other Race alone 3,091 0.52% VAP NH Population of two or more races 11,506 1.93% VAP DOJ NH Black or African American 26,848 4.49% VAP DOJ NH Asian 54,064 9.05% VAP DOJ NH American Indian and Alaska Native 2,640 0.44% VAP DOJ NH Native Hawaiian and Other Pacific Islander 746 0.12% VAP DOJ NH Some Other Race 4,741 0.79% VAP DOJ NH Balance of Population of two or more races 2,798 0.47%
2020 Census Housing Occupancy Status Name Count Percent Total Housing Units 244,154 100.00% Occupied 236,082 96.69% Vacant 8,072 3.31%
2020 Census Group Quarters Population (adj Elec. §21003 - SWDB 9/27/2021) Name Count Percent Total Group Quarters Population: 11,730 100.00% Institutionalized population: 3,582 30.54% Correctional facilities for adults 79 0.67% Juvenile facilities 283 2.41% Nursing facilities/Skilled-nursing facilities 3,153 26.88% Other institutional facilities 67 0.57% Noninstitutionalized population: 8,148 69.46% College/University student housing 248 2.11% Military quarters 0 0.00% Other noninstitutional facilities 7,900 67.35%
2019-2023 ACS Citizen Population (adj Elec. §21003 - SWDB 7/16/2025) Name Count Percent Total Citizen Population (CITZ) 600,979 100.00% CITZ Hispanic or Latino 353,897 58.89% CITZ Not Hispanic or Latino (NH) 247,030 41.10% CITZ NH White alone 155,358 25.85% CITZ NH Black or African American Alone 28,993 4.82% CITZ NH Asian Alone 46,787 7.79% CITZ NH American Indian and Alaska Native Alone 1,263 0.21% CITZ NH Native Hawaiian and Other Pacific Islander alone 864 0.14% CITZ NH Black or African American and White 3,350 0.56% CITZ NH American Indian or Alaska Native and White 5,113 0.85% CITZ NH Asian and White 1,822 0.30% CITZ NH American Indian or Alaska Native and Black or African American 412 0.07% CITZ NH Remainder of Two or More Race 3,062 0.51% CITZ DOJ NH Black or African American 32,343 5.38% CITZ DOJ NH Asian 51,900 8.64% CITZ DOJ NH American Indian and Alaska Native 3,085 0.51%
2019-2023 ACS Citizen Voting Age Population (adj Elec. §21003 - SWDB 7/16/2025) Name Count Percent Total Citizen Voting Age Population (CVAP) 452,149 100.00% CVAP Hispanic or Latino 242,495 53.63% CVAP Not Hispanic or Latino (NH) 209,632 46.36% CVAP NH White alone 133,576 29.54% CVAP NH Black or African American Alone 25,082 5.55% CVAP NH Asian Alone 39,678 8.78% CVAP NH American Indian and Alaska Native Alone 1,154 0.26% CVAP NH Native Hawaiian and Other Pacific Islander alone 658 0.15% CVAP NH Black or African American and White 2,279 0.50% CVAP NH Asian and White 2,773 0.61% CVAP NH American Indian or Alaska Native and White 1,510 0.33% CVAP NH American Indian or Alaska Native and Black or African American 392 0.09% CVAP NH Remainder of Two or More Race 2,478 0.55% CVAP DOJ NH Black or African American 27,361 6.05% CVAP DOJ NH Asian 42,451 9.39% CVAP DOJ NH American Indian and Alaska Native 2,664 0.59%
Counties In District Name Count Percent Los Angeles 760,062 7.56%
Places In District Name Count Percent LOS ANGELES: Los Angeles(C) 735,380 18.80% LOS ANGELES: San Fernando(C) 24,055 100.00% LOS ANGELES: Remainder of Los Angeles(R) 627 0.72%
Senate Office of Demographics 02/2026