This Congressional district was established by the voters of California with the passage of Proposition 50 (2025) on November 4, 2025 and will go into effect after the November 2026 elections and upon seating of the 120th Congress, January 3, 2027. This district will stay in use until the California Citizens Redistricting Commission draws new maps following the 2030 U.S. Census .
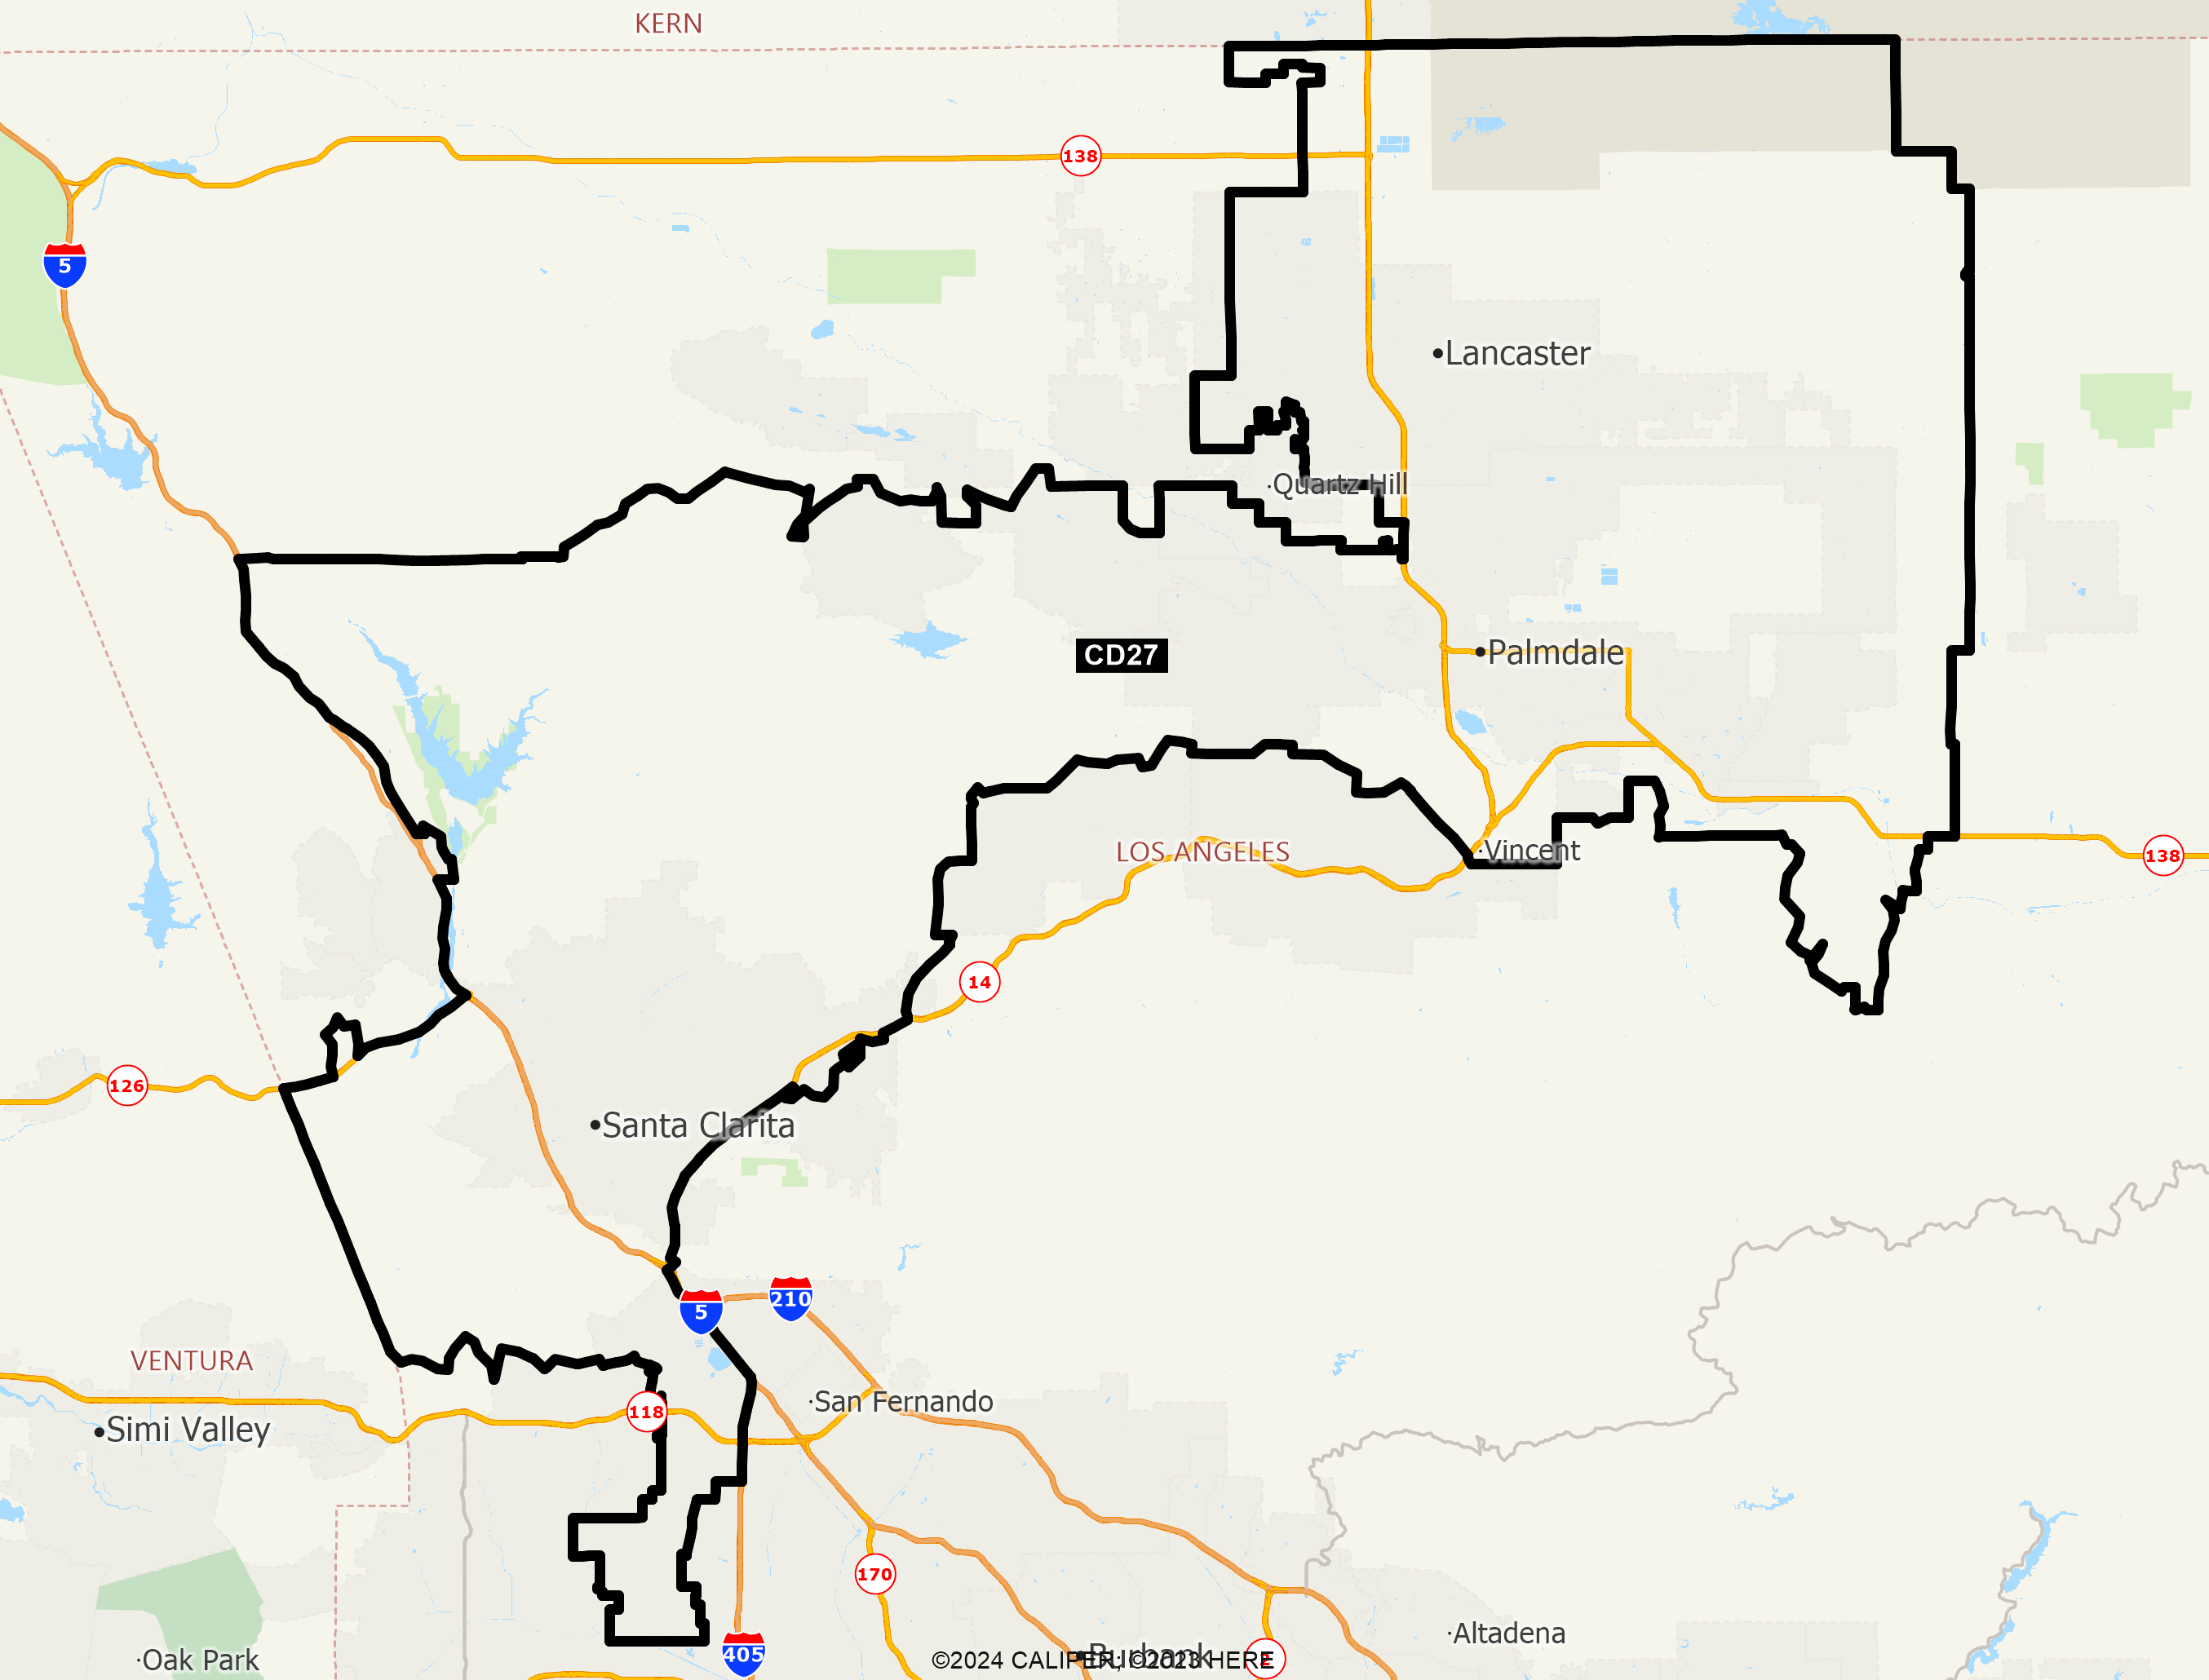
DISTRICT CD27
2020 Census Population (adj Elec. §21003 - SWDB 9/27/2021) Name Count Percent Total Population (POP) 760,067 100.00% POP Hispanic or Latino 346,015 45.52% POP Not Hispanic or Latino (NH) 414,052 54.48% POP NH Population of one race 385,173 50.68% POP NH White alone 236,158 31.07% POP NH Black or African American alone 73,800 9.71% POP NH Asian alone 67,289 8.85% POP NH American Indian and Alaska Native alone 1,938 0.25% POP NH Native Hawaiian and Other Pacific Islander alone 1,009 0.13% POP NH Some Other Race alone 4,979 0.66% POP NH Population of two or more races 28,879 3.80% POP DOJ NH Black or African American 79,596 10.47% POP DOJ NH Asian 75,530 9.94% POP DOJ NH American Indian and Alaska Native 6,099 0.80% POP DOJ NH Native Hawaiian and Other Pacific Islander 1,483 0.20% POP DOJ NH Some Other Race 8,315 1.09% POP DOJ NH Balance of Population of two or more races 6,871 0.90%
2020 Census Voting Age Population (adj Elec. §21003 - SWDB 9/27/2021) Name Count Percent Total Voting Age Population (VAP) 573,611 100.00% VAP Hispanic or Latino 243,195 42.40% VAP Not Hispanic or Latino (NH) 330,416 57.60% VAP NH Population of one race 311,578 54.32% VAP NH White alone 197,190 34.38% VAP NH Black or African American alone 54,090 9.43% VAP NH Asian alone 54,536 9.51% VAP NH American Indian and Alaska Native alone 1,543 0.27% VAP NH Native Hawaiian and Other Pacific Islander alone 804 0.14% VAP NH Some Other Race alone 3,415 0.60% VAP NH Population of two or more races 18,838 3.28% VAP DOJ NH Black or African American 57,248 9.98% VAP DOJ NH Asian 59,221 10.32% VAP DOJ NH American Indian and Alaska Native 4,999 0.87% VAP DOJ NH Native Hawaiian and Other Pacific Islander 1,141 0.20% VAP DOJ NH Some Other Race 6,032 1.05% VAP DOJ NH Balance of Population of two or more races 4,585 0.80%
2020 Census Housing Occupancy Status Name Count Percent Total Housing Units 244,265 100.00% Occupied 237,031 97.04% Vacant 7,234 2.96%
2020 Census Group Quarters Population (adj Elec. §21003 - SWDB 9/27/2021) Name Count Percent Total Group Quarters Population: 10,256 100.00% Institutionalized population: 6,910 67.38% Correctional facilities for adults 5,606 54.66% Juvenile facilities 118 1.15% Nursing facilities/Skilled-nursing facilities 1,014 9.89% Other institutional facilities 172 1.68% Noninstitutionalized population: 3,346 32.62% College/University student housing 849 8.28% Military quarters 0 0.00% Other noninstitutional facilities 2,497 24.35%
2019-2023 ACS Citizen Population (adj Elec. §21003 - SWDB 7/16/2025) Name Count Percent Total Citizen Population (CITZ) 676,553 100.00% CITZ Hispanic or Latino 297,870 44.03% CITZ Not Hispanic or Latino (NH) 378,796 55.99% CITZ NH White alone 222,540 32.89% CITZ NH Black or African American Alone 74,890 11.07% CITZ NH Asian Alone 56,022 8.28% CITZ NH American Indian and Alaska Native Alone 2,003 0.30% CITZ NH Native Hawaiian and Other Pacific Islander alone 1,203 0.18% CITZ NH Black or African American and White 6,566 0.97% CITZ NH American Indian or Alaska Native and White 7,521 1.11% CITZ NH Asian and White 2,444 0.36% CITZ NH American Indian or Alaska Native and Black or African American 772 0.11% CITZ NH Remainder of Two or More Race 4,677 0.69% CITZ DOJ NH Black or African American 81,456 12.04% CITZ DOJ NH Asian 63,543 9.39% CITZ DOJ NH American Indian and Alaska Native 4,447 0.66%
2019-2023 ACS Citizen Voting Age Population (adj Elec. §21003 - SWDB 7/16/2025) Name Count Percent Total Citizen Voting Age Population (CVAP) 491,708 100.00% CVAP Hispanic or Latino 194,051 39.46% CVAP Not Hispanic or Latino (NH) 297,621 60.53% CVAP NH White alone 184,063 37.43% CVAP NH Black or African American Alone 54,223 11.03% CVAP NH Asian Alone 44,810 9.11% CVAP NH American Indian and Alaska Native Alone 1,112 0.23% CVAP NH Native Hawaiian and Other Pacific Islander alone 1,032 0.21% CVAP NH Black or African American and White 2,937 0.60% CVAP NH Asian and White 3,869 0.79% CVAP NH American Indian or Alaska Native and White 2,057 0.42% CVAP NH American Indian or Alaska Native and Black or African American 636 0.13% CVAP NH Remainder of Two or More Race 2,780 0.57% CVAP DOJ NH Black or African American 57,160 11.62% CVAP DOJ NH Asian 48,679 9.90% CVAP DOJ NH American Indian and Alaska Native 3,169 0.64%
Counties In District Name Count Percent Los Angeles 760,065 7.56%
Places In District Name Count Percent LOS ANGELES: Desert View Highlands(U) 2,692 100.00% LOS ANGELES: Green Valley(U) 1,038 100.00% LOS ANGELES: Lancaster(C) 162,707 94.88% LOS ANGELES: Leona Valley(U) 1,558 100.00% LOS ANGELES: Littlerock(U) 1,583 100.00% LOS ANGELES: Los Angeles(C) 143,764 3.67% LOS ANGELES: Palmdale(C) 170,394 100.00% LOS ANGELES: Santa Clarita(C) 220,587 96.26% LOS ANGELES: Stevenson Ranch(U) 20,211 100.00% LOS ANGELES: Sun Village(U) 12,369 100.00% LOS ANGELES: Remainder of Los Angeles(R) 23,162 26.43%
Senate Office of Demographics 02/2026