This Congressional district was established by the voters of California with the passage of Proposition 50 (2025) on November 4, 2025 and will go into effect after the November 2026 elections and upon seating of the 120th Congress, January 3, 2027. This district will stay in use until the California Citizens Redistricting Commission draws new maps following the 2030 U.S. Census .
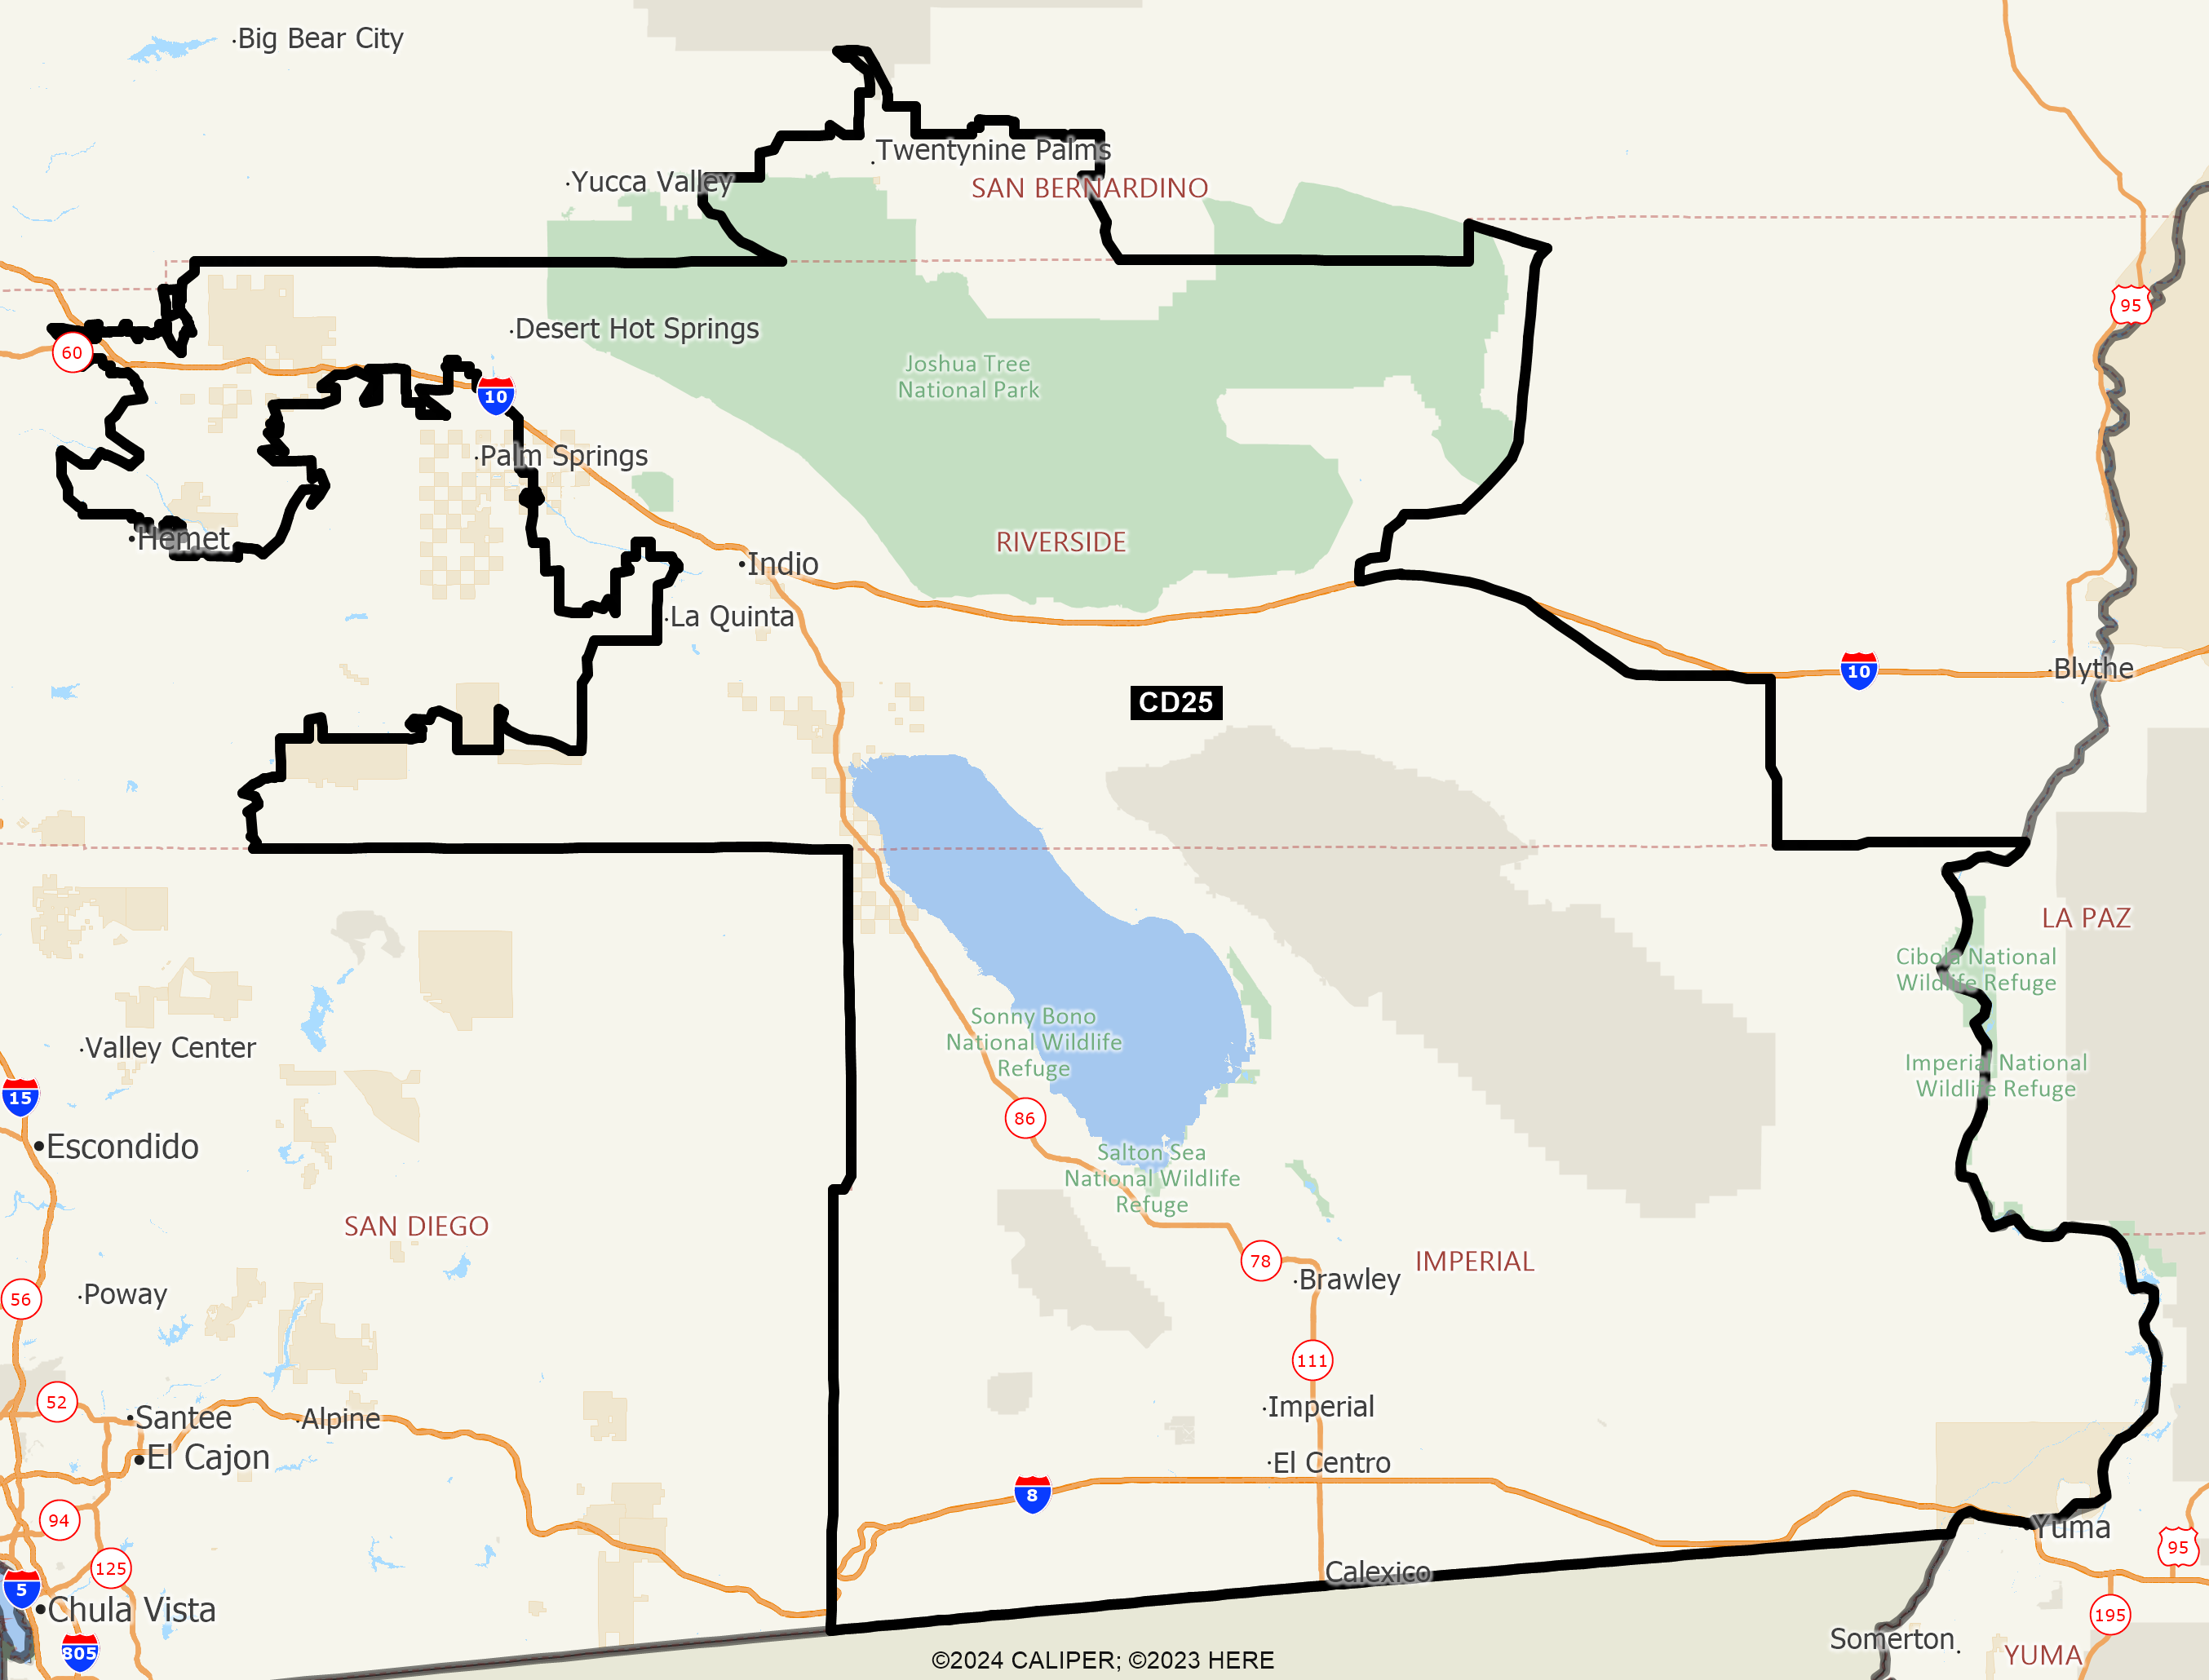
DISTRICT CD25
2020 Census Population (adj Elec. §21003 - SWDB 9/27/2021) Name Count Percent Total Population (POP) 760,066 100.00% POP Hispanic or Latino 464,876 61.16% POP Not Hispanic or Latino (NH) 295,190 38.84% POP NH Population of one race 277,537 36.51% POP NH White alone 217,879 28.67% POP NH Black or African American alone 25,513 3.36% POP NH Asian alone 23,690 3.12% POP NH American Indian and Alaska Native alone 6,014 0.79% POP NH Native Hawaiian and Other Pacific Islander alone 1,153 0.15% POP NH Some Other Race alone 3,288 0.43% POP NH Population of two or more races 17,653 2.32% POP DOJ NH Black or African American 28,702 3.78% POP DOJ NH Asian 27,258 3.59% POP DOJ NH American Indian and Alaska Native 10,408 1.37% POP DOJ NH Native Hawaiian and Other Pacific Islander 1,588 0.21% POP DOJ NH Some Other Race 6,024 0.79% POP DOJ NH Balance of Population of two or more races 3,331 0.44%
2020 Census Voting Age Population (adj Elec. §21003 - SWDB 9/27/2021) Name Count Percent Total Voting Age Population (VAP) 575,690 100.00% VAP Hispanic or Latino 323,223 56.15% VAP Not Hispanic or Latino (NH) 252,467 43.85% VAP NH Population of one race 240,306 41.74% VAP NH White alone 192,990 33.52% VAP NH Black or African American alone 19,826 3.44% VAP NH Asian alone 19,974 3.47% VAP NH American Indian and Alaska Native alone 4,391 0.76% VAP NH Native Hawaiian and Other Pacific Islander alone 847 0.15% VAP NH Some Other Race alone 2,278 0.40% VAP NH Population of two or more races 12,161 2.11% VAP DOJ NH Black or African American 21,521 3.74% VAP DOJ NH Asian 22,114 3.84% VAP DOJ NH American Indian and Alaska Native 8,025 1.39% VAP DOJ NH Native Hawaiian and Other Pacific Islander 1,099 0.19% VAP DOJ NH Some Other Race 4,519 0.78% VAP DOJ NH Balance of Population of two or more races 2,199 0.38%
2020 Census Housing Occupancy Status Name Count Percent Total Housing Units 305,219 100.00% Occupied 254,197 83.28% Vacant 51,022 16.72%
2020 Census Group Quarters Population (adj Elec. §21003 - SWDB 9/27/2021) Name Count Percent Total Group Quarters Population: 14,201 100.00% Institutionalized population: 4,637 32.65% Correctional facilities for adults 2,267 15.96% Juvenile facilities 74 0.52% Nursing facilities/Skilled-nursing facilities 2,093 14.74% Other institutional facilities 203 1.43% Noninstitutionalized population: 9,564 67.35% College/University student housing 18 0.13% Military quarters 6,447 45.40% Other noninstitutional facilities 3,099 21.82%
2019-2023 ACS Citizen Population (adj Elec. §21003 - SWDB 7/16/2025) Name Count Percent Total Citizen Population (CITZ) 674,052 100.00% CITZ Hispanic or Latino 395,603 58.69% CITZ Not Hispanic or Latino (NH) 278,344 41.29% CITZ NH White alone 213,358 31.65% CITZ NH Black or African American Alone 26,068 3.87% CITZ NH Asian Alone 18,346 2.72% CITZ NH American Indian and Alaska Native Alone 3,887 0.58% CITZ NH Native Hawaiian and Other Pacific Islander alone 1,342 0.20% CITZ NH Black or African American and White 4,450 0.66% CITZ NH American Indian or Alaska Native and White 3,539 0.53% CITZ NH Asian and White 3,651 0.54% CITZ NH American Indian or Alaska Native and Black or African American 700 0.10% CITZ NH Remainder of Two or More Race 2,684 0.40% CITZ DOJ NH Black or African American 30,518 4.53% CITZ DOJ NH Asian 21,885 3.25% CITZ DOJ NH American Indian and Alaska Native 7,538 1.12%
2019-2023 ACS Citizen Voting Age Population (adj Elec. §21003 - SWDB 7/16/2025) Name Count Percent Total Citizen Voting Age Population (CVAP) 494,546 100.00% CVAP Hispanic or Latino 257,693 52.11% CVAP Not Hispanic or Latino (NH) 236,545 47.83% CVAP NH White alone 187,426 37.90% CVAP NH Black or African American Alone 20,476 4.14% CVAP NH Asian Alone 14,997 3.03% CVAP NH American Indian and Alaska Native Alone 3,051 0.62% CVAP NH Native Hawaiian and Other Pacific Islander alone 926 0.19% CVAP NH Black or African American and White 2,171 0.44% CVAP NH Asian and White 2,046 0.41% CVAP NH American Indian or Alaska Native and White 2,947 0.60% CVAP NH American Indian or Alaska Native and Black or African American 440 0.09% CVAP NH Remainder of Two or More Race 1,819 0.37% CVAP DOJ NH Black or African American 22,647 4.58% CVAP DOJ NH Asian 17,043 3.45% CVAP DOJ NH American Indian and Alaska Native 5,998 1.21%
Counties In District Name Count Percent Imperial 173,628 100.00% Riverside 557,833 23.08% San Bernardino 28,604 1.31%
Places In District Name Count Percent IMPERIAL: Bombay Beach(U) 232 100.00% IMPERIAL: Brawley(C) 26,482 100.00% IMPERIAL: Calexico(C) 38,692 100.00% IMPERIAL: Calipatria(C) 3,618 100.00% IMPERIAL: Desert Shores(U) 1,129 100.00% IMPERIAL: El Centro(C) 44,439 100.00% IMPERIAL: El Centro Naval Air Facility(U) 280 100.00% IMPERIAL: Heber(U) 6,909 100.00% IMPERIAL: Holtville(C) 5,612 100.00% IMPERIAL: Imperial(C) 20,287 100.00% IMPERIAL: Niland(U) 757 100.00% IMPERIAL: Ocotillo(U) 217 100.00% IMPERIAL: Palo Verde(U) 152 100.00% IMPERIAL: Salton City(U) 5,168 100.00% IMPERIAL: Salton Sea Beach(U) 509 100.00% IMPERIAL: Seeley(U) 1,732 100.00% IMPERIAL: Westmorland(C) 2,018 100.00% IMPERIAL: Winterhaven(U) 391 100.00% IMPERIAL: Remainder of Imperial(R) 15,004 100.00% RIVERSIDE: Banning(C) 29,691 100.00% RIVERSIDE: Beaumont(C) 53,193 100.00% RIVERSIDE: Bermuda Dunes(U) 8,266 100.00% RIVERSIDE: Cabazon(U) 2,648 100.00% RIVERSIDE: Cathedral City(C) 51,683 100.00% RIVERSIDE: Cherry Valley(U) 0 0.00% RIVERSIDE: Coachella(C) 42,128 100.00% RIVERSIDE: Desert Edge(U) 4,188 100.00% RIVERSIDE: Desert Hot Springs(C) 32,747 100.00% RIVERSIDE: Desert Palms(U) 6,699 100.00% RIVERSIDE: East Hemet(U) 531 2.72% RIVERSIDE: Garnet(U) 7,147 100.00% RIVERSIDE: Indio(C) 89,518 100.00% RIVERSIDE: Indio Hills(U) 1,050 100.00% RIVERSIDE: La Quinta(C) 37,641 100.00% RIVERSIDE: Mecca(U) 8,244 100.00% RIVERSIDE: North Shore(U) 3,600 100.00% RIVERSIDE: Oasis(U) 4,484 100.00% RIVERSIDE: Palm Desert(C) 51,317 100.00% RIVERSIDE: Rancho Mirage(C) 17,049 100.00% RIVERSIDE: San Jacinto(C) 54,192 100.00% RIVERSIDE: Sky Valley(U) 2,420 100.00% RIVERSIDE: Thermal(U) 2,700 100.00% RIVERSIDE: Thousand Palms(U) 8,005 100.00% RIVERSIDE: Valle Vista(U) 16,262 100.00% RIVERSIDE: Vista Santa Rosa(U) 2,625 100.00% RIVERSIDE: Whitewater(U) 991 100.00% RIVERSIDE: Remainder of Riverside(R) 18,814 24.21% SAN BERNARDINO: Twentynine Palms(C) 28,142 100.00% SAN BERNARDINO: Remainder of San Bernardino(R) 462 0.38%
Senate Office of Demographics 02/2026