This Congressional district was established by the voters of California with the passage of Proposition 50 (2025) on November 4, 2025 and will go into effect after the November 2026 elections and upon seating of the 120th Congress, January 3, 2027. This district will stay in use until the California Citizens Redistricting Commission draws new maps following the 2030 U.S. Census .
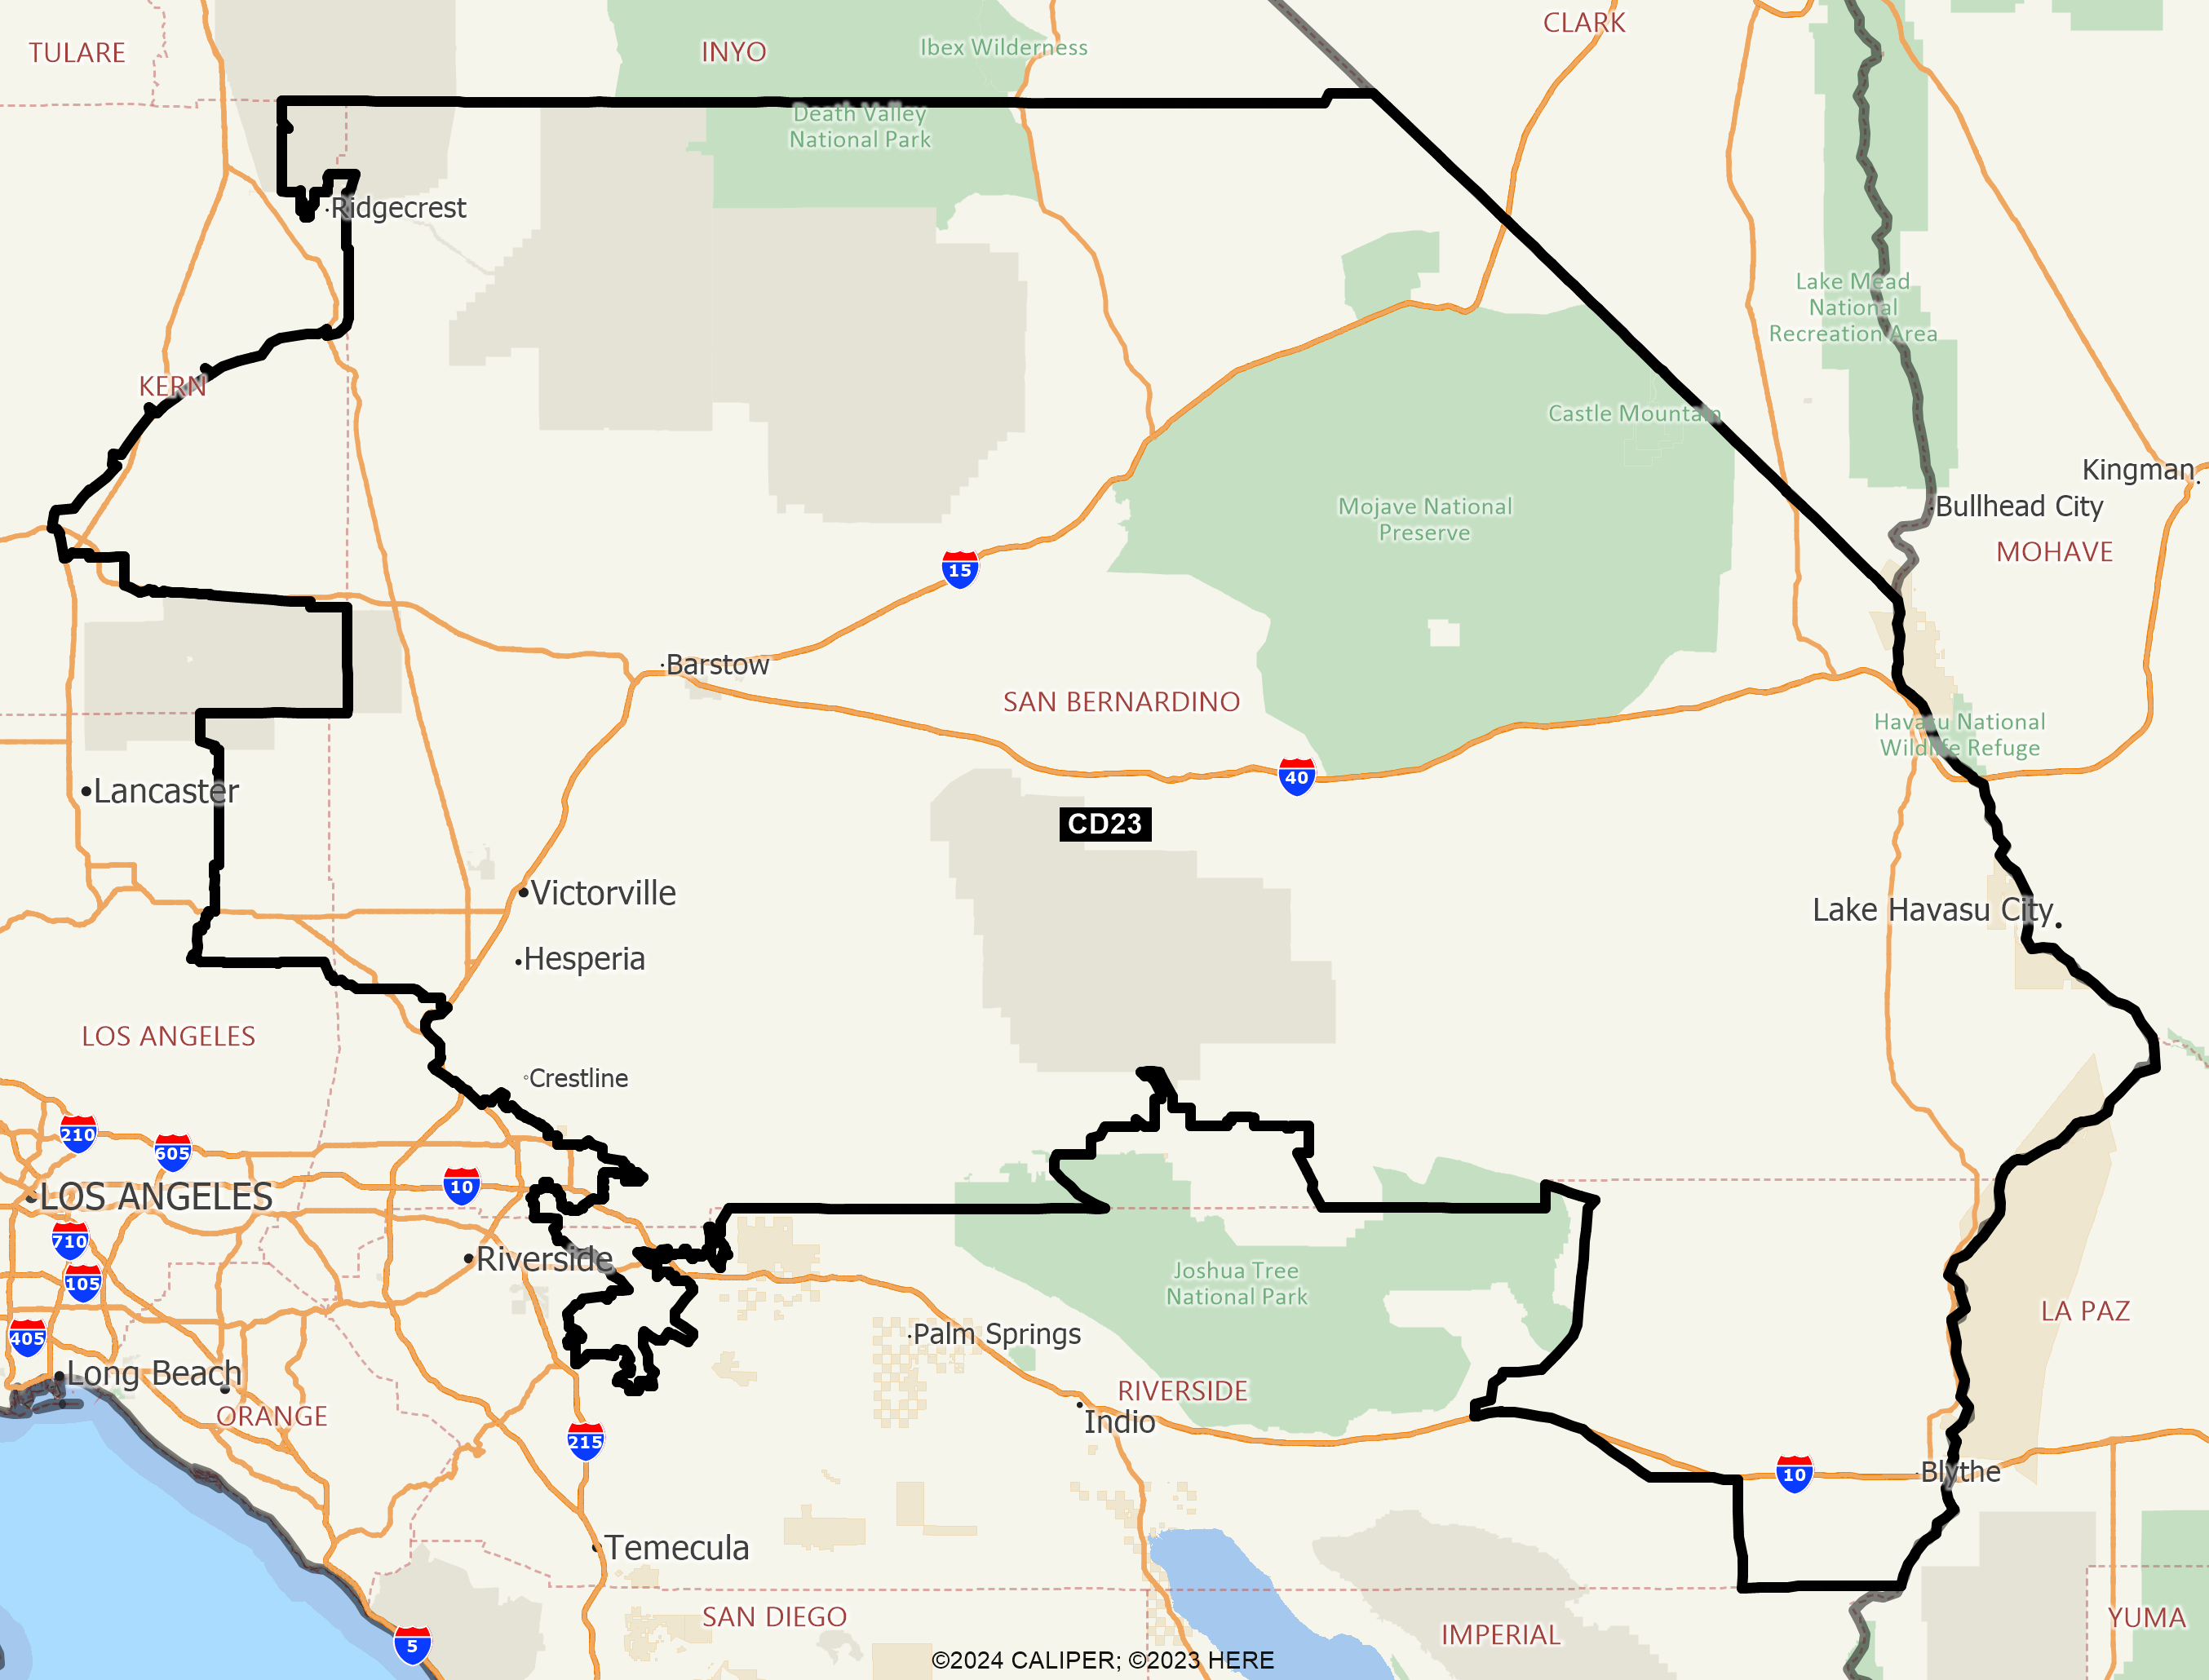
DISTRICT CD23
2020 Census Population (adj Elec. §21003 - SWDB 9/27/2021) Name Count Percent Total Population (POP) 760,066 100.00% POP Hispanic or Latino 324,842 42.74% POP Not Hispanic or Latino (NH) 435,224 57.26% POP NH Population of one race 403,652 53.11% POP NH White alone 299,755 39.44% POP NH Black or African American alone 62,357 8.20% POP NH Asian alone 29,686 3.91% POP NH American Indian and Alaska Native alone 4,602 0.61% POP NH Native Hawaiian and Other Pacific Islander alone 2,623 0.35% POP NH Some Other Race alone 4,629 0.61% POP NH Population of two or more races 31,572 4.15% POP DOJ NH Black or African American 68,501 9.01% POP DOJ NH Asian 35,174 4.63% POP DOJ NH American Indian and Alaska Native 13,063 1.72% POP DOJ NH Native Hawaiian and Other Pacific Islander 3,407 0.45% POP DOJ NH Some Other Race 9,121 1.20% POP DOJ NH Balance of Population of two or more races 6,203 0.82%
2020 Census Voting Age Population (adj Elec. §21003 - SWDB 9/27/2021) Name Count Percent Total Voting Age Population (VAP) 566,631 100.00% VAP Hispanic or Latino 217,077 38.31% VAP Not Hispanic or Latino (NH) 349,554 61.69% VAP NH Population of one race 328,351 57.95% VAP NH White alone 249,632 44.06% VAP NH Black or African American alone 44,439 7.84% VAP NH Asian alone 25,293 4.46% VAP NH American Indian and Alaska Native alone 3,756 0.66% VAP NH Native Hawaiian and Other Pacific Islander alone 1,960 0.35% VAP NH Some Other Race alone 3,271 0.58% VAP NH Population of two or more races 21,203 3.74% VAP DOJ NH Black or African American 47,492 8.38% VAP DOJ NH Asian 28,578 5.04% VAP DOJ NH American Indian and Alaska Native 10,595 1.87% VAP DOJ NH Native Hawaiian and Other Pacific Islander 2,444 0.43% VAP DOJ NH Some Other Race 6,777 1.20% VAP DOJ NH Balance of Population of two or more races 4,036 0.71%
2020 Census Housing Occupancy Status Name Count Percent Total Housing Units 304,683 100.00% Occupied 253,022 83.04% Vacant 51,661 16.96%
2020 Census Group Quarters Population (adj Elec. §21003 - SWDB 9/27/2021) Name Count Percent Total Group Quarters Population: 10,928 100.00% Institutionalized population: 6,180 56.55% Correctional facilities for adults 2,775 25.39% Juvenile facilities 136 1.24% Nursing facilities/Skilled-nursing facilities 1,609 14.72% Other institutional facilities 1,660 15.19% Noninstitutionalized population: 4,748 43.45% College/University student housing 246 2.25% Military quarters 1,920 17.57% Other noninstitutional facilities 2,582 23.63%
2019-2023 ACS Citizen Population (adj Elec. §21003 - SWDB 7/16/2025) Name Count Percent Total Citizen Population (CITZ) 717,166 100.00% CITZ Hispanic or Latino 301,768 42.08% CITZ Not Hispanic or Latino (NH) 415,573 57.95% CITZ NH White alone 298,718 41.65% CITZ NH Black or African American Alone 59,813 8.34% CITZ NH Asian Alone 24,071 3.36% CITZ NH American Indian and Alaska Native Alone 3,400 0.47% CITZ NH Native Hawaiian and Other Pacific Islander alone 2,750 0.38% CITZ NH Black or African American and White 8,971 1.25% CITZ NH American Indian or Alaska Native and White 6,229 0.87% CITZ NH Asian and White 5,178 0.72% CITZ NH American Indian or Alaska Native and Black or African American 1,514 0.21% CITZ NH Remainder of Two or More Race 4,988 0.70% CITZ DOJ NH Black or African American 68,784 9.59% CITZ DOJ NH Asian 30,300 4.22% CITZ DOJ NH American Indian and Alaska Native 8,578 1.20%
2019-2023 ACS Citizen Voting Age Population (adj Elec. §21003 - SWDB 7/16/2025) Name Count Percent Total Citizen Voting Age Population (CVAP) 514,103 100.00% CVAP Hispanic or Latino 190,014 36.96% CVAP Not Hispanic or Latino (NH) 324,380 63.10% CVAP NH White alone 242,849 47.24% CVAP NH Black or African American Alone 42,799 8.32% CVAP NH Asian Alone 19,372 3.77% CVAP NH American Indian and Alaska Native Alone 2,712 0.53% CVAP NH Native Hawaiian and Other Pacific Islander alone 1,941 0.38% CVAP NH Black or African American and White 3,920 0.76% CVAP NH Asian and White 3,185 0.62% CVAP NH American Indian or Alaska Native and White 3,854 0.75% CVAP NH American Indian or Alaska Native and Black or African American 1,061 0.21% CVAP NH Remainder of Two or More Race 2,777 0.54% CVAP DOJ NH Black or African American 46,719 9.09% CVAP DOJ NH Asian 22,557 4.39% CVAP DOJ NH American Indian and Alaska Native 6,566 1.28%
Counties In District Name Count Percent Kern 17,310 1.94% Los Angeles 16,710 0.17% Riverside 43,115 1.78% San Bernardino 682,930 31.32%
Places In District Name Count Percent KERN: Boron(U) 2,092 100.00% KERN: California City(C) 12,971 100.00% KERN: Johannesburg(U) 113 100.00% KERN: North Edwards(U) 1,055 100.00% KERN: Randsburg(U) 45 100.00% KERN: Remainder of Kern(R) 1,034 2.35% LOS ANGELES: Lake Los Angeles(U) 13,280 100.00% LOS ANGELES: Remainder of Los Angeles(R) 3,430 3.91% RIVERSIDE: Blythe(C) 12,406 100.00% RIVERSIDE: Calimesa(C) 10,057 100.00% RIVERSIDE: Cherry Valley(U) 6,529 100.00% RIVERSIDE: Desert Center(U) 258 100.00% RIVERSIDE: Lakeview(U) 1,987 100.00% RIVERSIDE: Mesa Verde(U) 773 100.00% RIVERSIDE: Nuevo(U) 3,463 51.28% RIVERSIDE: Ripley(U) 542 100.00% RIVERSIDE: Remainder of Riverside(R) 7,100 9.14% SAN BERNARDINO: Adelanto(C) 38,243 100.00% SAN BERNARDINO: Apple Valley(C) 76,063 100.00% SAN BERNARDINO: Baker(U) 444 100.00% SAN BERNARDINO: Barstow(C) 25,596 100.00% SAN BERNARDINO: Big Bear City(U) 12,777 100.00% SAN BERNARDINO: Big Bear Lake(C) 5,061 100.00% SAN BERNARDINO: Big River(U) 1,090 100.00% SAN BERNARDINO: Bluewater(U) 117 100.00% SAN BERNARDINO: Crestline(U) 11,690 100.00% SAN BERNARDINO: Fort Irwin(U) 8,110 100.00% SAN BERNARDINO: Hesperia(C) 100,166 100.00% SAN BERNARDINO: Homestead Valley(U) 2,804 100.00% SAN BERNARDINO: Joshua Tree(U) 6,525 100.00% SAN BERNARDINO: Lake Arrowhead(U) 12,430 100.00% SAN BERNARDINO: Lenwood(U) 3,644 100.00% SAN BERNARDINO: Loma Linda(C) 24,856 100.00% SAN BERNARDINO: Lucerne Valley(U) 5,356 100.00% SAN BERNARDINO: Mentone(U) 9,584 100.00% SAN BERNARDINO: Morongo Valley(U) 3,527 100.00% SAN BERNARDINO: Mountain View Acres(U) 3,348 100.00% SAN BERNARDINO: Needles(C) 4,953 100.00% SAN BERNARDINO: Oak Glen(U) 505 100.00% SAN BERNARDINO: Oak Hills(U) 9,470 100.00% SAN BERNARDINO: Phelan(U) 13,904 100.00% SAN BERNARDINO: Pinon Hills(U) 7,278 100.00% SAN BERNARDINO: Redlands(C) 11,044 15.05% SAN BERNARDINO: Running Springs(U) 5,291 100.00% SAN BERNARDINO: San Bernardino(C) 10,280 4.61% SAN BERNARDINO: Searles Valley(U) 1,572 100.00% SAN BERNARDINO: Silver Lakes(U) 6,325 100.00% SAN BERNARDINO: Spring Valley Lake(U) 9,619 100.00% SAN BERNARDINO: Victorville(C) 131,417 100.00% SAN BERNARDINO: Yermo(U) 630 100.00% SAN BERNARDINO: Yucaipa(C) 54,669 100.00% SAN BERNARDINO: Yucca Valley(C) 21,814 100.00% SAN BERNARDINO: Remainder of San Bernardino(R) 42,728 35.23%
Senate Office of Demographics 02/2026