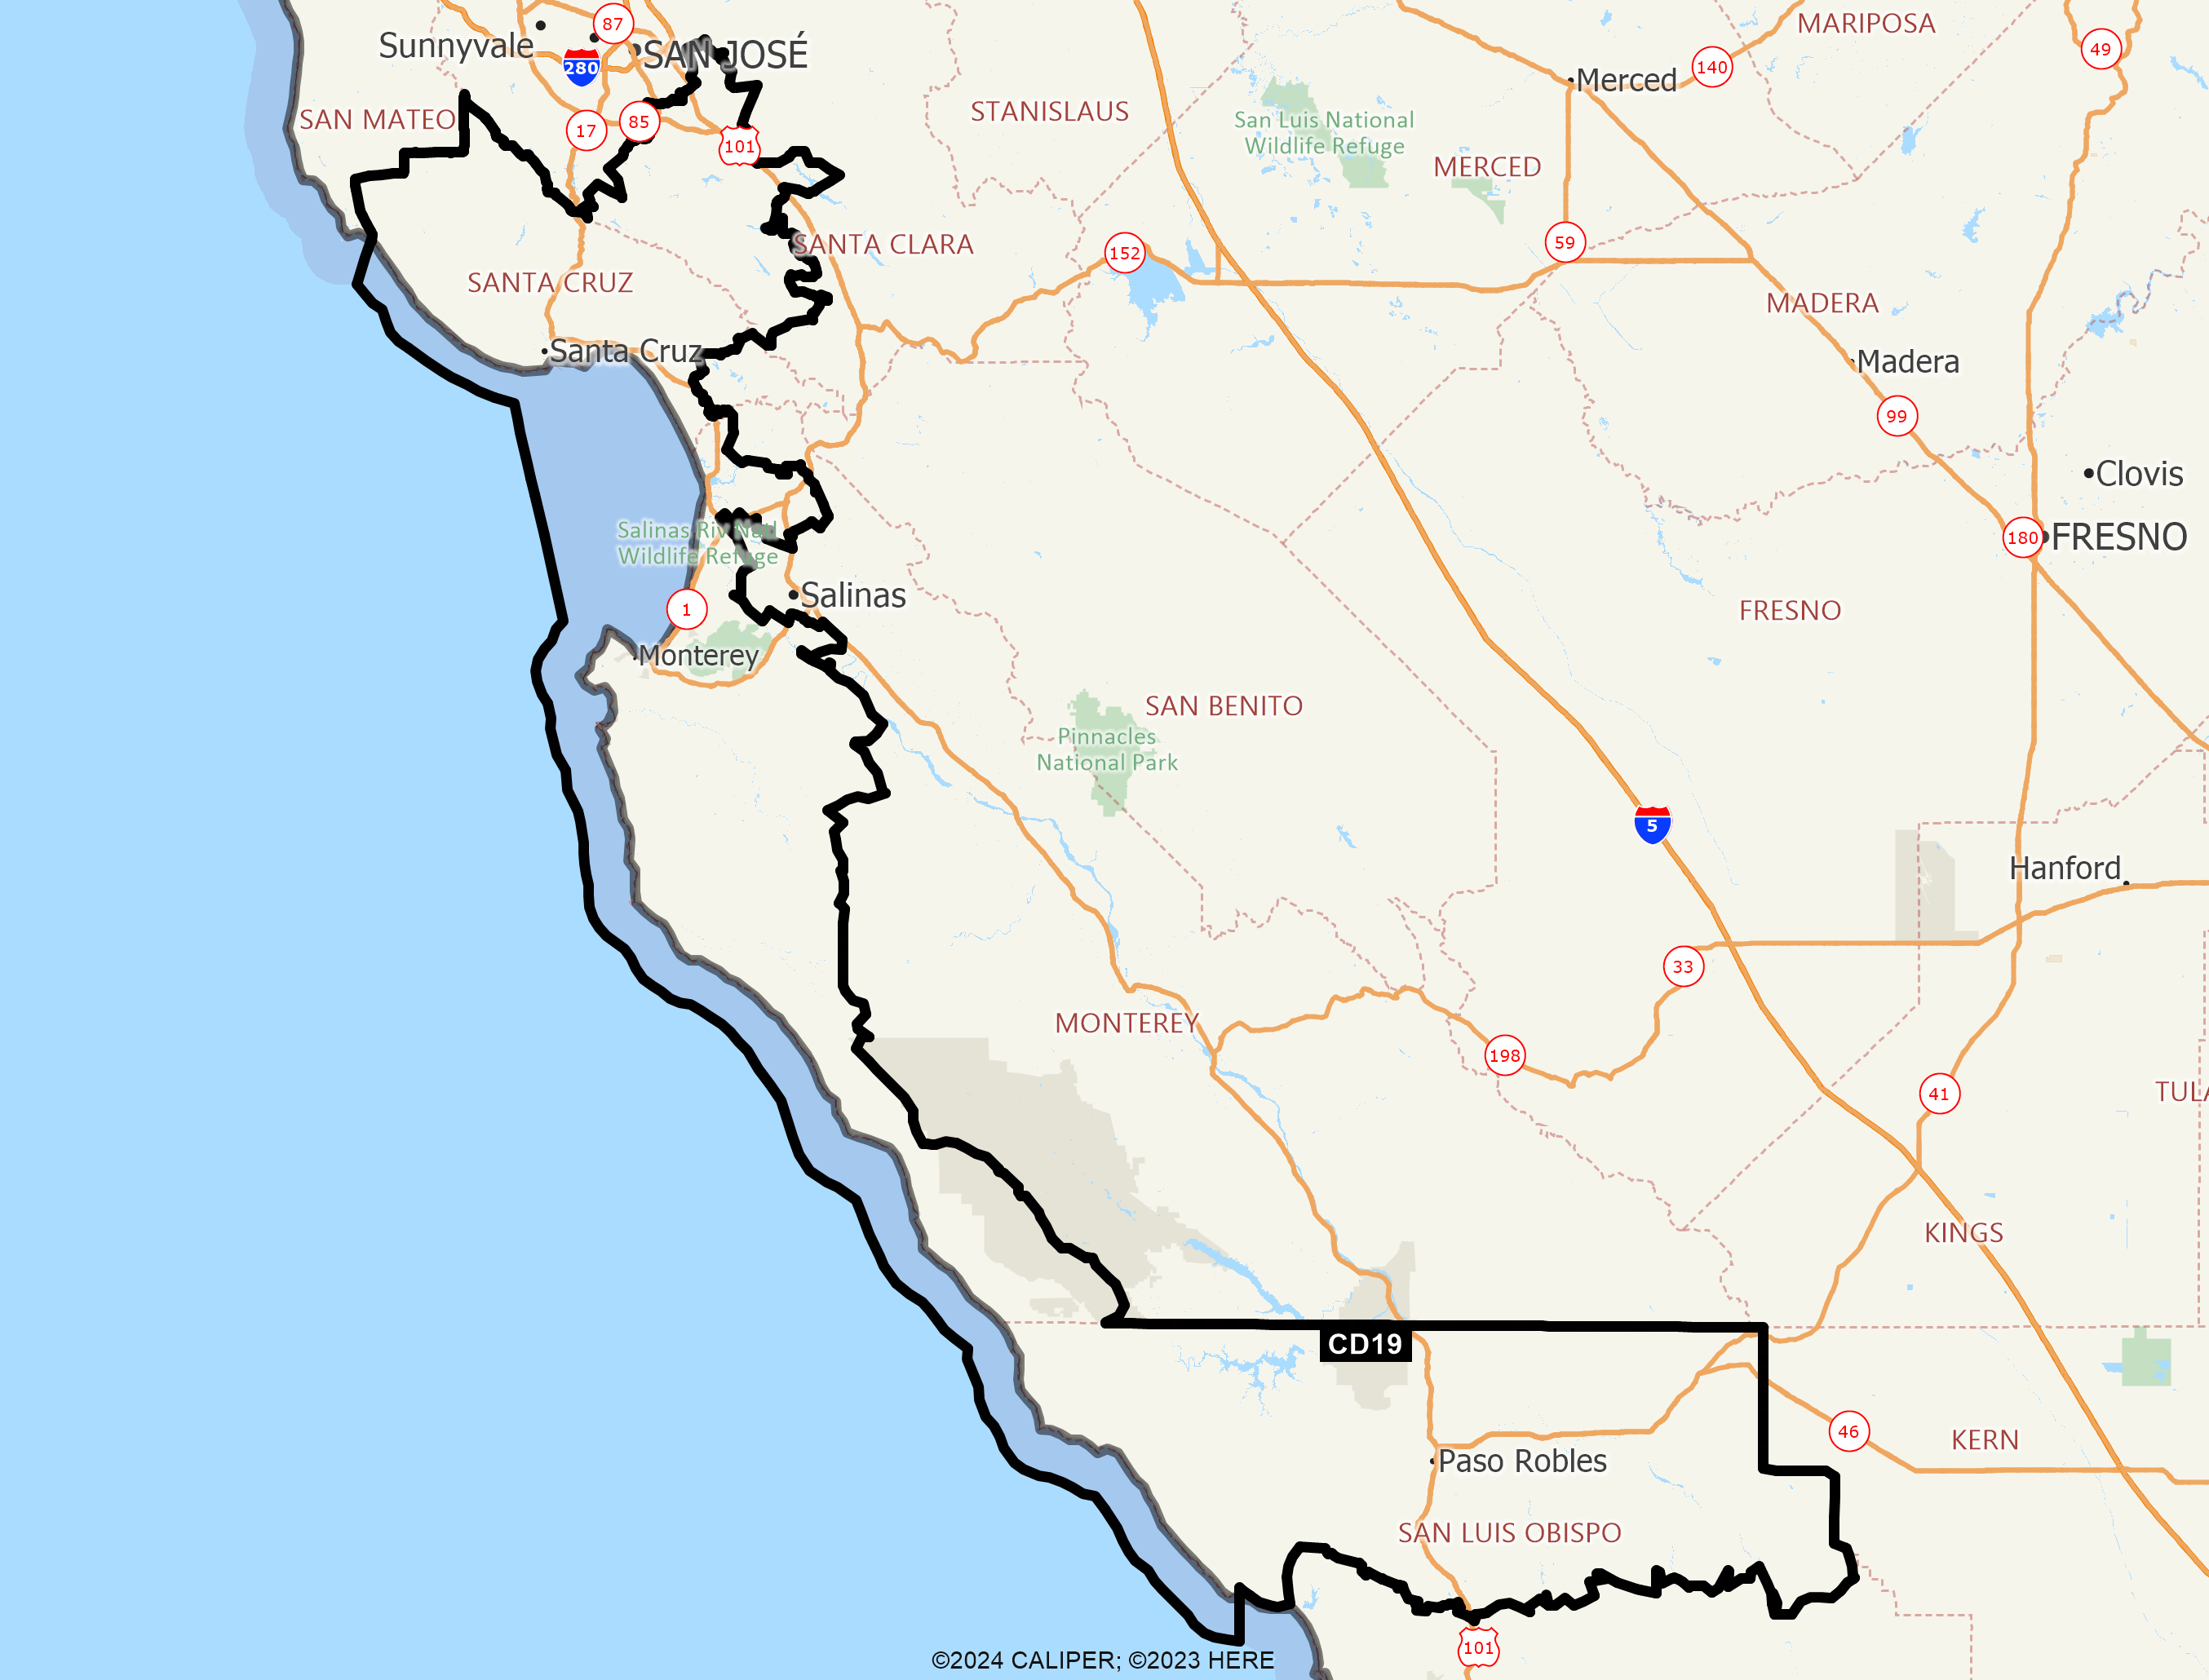
This Congressional district was established by the voters of California with the passage of Proposition 50 (2025) on November 4, 2025 and will go into effect after the November 2026 elections and upon seating of the 120th Congress, January 3, 2027. This district will stay in use until the California Citizens Redistricting Commission draws new maps following the 2030 U.S. Census .
DISTRICT CD19
2020 Census Population (adj Elec. §21003 - SWDB 9/27/2021) Name Count Percent Total Population (POP) 760,067 100.00% POP Hispanic or Latino 187,658 24.69% POP Not Hispanic or Latino (NH) 572,409 75.31% POP NH Population of one race 533,925 70.25% POP NH White alone 366,442 48.21% POP NH Black or African American alone 16,414 2.16% POP NH Asian alone 141,729 18.65% POP NH American Indian and Alaska Native alone 2,220 0.29% POP NH Native Hawaiian and Other Pacific Islander alone 2,659 0.35% POP NH Some Other Race alone 4,461 0.59% POP NH Population of two or more races 38,484 5.06% POP DOJ NH Black or African American 20,417 2.69% POP DOJ NH Asian 156,144 20.54% POP DOJ NH American Indian and Alaska Native 9,185 1.21% POP DOJ NH Native Hawaiian and Other Pacific Islander 3,713 0.49% POP DOJ NH Some Other Race 10,926 1.44% POP DOJ NH Balance of Population of two or more races 5,582 0.73%
2020 Census Voting Age Population (adj Elec. §21003 - SWDB 9/27/2021) Name Count Percent Total Voting Age Population (VAP) 611,107 100.00% VAP Hispanic or Latino 134,705 22.04% VAP Not Hispanic or Latino (NH) 476,402 77.96% VAP NH Population of one race 450,392 73.70% VAP NH White alone 315,648 51.65% VAP NH Black or African American alone 13,790 2.26% VAP NH Asian alone 113,449 18.56% VAP NH American Indian and Alaska Native alone 1,939 0.32% VAP NH Native Hawaiian and Other Pacific Islander alone 2,207 0.36% VAP NH Some Other Race alone 3,359 0.55% VAP NH Population of two or more races 26,010 4.26% VAP DOJ NH Black or African American 16,354 2.68% VAP DOJ NH Asian 121,679 19.91% VAP DOJ NH American Indian and Alaska Native 7,668 1.25% VAP DOJ NH Native Hawaiian and Other Pacific Islander 2,926 0.48% VAP DOJ NH Some Other Race 8,397 1.37% VAP DOJ NH Balance of Population of two or more races 3,730 0.61%
2020 Census Housing Occupancy Status Name Count Percent Total Housing Units 296,729 100.00% Occupied 269,581 90.85% Vacant 27,148 9.15%
2020 Census Group Quarters Population (adj Elec. §21003 - SWDB 9/27/2021) Name Count Percent Total Group Quarters Population: 24,251 100.00% Institutionalized population: 2,291 9.45% Correctional facilities for adults 313 1.29% Juvenile facilities 139 0.57% Nursing facilities/Skilled-nursing facilities 1,718 7.08% Other institutional facilities 121 0.50% Noninstitutionalized population: 21,960 90.55% College/University student housing 10,371 42.77% Military quarters 3,580 14.76% Other noninstitutional facilities 8,009 33.03%
2019-2023 ACS Citizen Population (adj Elec. §21003 - SWDB 7/16/2025) Name Count Percent Total Citizen Population (CITZ) 682,011 100.00% CITZ Hispanic or Latino 153,664 22.53% CITZ Not Hispanic or Latino (NH) 528,334 77.47% CITZ NH White alone 364,368 53.43% CITZ NH Black or African American Alone 14,628 2.14% CITZ NH Asian Alone 116,083 17.02% CITZ NH American Indian and Alaska Native Alone 921 0.14% CITZ NH Native Hawaiian and Other Pacific Islander alone 2,459 0.36% CITZ NH Black or African American and White 5,829 0.85% CITZ NH American Indian or Alaska Native and White 13,152 1.93% CITZ NH Asian and White 5,961 0.87% CITZ NH American Indian or Alaska Native and Black or African American 219 0.03% CITZ NH Remainder of Two or More Race 5,047 0.74% CITZ DOJ NH Black or African American 20,457 3.00% CITZ DOJ NH Asian 129,235 18.95% CITZ DOJ NH American Indian and Alaska Native 6,882 1.01%
2019-2023 ACS Citizen Voting Age Population (adj Elec. §21003 - SWDB 7/16/2025) Name Count Percent Total Citizen Voting Age Population (CVAP) 540,894 100.00% CVAP Hispanic or Latino 102,722 18.99% CVAP Not Hispanic or Latino (NH) 438,171 81.01% CVAP NH White alone 311,735 57.63% CVAP NH Black or African American Alone 12,501 2.31% CVAP NH Asian Alone 91,815 16.97% CVAP NH American Indian and Alaska Native Alone 870 0.16% CVAP NH Native Hawaiian and Other Pacific Islander alone 2,066 0.38% CVAP NH Black or African American and White 3,508 0.65% CVAP NH Asian and White 7,557 1.40% CVAP NH American Indian or Alaska Native and White 4,940 0.91% CVAP NH American Indian or Alaska Native and Black or African American 200 0.04% CVAP NH Remainder of Two or More Race 3,060 0.57% CVAP DOJ NH Black or African American 16,009 2.96% CVAP DOJ NH Asian 99,372 18.37% CVAP DOJ NH American Indian and Alaska Native 5,810 1.07%
Counties In District Name Count Percent Monterey 169,084 38.90% San Luis Obispo 101,050 36.19% Santa Clara 286,074 14.75% Santa Cruz 203,861 75.13%
Places In District Name Count Percent MONTEREY: Carmel-by-the-Sea(C) 3,224 100.00% MONTEREY: Carmel Valley Village(U) 4,537 100.00% MONTEREY: Del Monte Forest(U) 4,214 100.00% MONTEREY: Del Rey Oaks(C) 1,596 100.00% MONTEREY: Elkhorn(U) 1,593 100.00% MONTEREY: Marina(C) 22,422 100.00% MONTEREY: Monterey(C) 30,291 100.00% MONTEREY: Moss Landing(U) 239 100.00% MONTEREY: Pacific Grove(C) 15,125 100.00% MONTEREY: Prunedale(U) 15,447 81.56% MONTEREY: Sand City(C) 327 100.00% MONTEREY: Seaside(C) 32,510 100.00% MONTEREY: Spreckels(U) 692 100.00% MONTEREY: Remainder of Monterey(R) 36,867 69.00% SAN LUIS OBISPO: Atascadero(C) 29,858 100.00% SAN LUIS OBISPO: Cambria(U) 5,687 100.00% SAN LUIS OBISPO: Creston(U) 98 100.00% SAN LUIS OBISPO: El Paso de Robles (Paso Robles)(C) 31,566 100.00% SAN LUIS OBISPO: Lake Nacimiento(U) 2,962 100.00% SAN LUIS OBISPO: Oak Shores(U) 316 100.00% SAN LUIS OBISPO: San Miguel(U) 3,180 100.00% SAN LUIS OBISPO: San Simeon(U) 445 100.00% SAN LUIS OBISPO: Shandon(U) 1,175 100.00% SAN LUIS OBISPO: Templeton(U) 8,398 100.00% SAN LUIS OBISPO: Whitley Gardens(U) 329 100.00% SAN LUIS OBISPO: Remainder of San Luis Obispo(R) 17,036 45.98% SANTA CLARA: San Jose(C) 277,356 27.31% SANTA CLARA: Remainder of Santa Clara(R) 8,718 30.87% SANTA CRUZ: Aptos(U) 6,675 100.00% SANTA CRUZ: Aptos Hills-Larkin Valley(U) 2,386 100.00% SANTA CRUZ: Ben Lomond(U) 6,352 100.00% SANTA CRUZ: Bonny Doon(U) 2,872 100.00% SANTA CRUZ: Boulder Creek(U) 5,434 100.00% SANTA CRUZ: Brookdale(U) 2,046 100.00% SANTA CRUZ: Capitola(C) 9,948 100.00% SANTA CRUZ: Corralitos(U) 2,346 100.00% SANTA CRUZ: Davenport(U) 388 100.00% SANTA CRUZ: Day Valley(U) 3,413 100.00% SANTA CRUZ: Felton(U) 4,496 100.00% SANTA CRUZ: La Selva Beach(U) 2,532 100.00% SANTA CRUZ: Live Oak(U) 17,084 100.00% SANTA CRUZ: Lompico(U) 1,157 100.00% SANTA CRUZ: Mount Hermon(U) 1,113 100.00% SANTA CRUZ: Pajaro Dunes(U) 122 100.00% SANTA CRUZ: Paradise Park(U) 368 100.00% SANTA CRUZ: Pasatiempo(U) 1,094 100.00% SANTA CRUZ: Pleasure Point(U) 5,830 100.00% SANTA CRUZ: Rio del Mar(U) 9,135 100.00% SANTA CRUZ: Santa Cruz(C) 63,093 100.00% SANTA CRUZ: Scotts Valley(C) 12,243 100.00% SANTA CRUZ: Seacliff(U) 3,291 100.00% SANTA CRUZ: Soquel(U) 9,992 100.00% SANTA CRUZ: Twin Lakes(U) 4,948 100.00% SANTA CRUZ: Watsonville(C) 0 0.00% SANTA CRUZ: Zayante(U) 731 100.00% SANTA CRUZ: Remainder of Santa Cruz(R) 24,772 96.70%
Senate Office of Demographics 02/2026