This Congressional district was established by the voters of California with the passage of Proposition 50 (2025) on November 4, 2025 and will go into effect after the November 2026 elections and upon seating of the 120th Congress, January 3, 2027. This district will stay in use until the California Citizens Redistricting Commission draws new maps following the 2030 U.S. Census .
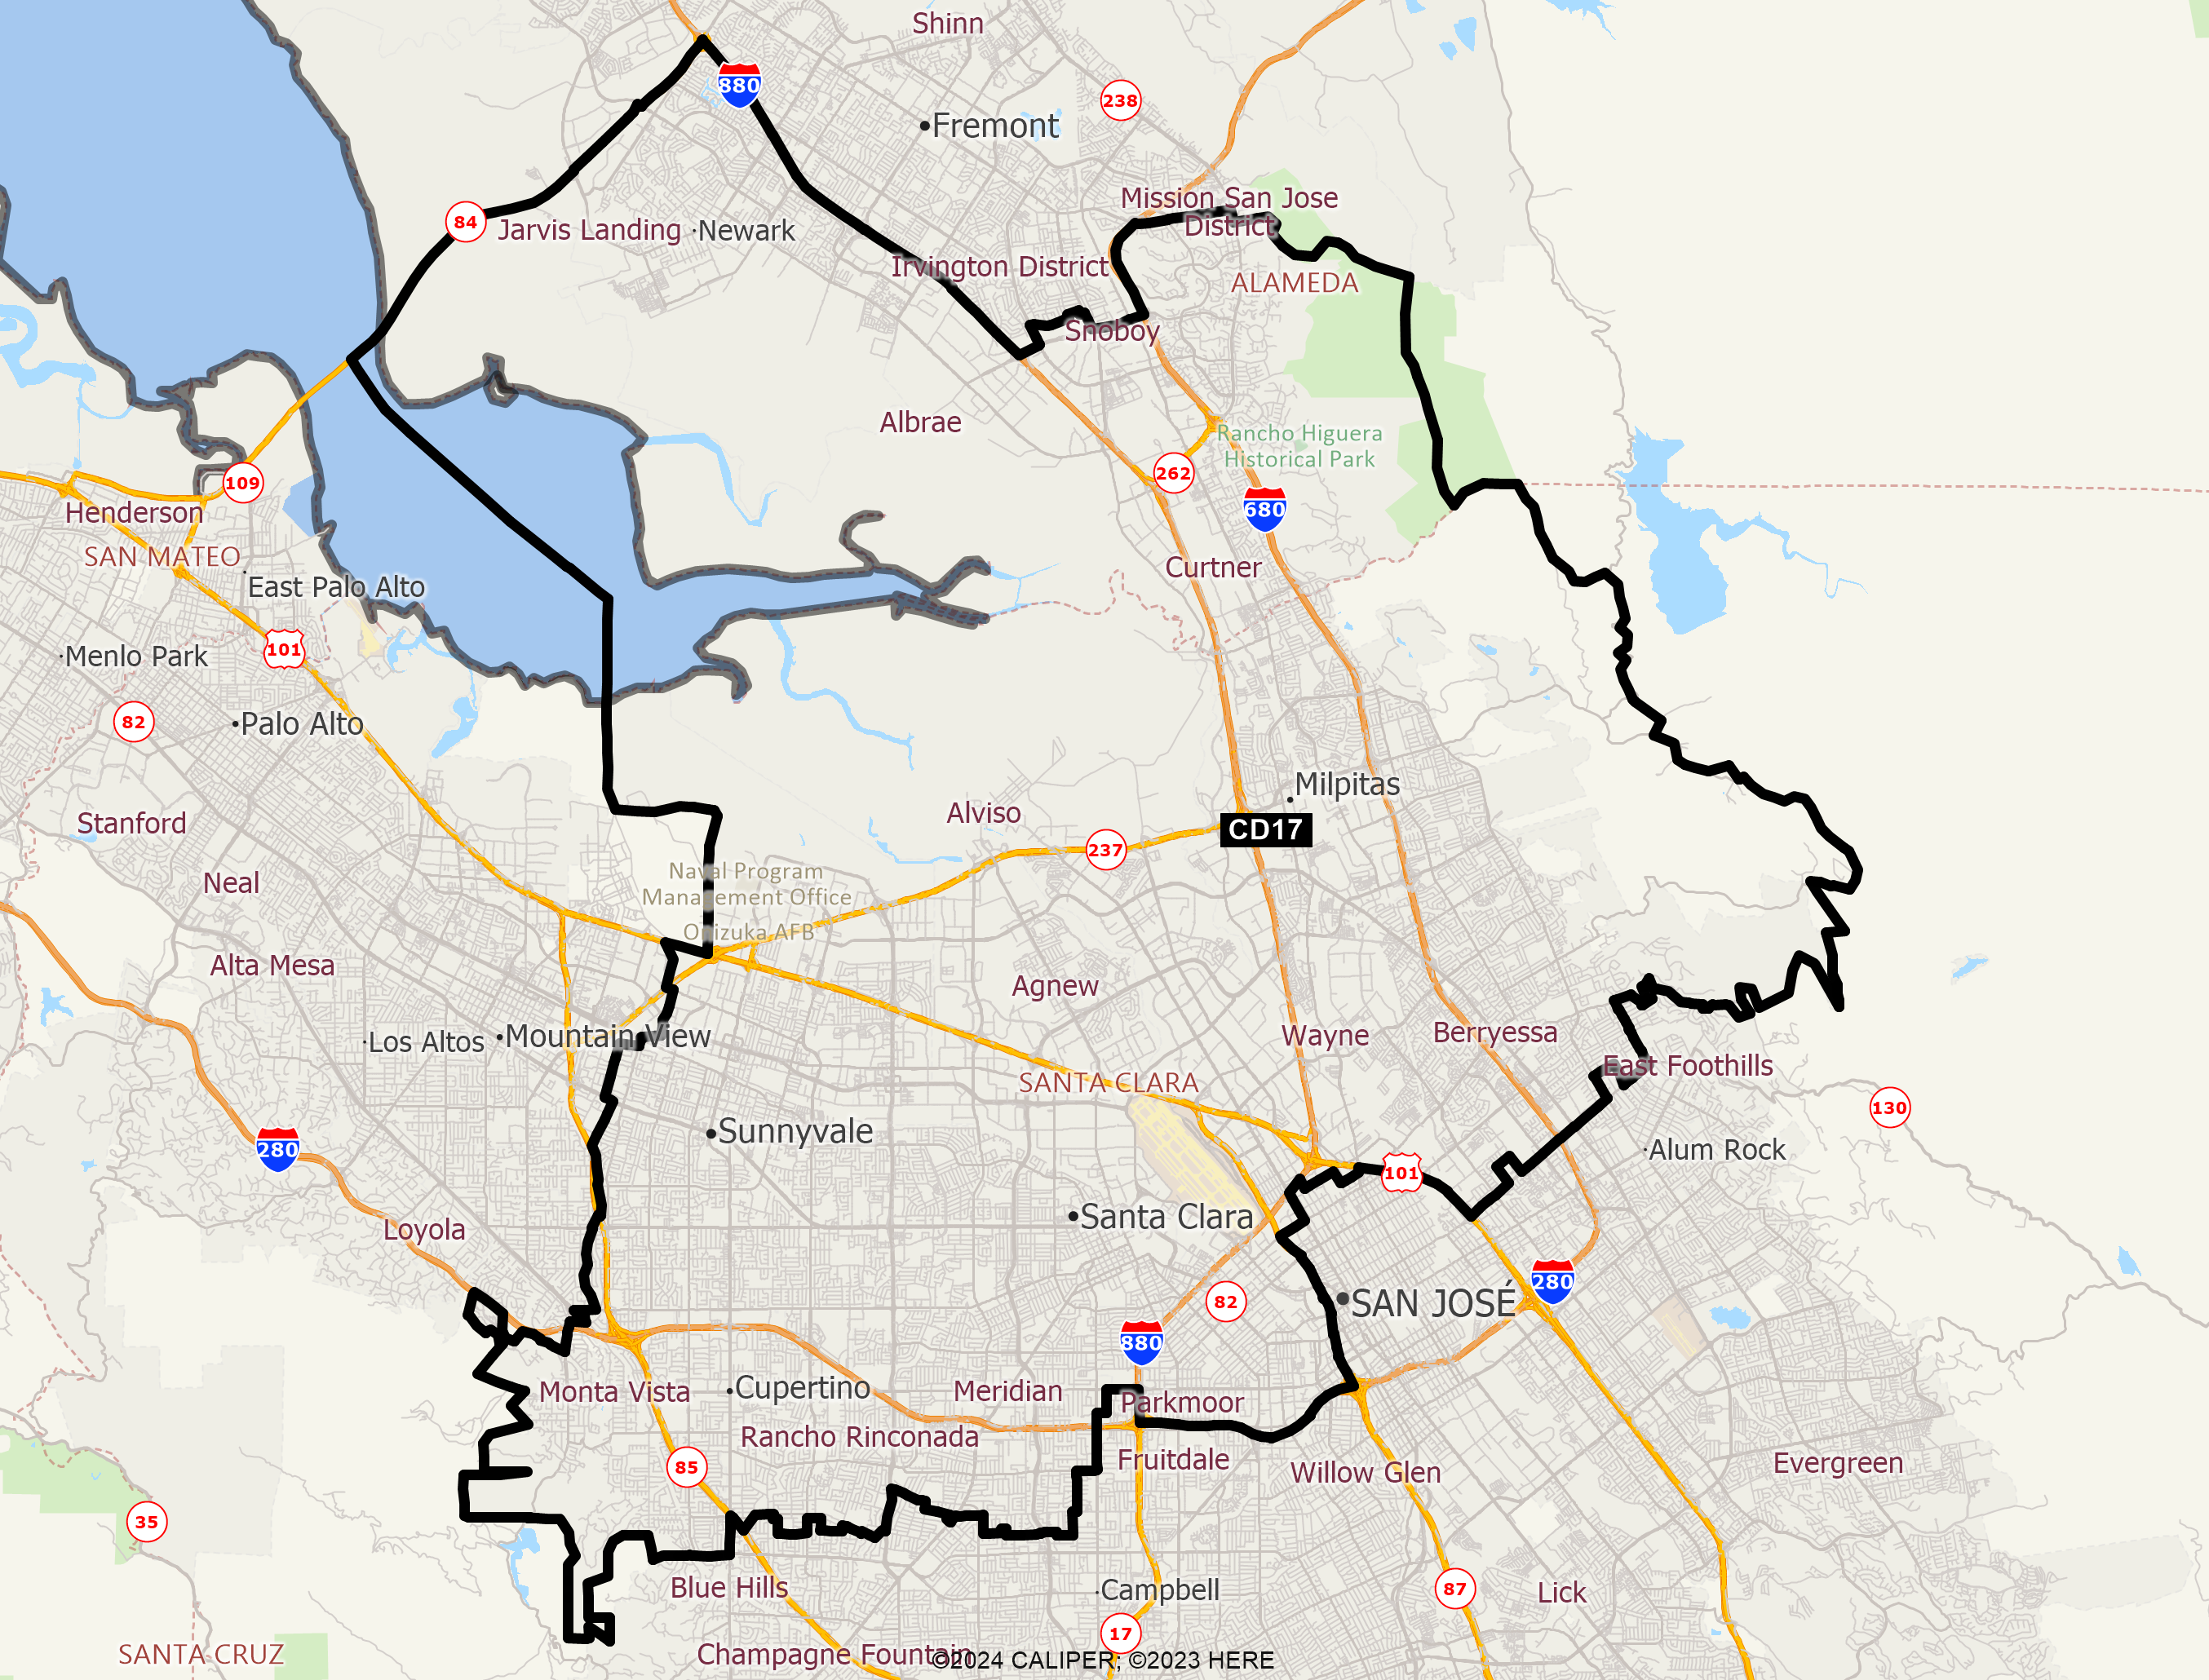
DISTRICT CD17
2020 Census Population (adj Elec. §21003 - SWDB 9/27/2021) Name Count Percent Total Population (POP) 760,067 100.00% POP Hispanic or Latino 130,456 17.16% POP Not Hispanic or Latino (NH) 629,611 82.84% POP NH Population of one race 602,388 79.25% POP NH White alone 162,408 21.37% POP NH Black or African American alone 15,739 2.07% POP NH Asian alone 416,497 54.80% POP NH American Indian and Alaska Native alone 1,108 0.15% POP NH Native Hawaiian and Other Pacific Islander alone 2,762 0.36% POP NH Some Other Race alone 3,874 0.51% POP NH Population of two or more races 27,223 3.58% POP DOJ NH Black or African American 17,842 2.35% POP DOJ NH Asian 430,822 56.68% POP DOJ NH American Indian and Alaska Native 3,202 0.42% POP DOJ NH Native Hawaiian and Other Pacific Islander 3,300 0.43% POP DOJ NH Some Other Race 6,832 0.90% POP DOJ NH Balance of Population of two or more races 5,205 0.68%
2020 Census Voting Age Population (adj Elec. §21003 - SWDB 9/27/2021) Name Count Percent Total Voting Age Population (VAP) 606,428 100.00% VAP Hispanic or Latino 96,326 15.88% VAP Not Hispanic or Latino (NH) 510,102 84.12% VAP NH Population of one race 493,225 81.33% VAP NH White alone 141,615 23.35% VAP NH Black or African American alone 12,946 2.13% VAP NH Asian alone 332,766 54.87% VAP NH American Indian and Alaska Native alone 788 0.13% VAP NH Native Hawaiian and Other Pacific Islander alone 2,232 0.37% VAP NH Some Other Race alone 2,878 0.47% VAP NH Population of two or more races 16,877 2.78% VAP DOJ NH Black or African American 14,337 2.36% VAP DOJ NH Asian 340,209 56.10% VAP DOJ NH American Indian and Alaska Native 2,629 0.43% VAP DOJ NH Native Hawaiian and Other Pacific Islander 2,623 0.43% VAP DOJ NH Some Other Race 5,252 0.87% VAP DOJ NH Balance of Population of two or more races 3,437 0.57%
2020 Census Housing Occupancy Status Name Count Percent Total Housing Units 278,600 100.00% Occupied 265,056 95.14% Vacant 13,544 4.86%
2020 Census Group Quarters Population (adj Elec. §21003 - SWDB 9/27/2021) Name Count Percent Total Group Quarters Population: 10,735 100.00% Institutionalized population: 3,245 30.23% Correctional facilities for adults 1,461 13.61% Juvenile facilities 52 0.48% Nursing facilities/Skilled-nursing facilities 1,732 16.13% Other institutional facilities 0 0.00% Noninstitutionalized population: 7,490 69.77% College/University student housing 3,254 30.31% Military quarters 0 0.00% Other noninstitutional facilities 4,236 39.46%
2019-2023 ACS Citizen Population (adj Elec. §21003 - SWDB 7/16/2025) Name Count Percent Total Citizen Population (CITZ) 554,406 100.00% CITZ Hispanic or Latino 100,590 18.14% CITZ Not Hispanic or Latino (NH) 453,854 81.86% CITZ NH White alone 147,529 26.61% CITZ NH Black or African American Alone 15,299 2.76% CITZ NH Asian Alone 264,088 47.63% CITZ NH American Indian and Alaska Native Alone 1,326 0.24% CITZ NH Native Hawaiian and Other Pacific Islander alone 2,592 0.47% CITZ NH Black or African American and White 2,842 0.51% CITZ NH American Indian or Alaska Native and White 13,357 2.41% CITZ NH Asian and White 1,796 0.32% CITZ NH American Indian or Alaska Native and Black or African American 336 0.06% CITZ NH Remainder of Two or More Race 4,627 0.83% CITZ DOJ NH Black or African American 18,141 3.27% CITZ DOJ NH Asian 277,445 50.04% CITZ DOJ NH American Indian and Alaska Native 3,122 0.56%
2019-2023 ACS Citizen Voting Age Population (adj Elec. §21003 - SWDB 7/16/2025) Name Count Percent Total Citizen Voting Age Population (CVAP) 424,767 100.00% CVAP Hispanic or Latino 69,266 16.31% CVAP Not Hispanic or Latino (NH) 355,669 83.73% CVAP NH White alone 130,186 30.65% CVAP NH Black or African American Alone 12,007 2.83% CVAP NH Asian Alone 197,687 46.54% CVAP NH American Indian and Alaska Native Alone 1,074 0.25% CVAP NH Native Hawaiian and Other Pacific Islander alone 1,983 0.47% CVAP NH Black or African American and White 1,672 0.39% CVAP NH Asian and White 6,511 1.53% CVAP NH American Indian or Alaska Native and White 1,195 0.28% CVAP NH American Indian or Alaska Native and Black or African American 336 0.08% CVAP NH Remainder of Two or More Race 3,017 0.71% CVAP DOJ NH Black or African American 13,679 3.22% CVAP DOJ NH Asian 204,198 48.07% CVAP DOJ NH American Indian and Alaska Native 2,269 0.53%
Counties In District Name Count Percent Alameda 83,696 4.97% Santa Clara 676,366 34.86%
Places In District Name Count Percent ALAMEDA: Fremont(C) 36,126 15.66% ALAMEDA: Newark(C) 47,570 100.00% SANTA CLARA: Burbank(U) 4,954 100.00% SANTA CLARA: Cupertino(C) 60,446 100.00% SANTA CLARA: Milpitas(C) 80,392 100.00% SANTA CLARA: San Jose(C) 245,869 24.21% SANTA CLARA: Santa Clara(C) 127,853 100.00% SANTA CLARA: Sunnyvale(C) 156,033 100.00% SANTA CLARA: Remainder of Santa Clara(R) 819 2.90%
Senate Office of Demographics 02/2026