This Congressional district was established by the voters of California with the passage of Proposition 50 (2025) on November 4, 2025 and will go into effect after the November 2026 elections and upon seating of the 120th Congress, January 3, 2027. This district will stay in use until the California Citizens Redistricting Commission draws new maps following the 2030 U.S. Census .
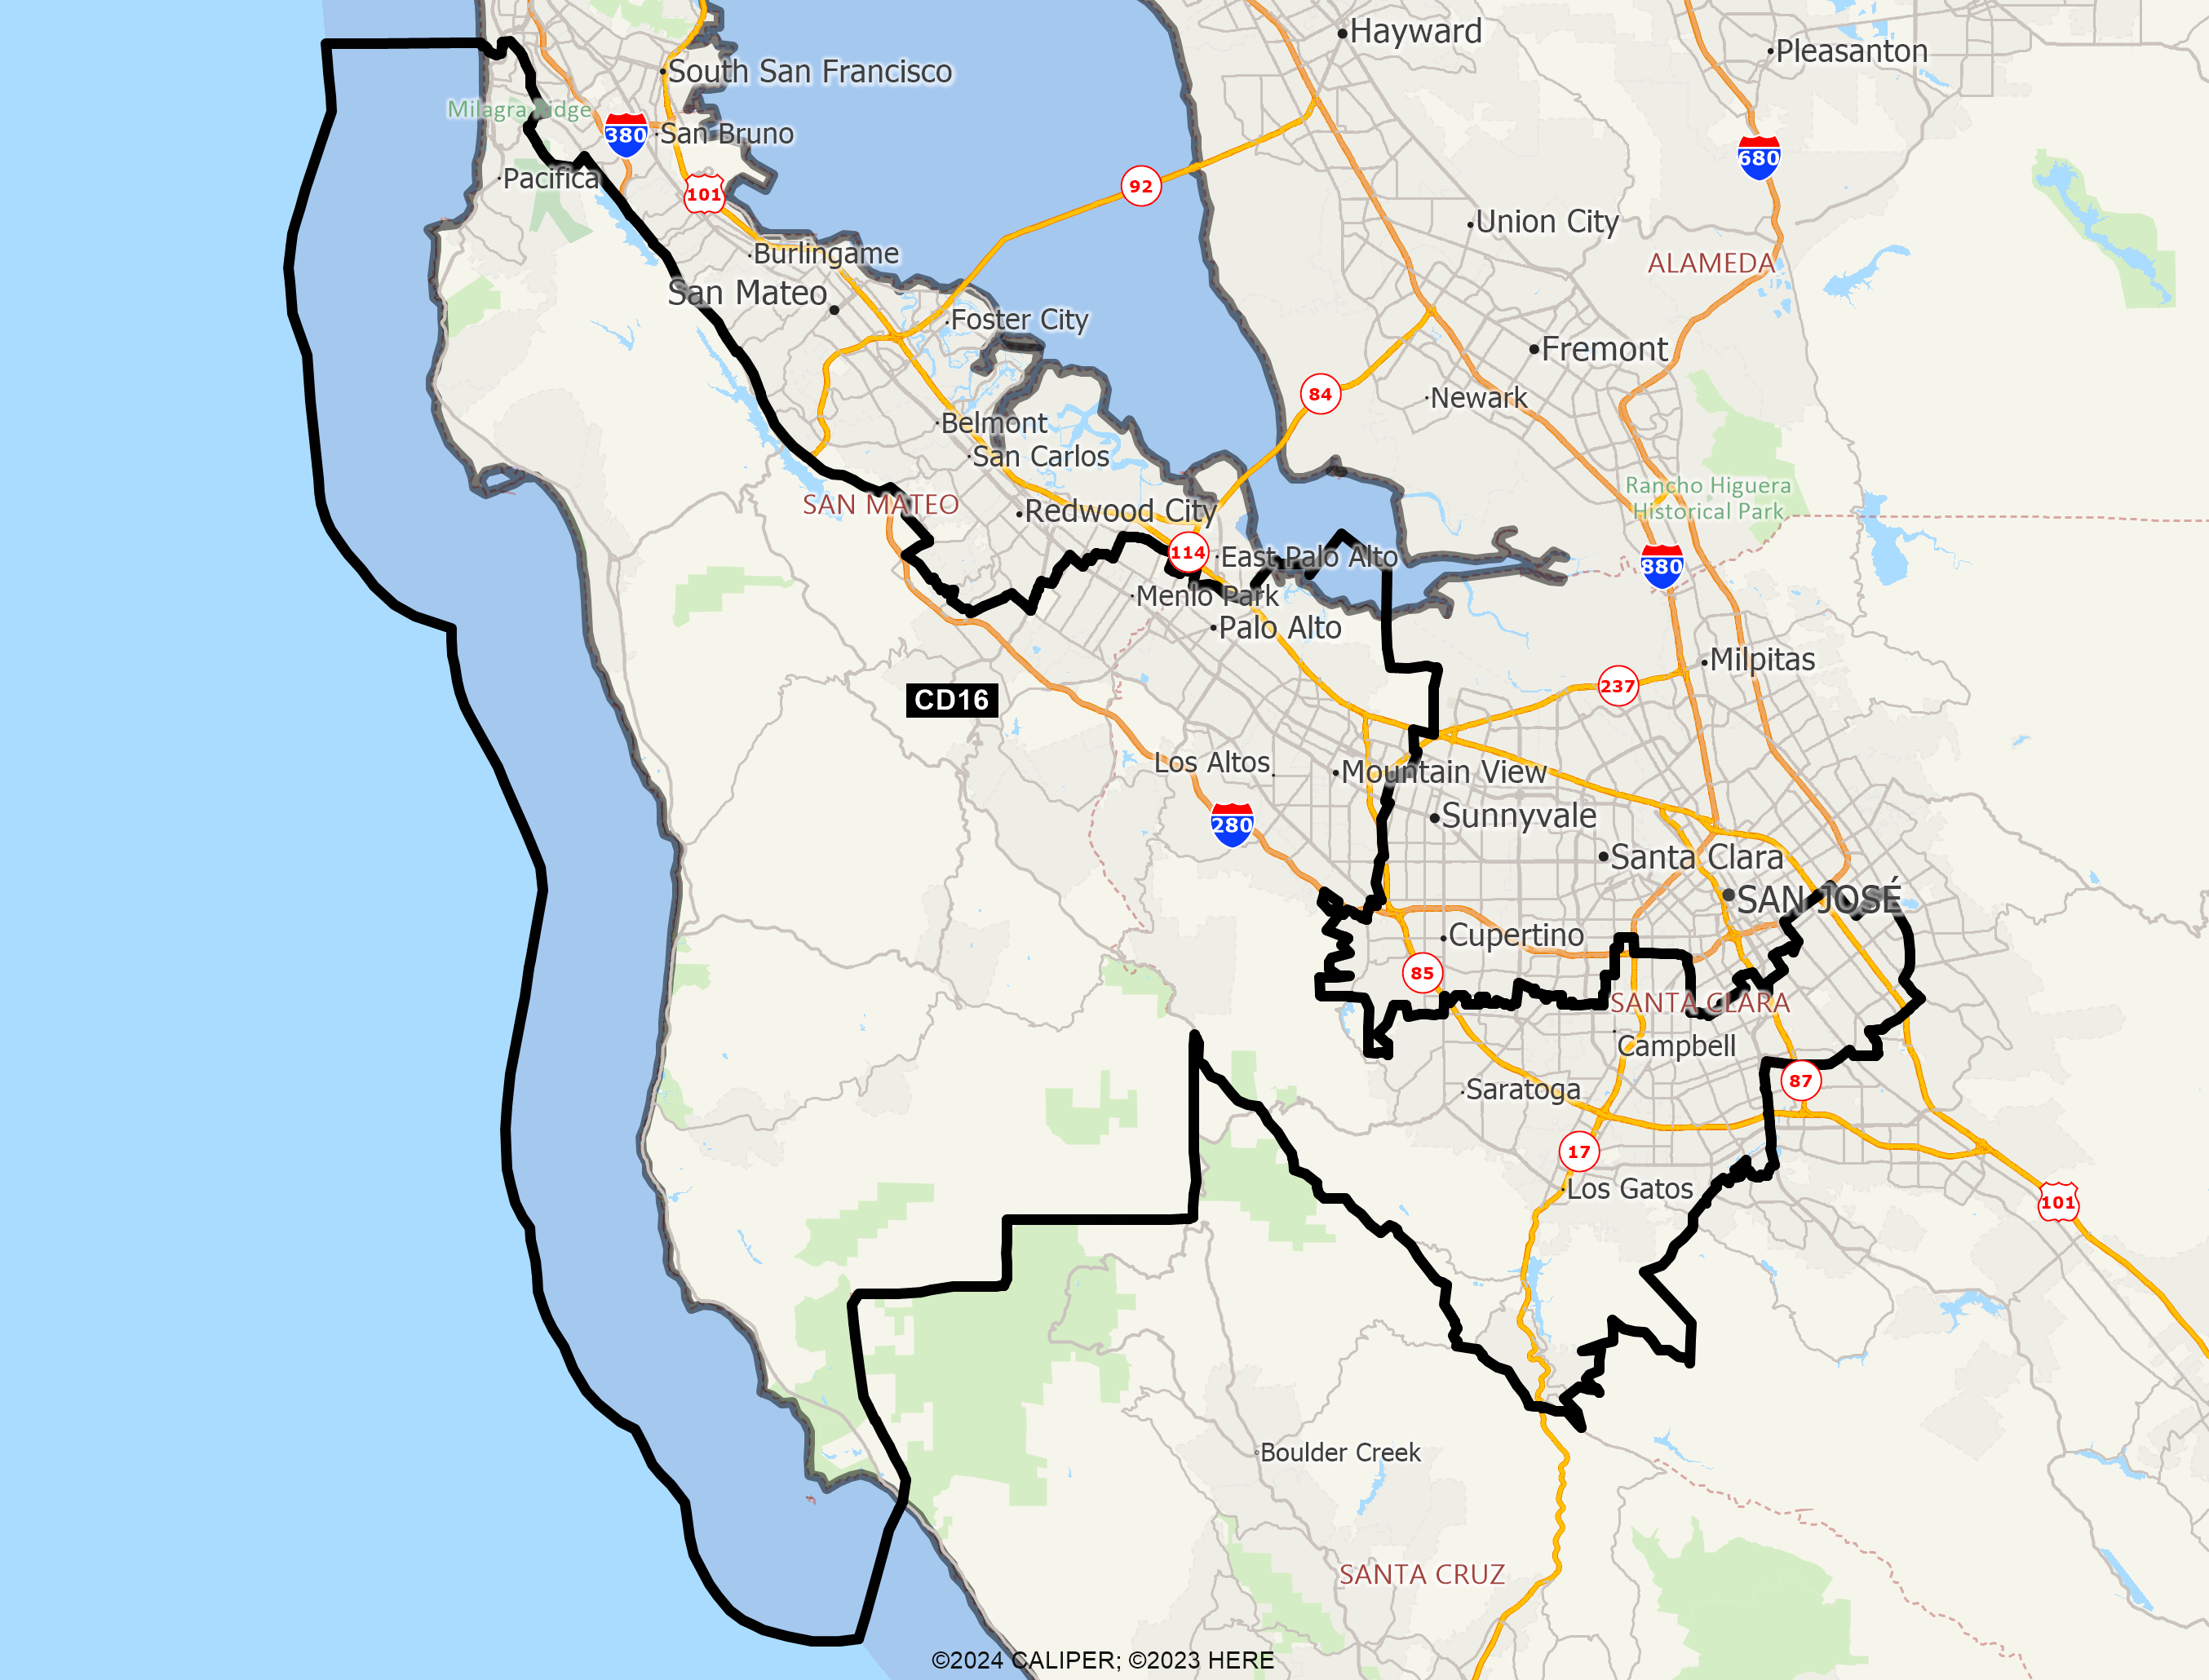
DISTRICT CD16
2020 Census Population (adj Elec. §21003 - SWDB 9/27/2021) Name Count Percent Total Population (POP) 760,066 100.00% POP Hispanic or Latino 151,126 19.88% POP Not Hispanic or Latino (NH) 608,940 80.12% POP NH Population of one race 570,306 75.03% POP NH White alone 322,755 42.46% POP NH Black or African American alone 14,300 1.88% POP NH Asian alone 225,345 29.65% POP NH American Indian and Alaska Native alone 1,097 0.14% POP NH Native Hawaiian and Other Pacific Islander alone 2,327 0.31% POP NH Some Other Race alone 4,482 0.59% POP NH Population of two or more races 38,634 5.08% POP DOJ NH Black or African American 17,360 2.28% POP DOJ NH Asian 246,272 32.40% POP DOJ NH American Indian and Alaska Native 4,744 0.62% POP DOJ NH Native Hawaiian and Other Pacific Islander 3,013 0.40% POP DOJ NH Some Other Race 9,983 1.31% POP DOJ NH Balance of Population of two or more races 4,813 0.63%
2020 Census Voting Age Population (adj Elec. §21003 - SWDB 9/27/2021) Name Count Percent Total Voting Age Population (VAP) 601,332 100.00% VAP Hispanic or Latino 109,163 18.15% VAP Not Hispanic or Latino (NH) 492,169 81.85% VAP NH Population of one race 469,802 78.13% VAP NH White alone 271,976 45.23% VAP NH Black or African American alone 11,996 1.99% VAP NH Asian alone 179,777 29.90% VAP NH American Indian and Alaska Native alone 910 0.15% VAP NH Native Hawaiian and Other Pacific Islander alone 1,876 0.31% VAP NH Some Other Race alone 3,267 0.54% VAP NH Population of two or more races 22,367 3.72% VAP DOJ NH Black or African American 13,852 2.30% VAP DOJ NH Asian 189,445 31.50% VAP DOJ NH American Indian and Alaska Native 3,926 0.65% VAP DOJ NH Native Hawaiian and Other Pacific Islander 2,359 0.39% VAP DOJ NH Some Other Race 7,418 1.23% VAP DOJ NH Balance of Population of two or more races 3,193 0.53%
2020 Census Housing Occupancy Status Name Count Percent Total Housing Units 284,953 100.00% Occupied 269,920 94.72% Vacant 15,033 5.28%
2020 Census Group Quarters Population (adj Elec. §21003 - SWDB 9/27/2021) Name Count Percent Total Group Quarters Population: 20,723 100.00% Institutionalized population: 3,912 18.88% Correctional facilities for adults 57 0.28% Juvenile facilities 62 0.30% Nursing facilities/Skilled-nursing facilities 3,453 16.66% Other institutional facilities 340 1.64% Noninstitutionalized population: 16,811 81.12% College/University student housing 13,016 62.81% Military quarters 0 0.00% Other noninstitutional facilities 3,795 18.31%
2019-2023 ACS Citizen Population (adj Elec. §21003 - SWDB 7/16/2025) Name Count Percent Total Citizen Population (CITZ) 634,945 100.00% CITZ Hispanic or Latino 118,492 18.66% CITZ Not Hispanic or Latino (NH) 516,204 81.30% CITZ NH White alone 294,251 46.34% CITZ NH Black or African American Alone 14,064 2.21% CITZ NH Asian Alone 173,833 27.38% CITZ NH American Indian and Alaska Native Alone 901 0.14% CITZ NH Native Hawaiian and Other Pacific Islander alone 3,316 0.52% CITZ NH Black or African American and White 4,450 0.70% CITZ NH American Indian or Alaska Native and White 18,541 2.92% CITZ NH Asian and White 2,677 0.42% CITZ NH American Indian or Alaska Native and Black or African American 151 0.02% CITZ NH Remainder of Two or More Race 4,257 0.67% CITZ DOJ NH Black or African American 18,514 2.92% CITZ DOJ NH Asian 192,374 30.30% CITZ DOJ NH American Indian and Alaska Native 3,578 0.56%
2019-2023 ACS Citizen Voting Age Population (adj Elec. §21003 - SWDB 7/16/2025) Name Count Percent Total Citizen Voting Age Population (CVAP) 483,495 100.00% CVAP Hispanic or Latino 76,093 15.74% CVAP Not Hispanic or Latino (NH) 407,184 84.22% CVAP NH White alone 245,129 50.70% CVAP NH Black or African American Alone 11,446 2.37% CVAP NH Asian Alone 132,667 27.44% CVAP NH American Indian and Alaska Native Alone 631 0.13% CVAP NH Native Hawaiian and Other Pacific Islander alone 1,886 0.39% CVAP NH Black or African American and White 2,550 0.53% CVAP NH Asian and White 7,955 1.65% CVAP NH American Indian or Alaska Native and White 2,065 0.43% CVAP NH American Indian or Alaska Native and Black or African American 151 0.03% CVAP NH Remainder of Two or More Race 2,648 0.55% CVAP DOJ NH Black or African American 13,996 2.89% CVAP DOJ NH Asian 140,622 29.08% CVAP DOJ NH American Indian and Alaska Native 2,696 0.56%
Counties In District Name Count Percent San Mateo 120,277 15.71% Santa Clara 639,795 32.98%
Places In District Name Count Percent SAN MATEO: Atherton(C) 6,995 97.23% SAN MATEO: El Granada(U) 5,485 100.00% SAN MATEO: Half Moon Bay(C) 11,814 100.00% SAN MATEO: Ladera(U) 1,558 100.00% SAN MATEO: La Honda(U) 980 100.00% SAN MATEO: Loma Mar(U) 134 100.00% SAN MATEO: Menlo Park(C) 23,208 68.60% SAN MATEO: Montara(U) 2,838 100.00% SAN MATEO: Moss Beach(U) 3,218 100.00% SAN MATEO: Pacifica(C) 38,674 100.00% SAN MATEO: Pescadero(U) 595 100.00% SAN MATEO: Portola Valley(C) 4,457 100.00% SAN MATEO: West Menlo Park(U) 3,934 100.00% SAN MATEO: Woodside(C) 5,313 100.00% SAN MATEO: Remainder of San Mateo(R) 11,074 63.02% SANTA CLARA: Burbank(U) 0 0.00% SANTA CLARA: Cambrian Park(U) 3,724 100.00% SANTA CLARA: Campbell(C) 44,028 100.00% SANTA CLARA: Fruitdale(U) 990 100.00% SANTA CLARA: Lexington Hills(U) 2,495 100.00% SANTA CLARA: Los Altos(C) 31,668 100.00% SANTA CLARA: Los Altos Hills(C) 8,501 100.00% SANTA CLARA: Los Gatos(C) 33,585 100.00% SANTA CLARA: Loyola(U) 3,498 100.00% SANTA CLARA: Monte Sereno(C) 3,482 100.00% SANTA CLARA: Mountain View(C) 82,486 100.00% SANTA CLARA: Palo Alto(C) 68,654 100.00% SANTA CLARA: San Jose(C) 297,414 29.28% SANTA CLARA: Saratoga(C) 31,080 100.00% SANTA CLARA: Stanford(U) 21,168 100.00% SANTA CLARA: Remainder of Santa Clara(R) 7,022 24.86%
Senate Office of Demographics 02/2026