This Congressional district was established by the voters of California with the passage of Proposition 50 (2025) on November 4, 2025 and will go into effect after the November 2026 elections and upon seating of the 120th Congress, January 3, 2027. This district will stay in use until the California Citizens Redistricting Commission draws new maps following the 2030 U.S. Census .
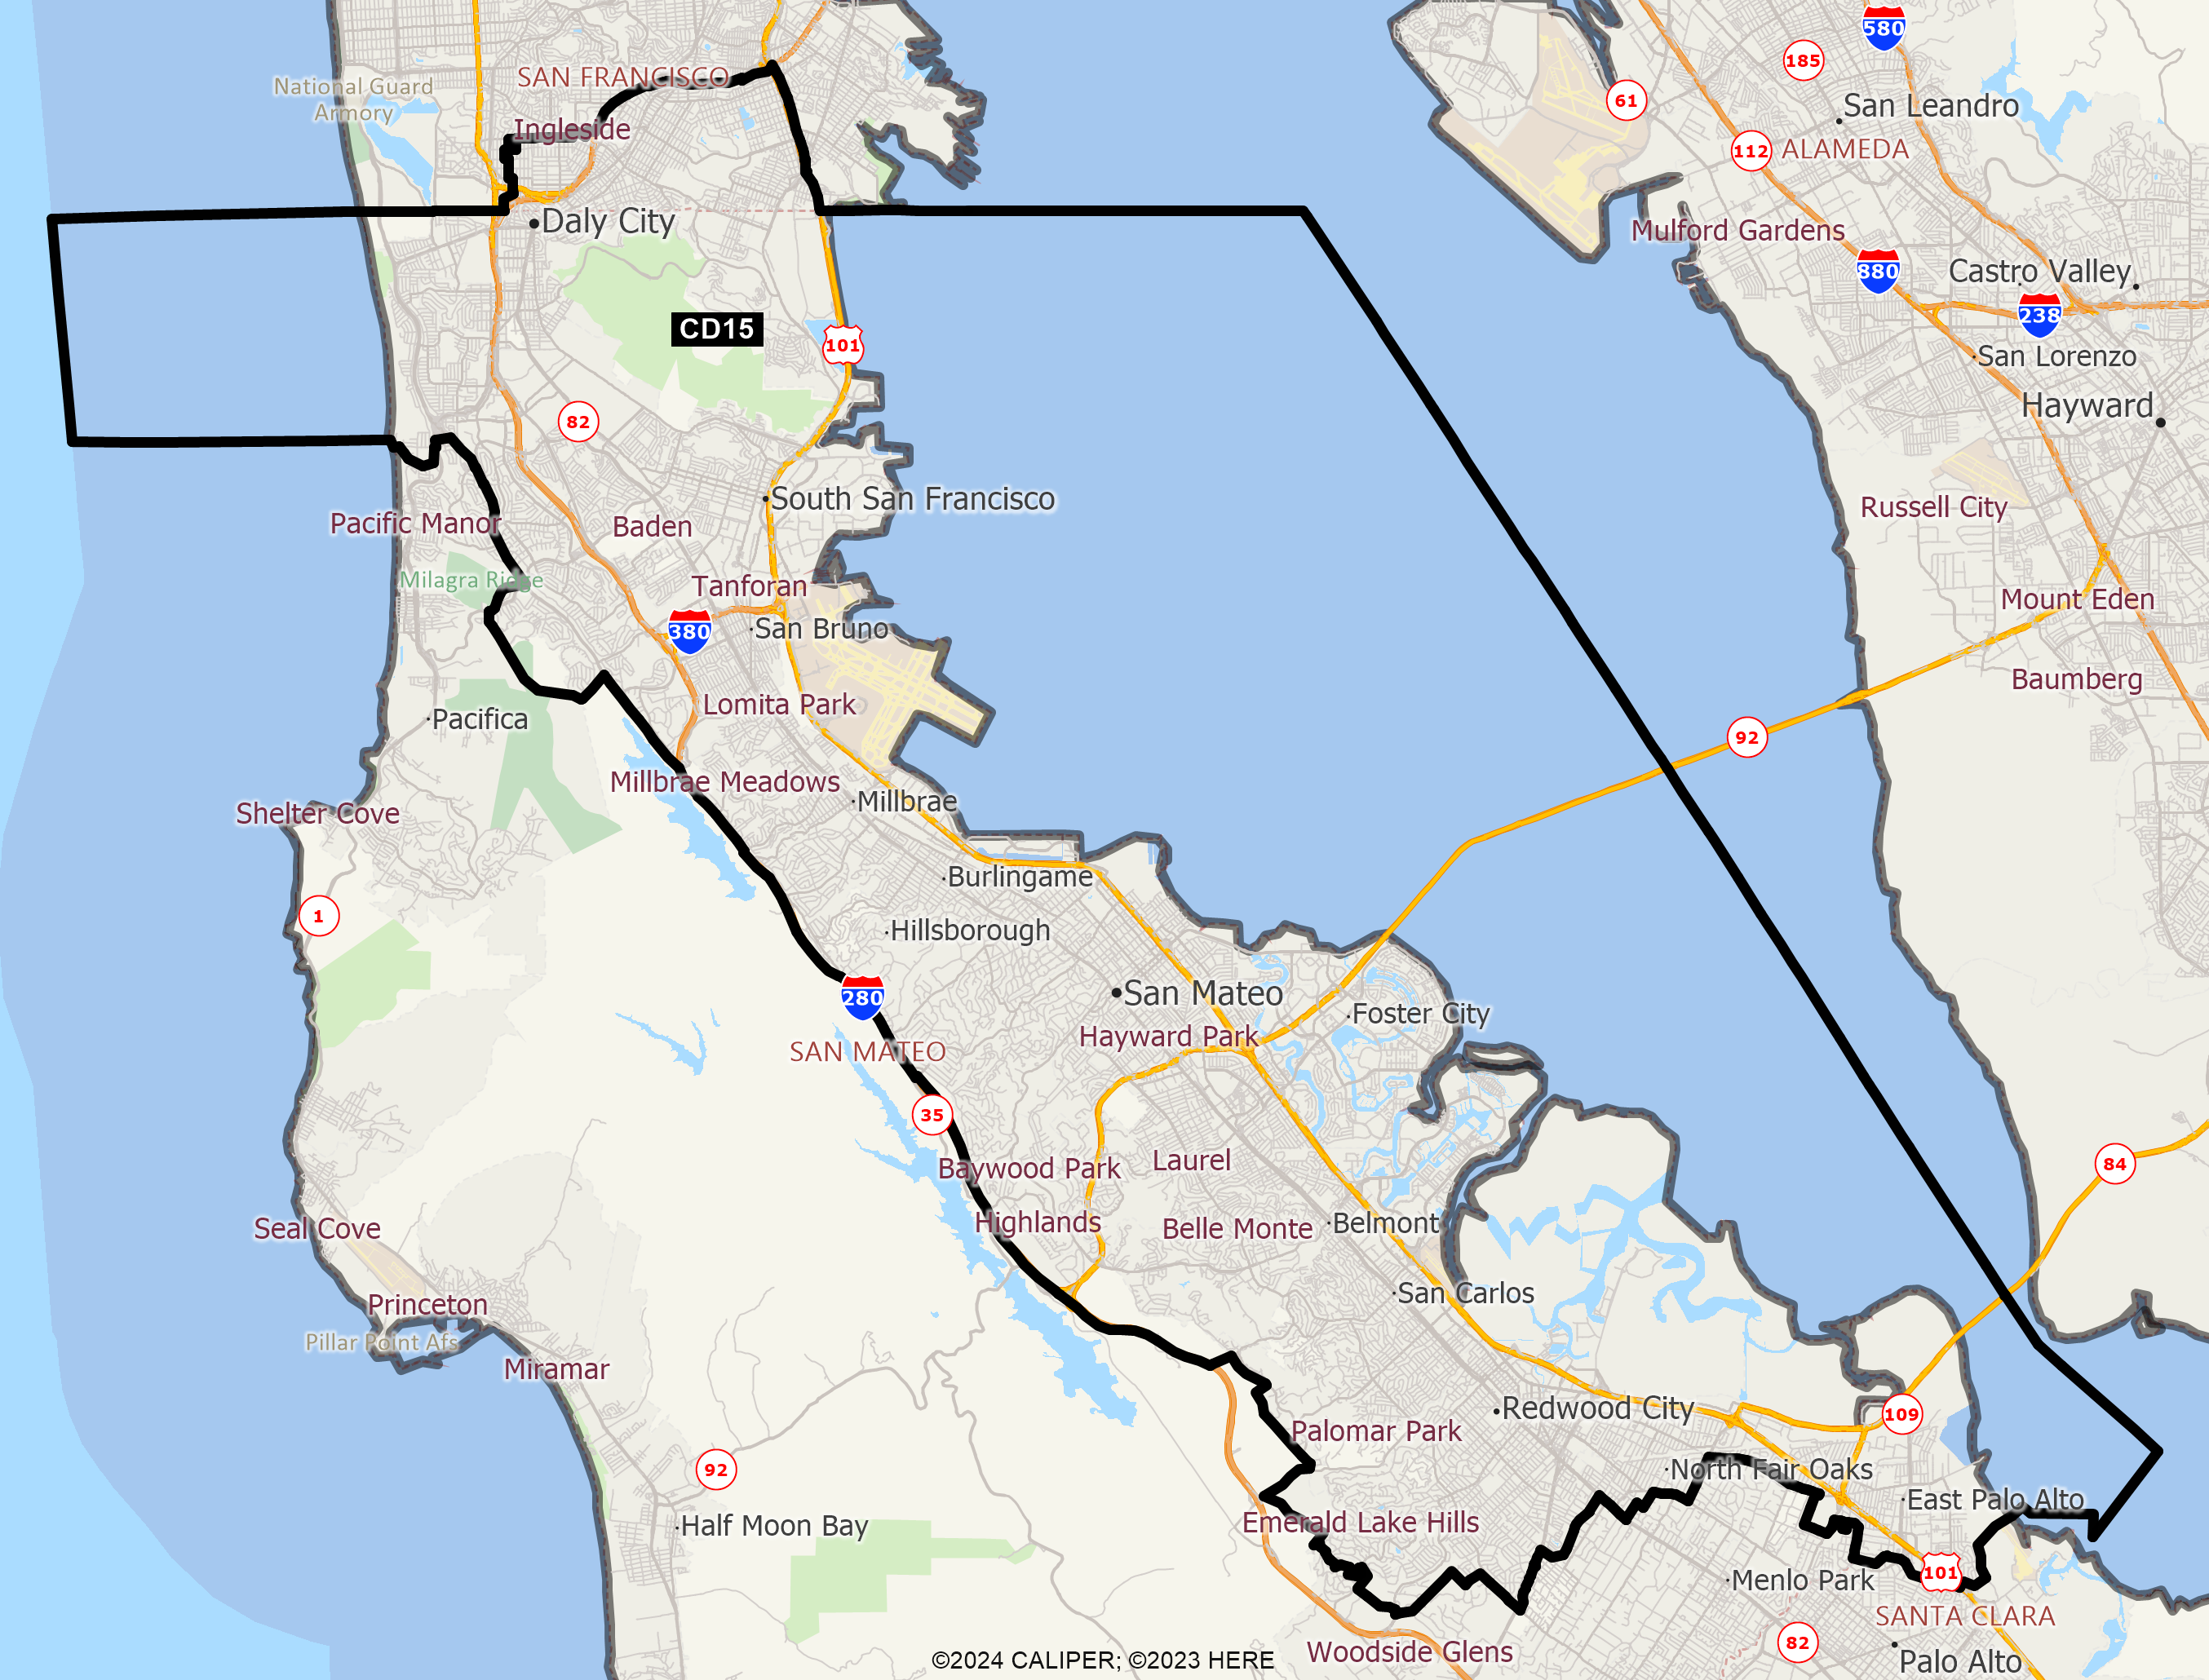
DISTRICT CD15
2020 Census Population (adj Elec. §21003 - SWDB 9/27/2021) Name Count Percent Total Population (POP) 760,066 100.00% POP Hispanic or Latino 201,867 26.56% POP Not Hispanic or Latino (NH) 558,199 73.44% POP NH Population of one race 523,658 68.90% POP NH White alone 216,763 28.52% POP NH Black or African American alone 19,176 2.52% POP NH Asian alone 271,935 35.78% POP NH American Indian and Alaska Native alone 962 0.13% POP NH Native Hawaiian and Other Pacific Islander alone 9,166 1.21% POP NH Some Other Race alone 5,656 0.74% POP NH Population of two or more races 34,541 4.54% POP DOJ NH Black or African American 21,862 2.88% POP DOJ NH Asian 288,969 38.02% POP DOJ NH American Indian and Alaska Native 3,040 0.40% POP DOJ NH Native Hawaiian and Other Pacific Islander 9,993 1.31% POP DOJ NH Some Other Race 10,736 1.41% POP DOJ NH Balance of Population of two or more races 6,836 0.90%
2020 Census Voting Age Population (adj Elec. §21003 - SWDB 9/27/2021) Name Count Percent Total Voting Age Population (VAP) 610,975 100.00% VAP Hispanic or Latino 150,720 24.67% VAP Not Hispanic or Latino (NH) 460,255 75.33% VAP NH Population of one race 439,574 71.95% VAP NH White alone 184,255 30.16% VAP NH Black or African American alone 16,710 2.73% VAP NH Asian alone 226,408 37.06% VAP NH American Indian and Alaska Native alone 796 0.13% VAP NH Native Hawaiian and Other Pacific Islander alone 7,232 1.18% VAP NH Some Other Race alone 4,173 0.68% VAP NH Population of two or more races 20,681 3.38% VAP DOJ NH Black or African American 18,492 3.03% VAP DOJ NH Asian 234,398 38.36% VAP DOJ NH American Indian and Alaska Native 2,539 0.42% VAP DOJ NH Native Hawaiian and Other Pacific Islander 7,805 1.28% VAP DOJ NH Some Other Race 8,090 1.32% VAP DOJ NH Balance of Population of two or more races 4,676 0.77%
2020 Census Housing Occupancy Status Name Count Percent Total Housing Units 269,586 100.00% Occupied 257,080 95.36% Vacant 12,506 4.64%
2020 Census Group Quarters Population (adj Elec. §21003 - SWDB 9/27/2021) Name Count Percent Total Group Quarters Population: 8,626 100.00% Institutionalized population: 3,408 39.51% Correctional facilities for adults 1,411 16.36% Juvenile facilities 71 0.82% Nursing facilities/Skilled-nursing facilities 1,892 21.93% Other institutional facilities 34 0.39% Noninstitutionalized population: 5,218 60.49% College/University student housing 365 4.23% Military quarters 0 0.00% Other noninstitutional facilities 4,853 56.26%
2019-2023 ACS Citizen Population (adj Elec. §21003 - SWDB 7/16/2025) Name Count Percent Total Citizen Population (CITZ) 627,293 100.00% CITZ Hispanic or Latino 146,866 23.41% CITZ Not Hispanic or Latino (NH) 480,464 76.59% CITZ NH White alone 203,874 32.50% CITZ NH Black or African American Alone 18,094 2.88% CITZ NH Asian Alone 224,517 35.79% CITZ NH American Indian and Alaska Native Alone 1,025 0.16% CITZ NH Native Hawaiian and Other Pacific Islander alone 7,363 1.17% CITZ NH Black or African American and White 3,097 0.49% CITZ NH American Indian or Alaska Native and White 16,253 2.59% CITZ NH Asian and White 1,176 0.19% CITZ NH American Indian or Alaska Native and Black or African American 319 0.05% CITZ NH Remainder of Two or More Race 4,832 0.77% CITZ DOJ NH Black or African American 21,191 3.38% CITZ DOJ NH Asian 240,770 38.38% CITZ DOJ NH American Indian and Alaska Native 2,201 0.35%
2019-2023 ACS Citizen Voting Age Population (adj Elec. §21003 - SWDB 7/16/2025) Name Count Percent Total Citizen Voting Age Population (CVAP) 490,568 100.00% CVAP Hispanic or Latino 101,204 20.63% CVAP Not Hispanic or Latino (NH) 389,428 79.38% CVAP NH White alone 172,630 35.19% CVAP NH Black or African American Alone 15,754 3.21% CVAP NH Asian Alone 181,762 37.05% CVAP NH American Indian and Alaska Native Alone 745 0.15% CVAP NH Native Hawaiian and Other Pacific Islander alone 5,479 1.12% CVAP NH Black or African American and White 1,555 0.32% CVAP NH Asian and White 7,169 1.46% CVAP NH American Indian or Alaska Native and White 1,046 0.21% CVAP NH American Indian or Alaska Native and Black or African American 239 0.05% CVAP NH Remainder of Two or More Race 3,125 0.64% CVAP DOJ NH Black or African American 17,309 3.53% CVAP DOJ NH Asian 188,931 38.51% CVAP DOJ NH American Indian and Alaska Native 1,791 0.37%
Counties In District Name Count Percent San Francisco 114,928 13.13% San Mateo 645,140 84.29%
Places In District Name Count Percent SAN FRANCISCO: San Francisco(C) 114,928 13.13% SAN MATEO: Atherton(C) 199 2.77% SAN MATEO: Baywood Park(U) 1,694 100.00% SAN MATEO: Belmont(C) 28,361 100.00% SAN MATEO: Brisbane(C) 4,858 100.00% SAN MATEO: Broadmoor(U) 4,415 100.00% SAN MATEO: Burlingame(C) 31,416 100.00% SAN MATEO: Colma(C) 1,510 100.00% SAN MATEO: Daly City(C) 105,024 100.00% SAN MATEO: East Palo Alto(C) 30,139 100.00% SAN MATEO: Emerald Lake Hills(U) 4,410 100.00% SAN MATEO: Foster City(C) 33,841 100.00% SAN MATEO: Highlands(U) 2,362 100.00% SAN MATEO: Hillsborough(C) 11,393 100.00% SAN MATEO: Menlo Park(C) 10,622 31.40% SAN MATEO: Millbrae(C) 23,227 100.00% SAN MATEO: North Fair Oaks(U) 14,064 100.00% SAN MATEO: Redwood City(C) 84,423 100.00% SAN MATEO: San Bruno(C) 43,947 100.00% SAN MATEO: San Carlos(C) 30,748 100.00% SAN MATEO: San Mateo(C) 105,806 100.00% SAN MATEO: South San Francisco(C) 66,184 100.00% SAN MATEO: Remainder of San Mateo(R) 6,497 36.98%
Senate Office of Demographics 02/2026