This Congressional district was established by the voters of California with the passage of Proposition 50 (2025) on November 4, 2025 and will go into effect after the November 2026 elections and upon seating of the 120th Congress, January 3, 2027. This district will stay in use until the California Citizens Redistricting Commission draws new maps following the 2030 U.S. Census .
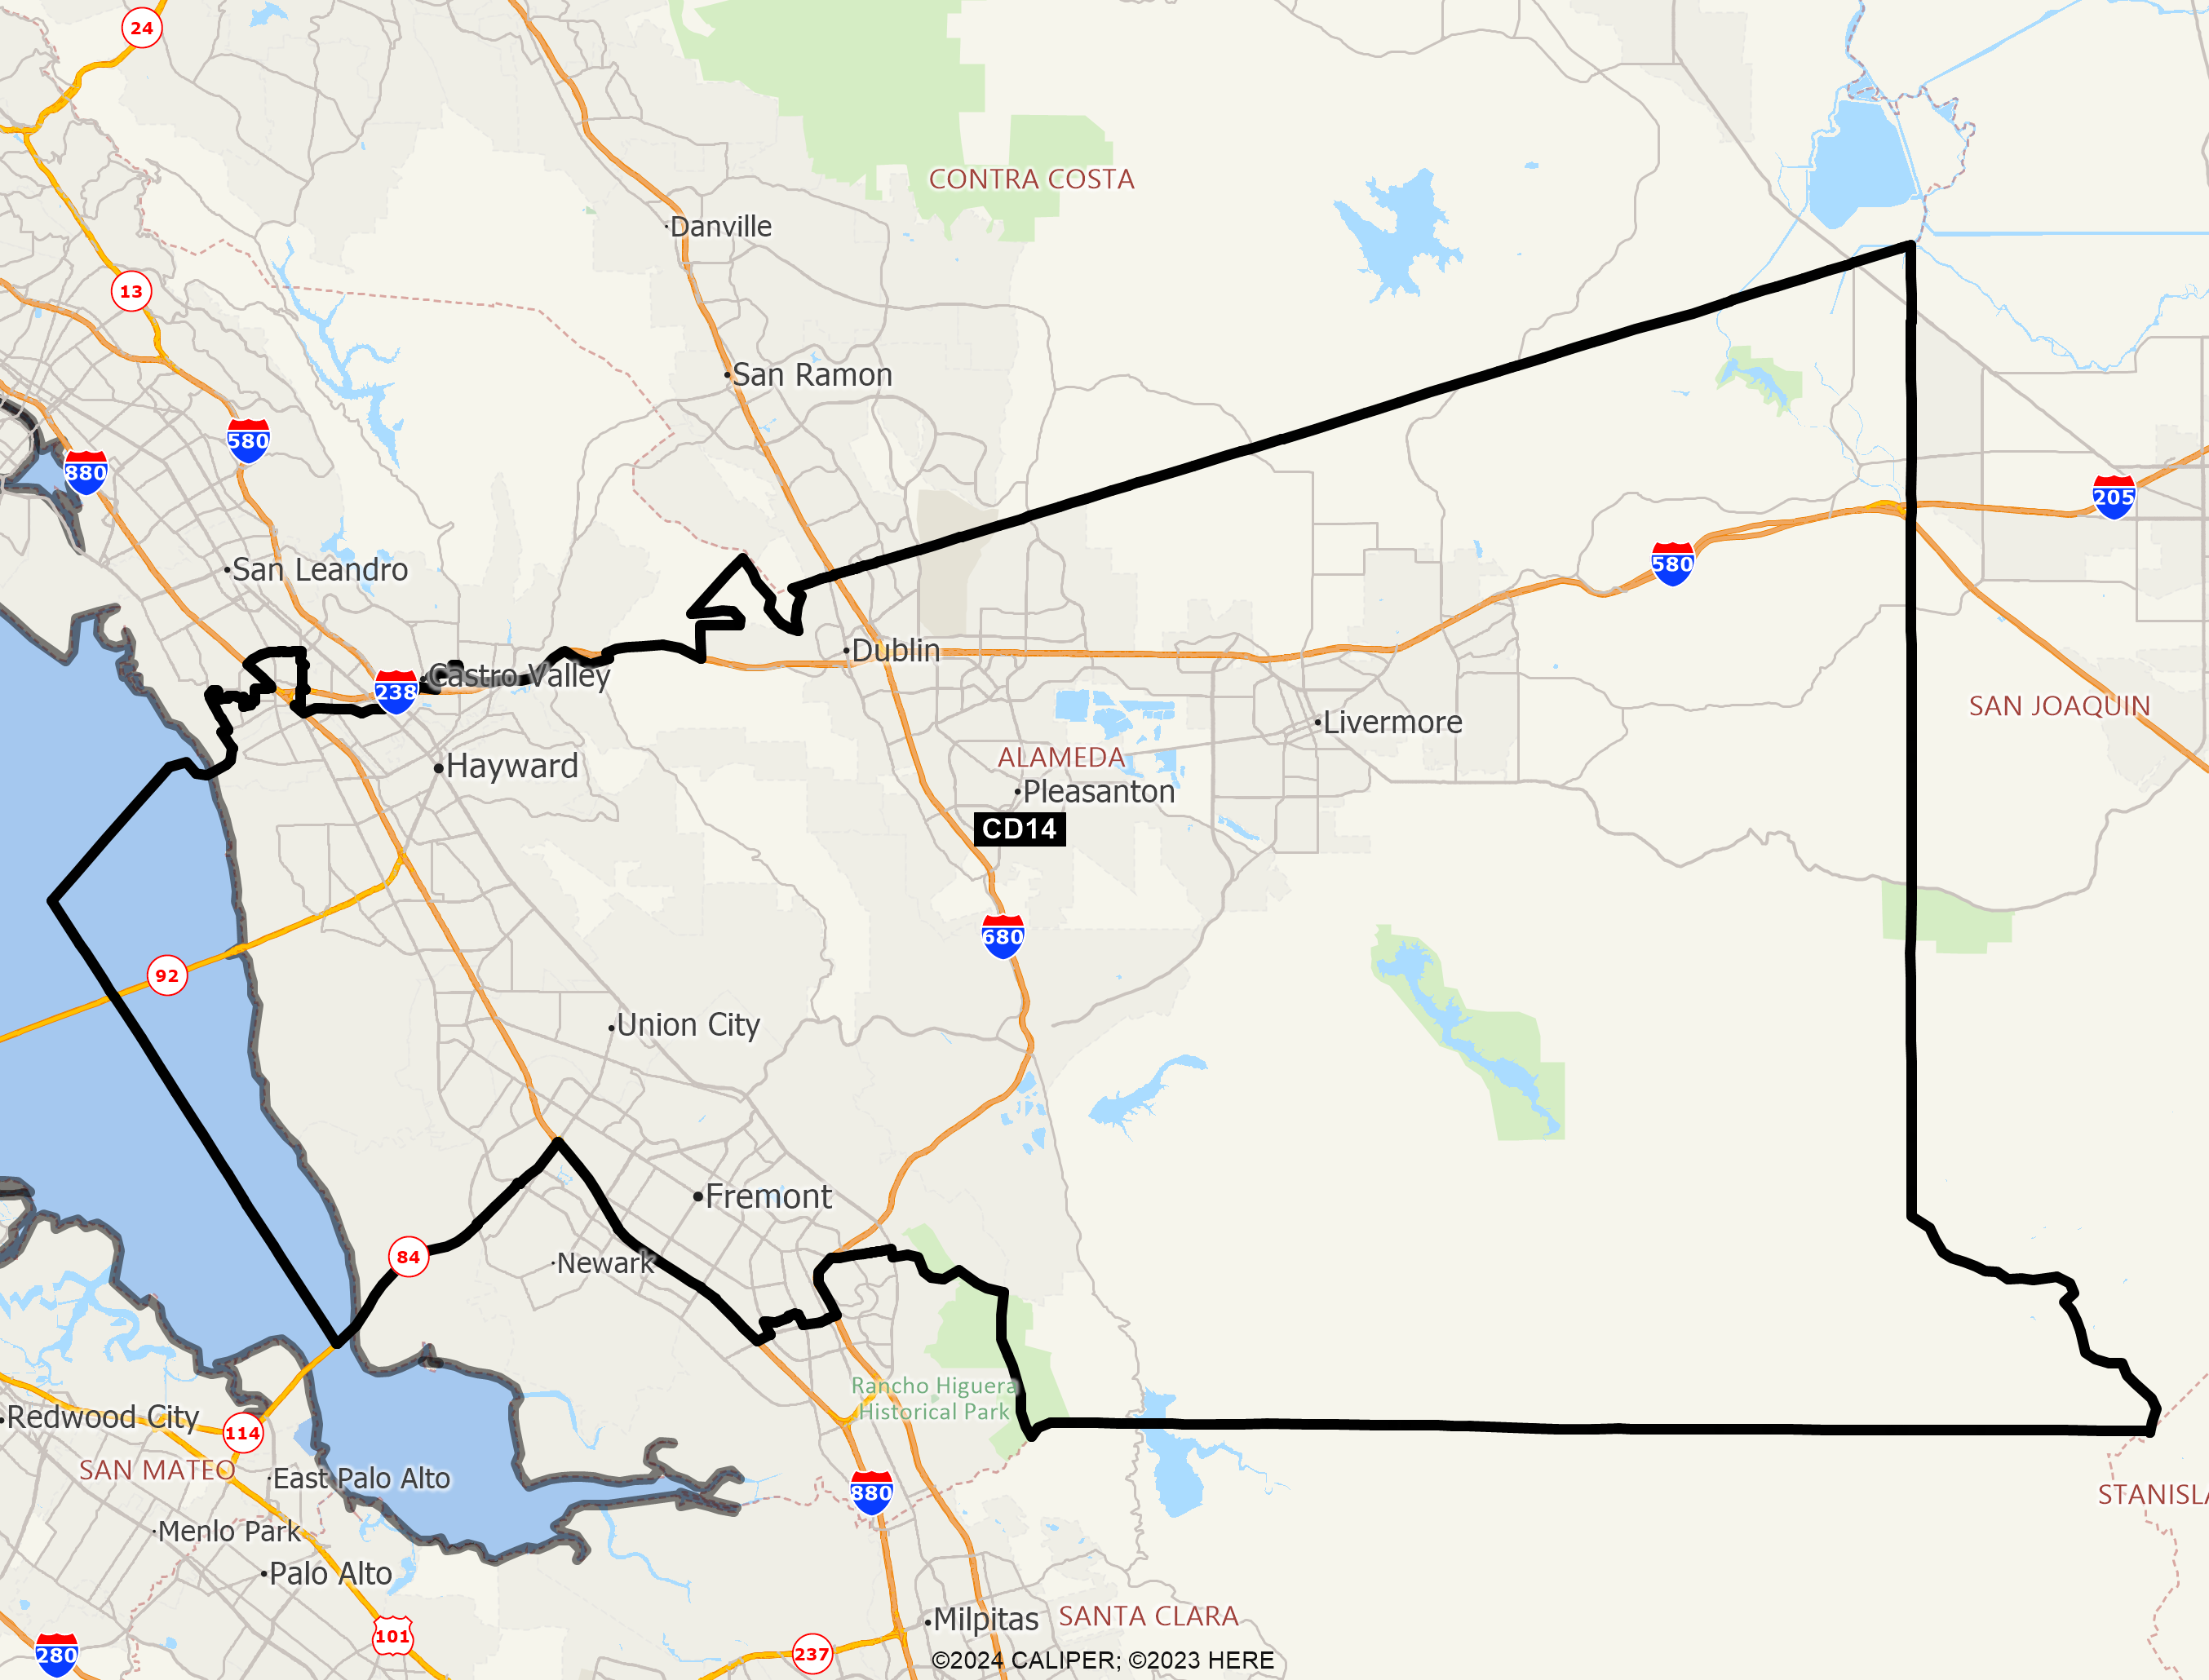
DISTRICT CD14
2020 Census Population (adj Elec. §21003 - SWDB 9/27/2021) Name Count Percent Total Population (POP) 760,065 100.00% POP Hispanic or Latino 177,264 23.32% POP Not Hispanic or Latino (NH) 582,801 76.68% POP NH Population of one race 548,351 72.15% POP NH White alone 185,775 24.44% POP NH Black or African American alone 34,892 4.59% POP NH Asian alone 313,556 41.25% POP NH American Indian and Alaska Native alone 1,732 0.23% POP NH Native Hawaiian and Other Pacific Islander alone 8,135 1.07% POP NH Some Other Race alone 4,261 0.56% POP NH Population of two or more races 34,450 4.53% POP DOJ NH Black or African American 38,009 5.00% POP DOJ NH Asian 328,727 43.25% POP DOJ NH American Indian and Alaska Native 5,025 0.66% POP DOJ NH Native Hawaiian and Other Pacific Islander 9,107 1.20% POP DOJ NH Some Other Race 7,501 0.99% POP DOJ NH Balance of Population of two or more races 8,657 1.14%
2020 Census Voting Age Population (adj Elec. §21003 - SWDB 9/27/2021) Name Count Percent Total Voting Age Population (VAP) 589,868 100.00% VAP Hispanic or Latino 127,974 21.70% VAP Not Hispanic or Latino (NH) 461,894 78.30% VAP NH Population of one race 439,822 74.56% VAP NH White alone 159,323 27.01% VAP NH Black or African American alone 28,234 4.79% VAP NH Asian alone 241,400 40.92% VAP NH American Indian and Alaska Native alone 1,363 0.23% VAP NH Native Hawaiian and Other Pacific Islander alone 6,518 1.10% VAP NH Some Other Race alone 2,984 0.51% VAP NH Population of two or more races 22,072 3.74% VAP DOJ NH Black or African American 30,187 5.12% VAP DOJ NH Asian 249,723 42.34% VAP DOJ NH American Indian and Alaska Native 4,146 0.70% VAP DOJ NH Native Hawaiian and Other Pacific Islander 7,198 1.22% VAP DOJ NH Some Other Race 5,499 0.93% VAP DOJ NH Balance of Population of two or more races 5,818 0.99%
2020 Census Housing Occupancy Status Name Count Percent Total Housing Units 258,293 100.00% Occupied 249,192 96.48% Vacant 9,101 3.52%
2020 Census Group Quarters Population (adj Elec. §21003 - SWDB 9/27/2021) Name Count Percent Total Group Quarters Population: 12,093 100.00% Institutionalized population: 4,801 39.70% Correctional facilities for adults 2,015 16.66% Juvenile facilities 288 2.38% Nursing facilities/Skilled-nursing facilities 2,491 20.60% Other institutional facilities 7 0.06% Noninstitutionalized population: 7,292 60.30% College/University student housing 1,408 11.64% Military quarters 210 1.74% Other noninstitutional facilities 5,674 46.92%
2019-2023 ACS Citizen Population (adj Elec. §21003 - SWDB 7/16/2025) Name Count Percent Total Citizen Population (CITZ) 613,616 100.00% CITZ Hispanic or Latino 137,614 22.43% CITZ Not Hispanic or Latino (NH) 476,006 77.57% CITZ NH White alone 178,315 29.06% CITZ NH Black or African American Alone 34,520 5.63% CITZ NH Asian Alone 226,107 36.85% CITZ NH American Indian and Alaska Native Alone 1,534 0.25% CITZ NH Native Hawaiian and Other Pacific Islander alone 6,424 1.05% CITZ NH Black or African American and White 3,740 0.61% CITZ NH American Indian or Alaska Native and White 15,011 2.45% CITZ NH Asian and White 1,681 0.27% CITZ NH American Indian or Alaska Native and Black or African American 716 0.12% CITZ NH Remainder of Two or More Race 7,758 1.26% CITZ DOJ NH Black or African American 38,260 6.24% CITZ DOJ NH Asian 241,118 39.29% CITZ DOJ NH American Indian and Alaska Native 3,215 0.52%
2019-2023 ACS Citizen Voting Age Population (adj Elec. §21003 - SWDB 7/16/2025) Name Count Percent Total Citizen Voting Age Population (CVAP) 464,109 100.00% CVAP Hispanic or Latino 93,757 20.20% CVAP Not Hispanic or Latino (NH) 370,330 79.79% CVAP NH White alone 151,680 32.68% CVAP NH Black or African American Alone 28,649 6.17% CVAP NH Asian Alone 166,365 35.85% CVAP NH American Indian and Alaska Native Alone 1,271 0.27% CVAP NH Native Hawaiian and Other Pacific Islander alone 4,797 1.03% CVAP NH Black or African American and White 2,139 0.46% CVAP NH Asian and White 8,243 1.78% CVAP NH American Indian or Alaska Native and White 1,475 0.32% CVAP NH American Indian or Alaska Native and Black or African American 666 0.14% CVAP NH Remainder of Two or More Race 4,878 1.05% CVAP DOJ NH Black or African American 30,788 6.63% CVAP DOJ NH Asian 174,608 37.62% CVAP DOJ NH American Indian and Alaska Native 2,746 0.59%
Counties In District Name Count Percent Alameda 760,064 45.15%
Places In District Name Count Percent ALAMEDA: Castro Valley(U) 13,675 20.57% ALAMEDA: Cherryland(U) 15,843 100.00% ALAMEDA: Dublin(C) 71,468 100.00% ALAMEDA: Fairview(U) 11,353 100.00% ALAMEDA: Fremont(C) 194,520 84.34% ALAMEDA: Hayward(C) 163,172 100.00% ALAMEDA: Livermore(C) 88,006 100.00% ALAMEDA: Pleasanton(C) 79,896 100.00% ALAMEDA: San Leandro(C) 17,625 19.35% ALAMEDA: San Lorenzo(U) 29,615 100.00% ALAMEDA: Sunol(U) 922 100.00% ALAMEDA: Union City(C) 70,218 100.00% ALAMEDA: Remainder of Alameda(R) 3,751 89.50%
Senate Office of Demographics 02/2026