This Congressional district was established by the voters of California with the passage of Proposition 50 (2025) on November 4, 2025 and will go into effect after the November 2026 elections and upon seating of the 120th Congress, January 3, 2027. This district will stay in use until the California Citizens Redistricting Commission draws new maps following the 2030 U.S. Census .
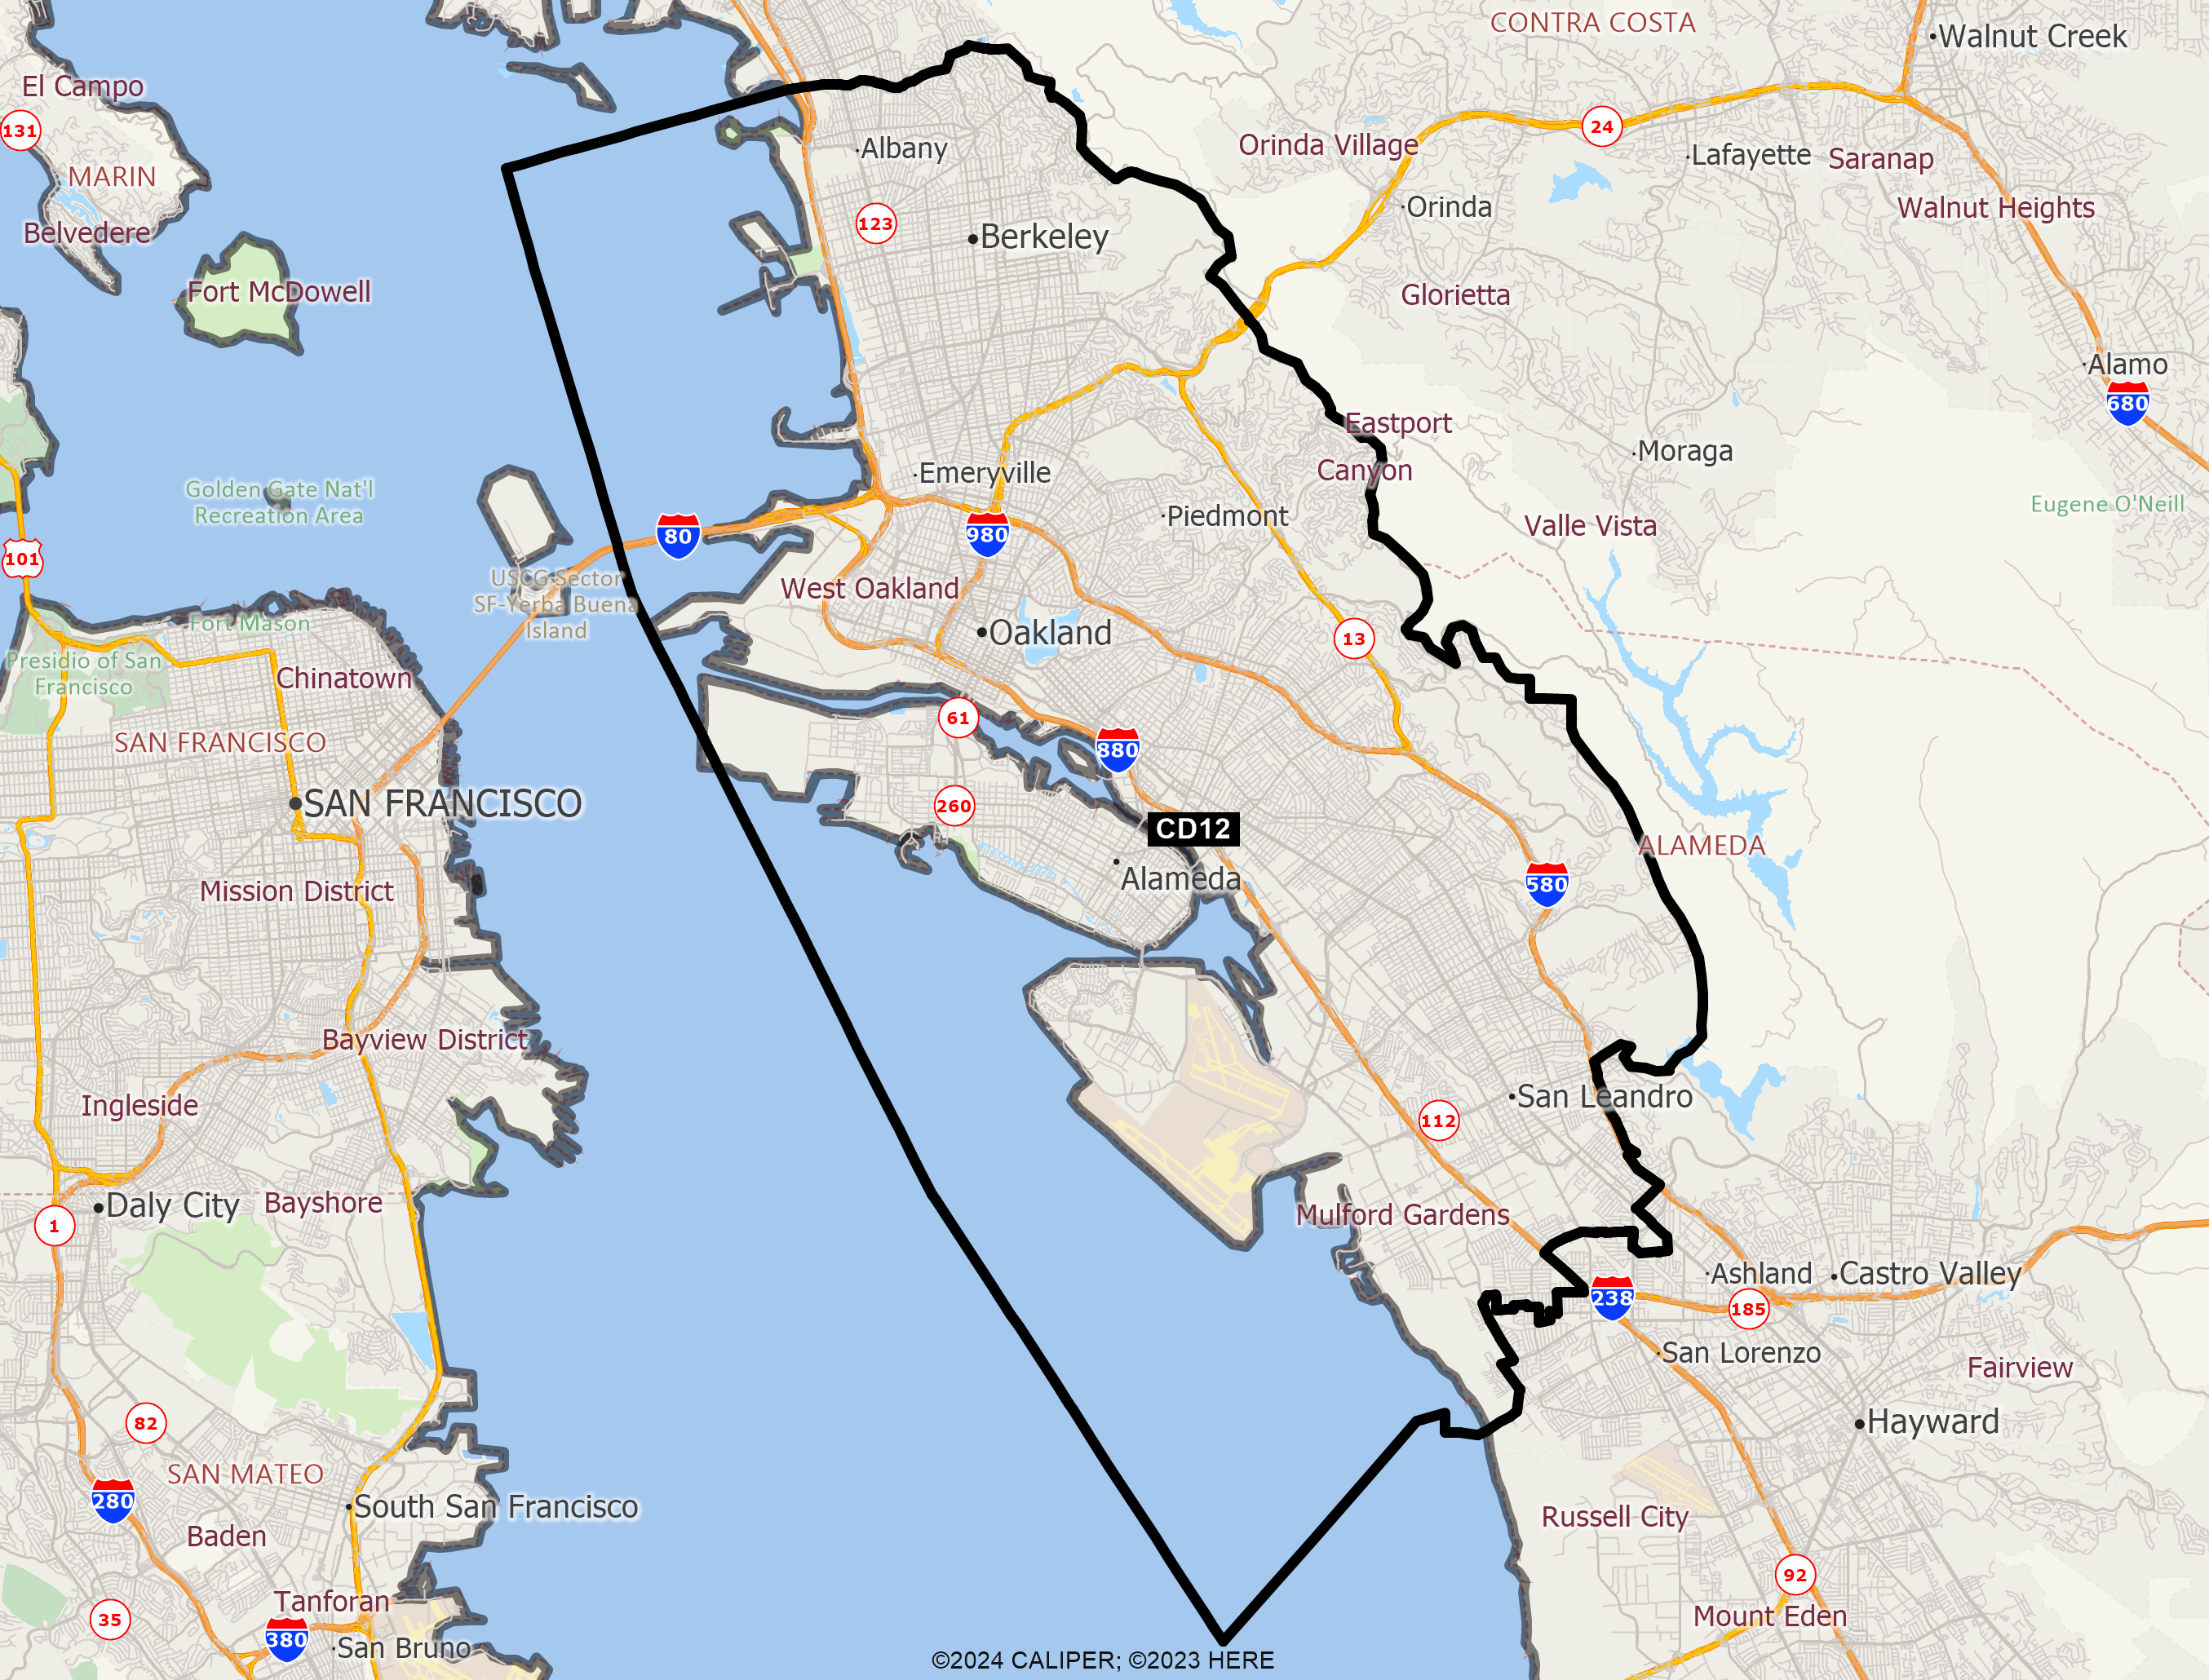
DISTRICT CD12
2020 Census Population (adj Elec. §21003 - SWDB 9/27/2021) Name Count Percent Total Population (POP) 760,065 100.00% POP Hispanic or Latino 179,534 23.62% POP Not Hispanic or Latino (NH) 580,531 76.38% POP NH Population of one race 533,823 70.23% POP NH White alone 249,406 32.81% POP NH Black or African American alone 116,970 15.39% POP NH Asian alone 156,144 20.54% POP NH American Indian and Alaska Native alone 2,002 0.26% POP NH Native Hawaiian and Other Pacific Islander alone 3,874 0.51% POP NH Some Other Race alone 5,427 0.71% POP NH Population of two or more races 46,708 6.15% POP DOJ NH Black or African American 125,003 16.45% POP DOJ NH Asian 174,806 23.00% POP DOJ NH American Indian and Alaska Native 4,966 0.65% POP DOJ NH Native Hawaiian and Other Pacific Islander 4,612 0.61% POP DOJ NH Some Other Race 10,843 1.43% POP DOJ NH Balance of Population of two or more races 10,895 1.43%
2020 Census Voting Age Population (adj Elec. §21003 - SWDB 9/27/2021) Name Count Percent Total Voting Age Population (VAP) 622,597 100.00% VAP Hispanic or Latino 131,750 21.16% VAP Not Hispanic or Latino (NH) 490,847 78.84% VAP NH Population of one race 459,936 73.87% VAP NH White alone 218,609 35.11% VAP NH Black or African American alone 97,281 15.63% VAP NH Asian alone 135,322 21.74% VAP NH American Indian and Alaska Native alone 1,624 0.26% VAP NH Native Hawaiian and Other Pacific Islander alone 2,895 0.46% VAP NH Some Other Race alone 4,205 0.68% VAP NH Population of two or more races 30,911 4.96% VAP DOJ NH Black or African American 102,614 16.48% VAP DOJ NH Asian 146,030 23.45% VAP DOJ NH American Indian and Alaska Native 4,184 0.67% VAP DOJ NH Native Hawaiian and Other Pacific Islander 3,442 0.55% VAP DOJ NH Some Other Race 8,527 1.37% VAP DOJ NH Balance of Population of two or more races 7,441 1.20%
2020 Census Housing Occupancy Status Name Count Percent Total Housing Units 308,758 100.00% Occupied 289,427 93.74% Vacant 19,331 6.26%
2020 Census Group Quarters Population (adj Elec. §21003 - SWDB 9/27/2021) Name Count Percent Total Group Quarters Population: 39,150 100.00% Institutionalized population: 3,580 9.14% Correctional facilities for adults 220 0.56% Juvenile facilities 89 0.23% Nursing facilities/Skilled-nursing facilities 3,246 8.29% Other institutional facilities 25 0.06% Noninstitutionalized population: 35,570 90.86% College/University student housing 16,055 41.01% Military quarters 211 0.54% Other noninstitutional facilities 19,304 49.31%
2019-2023 ACS Citizen Population (adj Elec. §21003 - SWDB 7/16/2025) Name Count Percent Total Citizen Population (CITZ) 653,423 100.00% CITZ Hispanic or Latino 130,431 19.96% CITZ Not Hispanic or Latino (NH) 523,041 80.05% CITZ NH White alone 245,088 37.51% CITZ NH Black or African American Alone 110,826 16.96% CITZ NH Asian Alone 122,036 18.68% CITZ NH American Indian and Alaska Native Alone 1,913 0.29% CITZ NH Native Hawaiian and Other Pacific Islander alone 2,855 0.44% CITZ NH Black or African American and White 10,109 1.55% CITZ NH American Indian or Alaska Native and White 19,414 2.97% CITZ NH Asian and White 1,782 0.27% CITZ NH American Indian or Alaska Native and Black or African American 1,281 0.20% CITZ NH Remainder of Two or More Race 7,650 1.17% CITZ DOJ NH Black or African American 120,935 18.51% CITZ DOJ NH Asian 141,450 21.65% CITZ DOJ NH American Indian and Alaska Native 3,695 0.57%
2019-2023 ACS Citizen Voting Age Population (adj Elec. §21003 - SWDB 7/16/2025) Name Count Percent Total Citizen Voting Age Population (CVAP) 522,733 100.00% CVAP Hispanic or Latino 85,819 16.42% CVAP Not Hispanic or Latino (NH) 436,818 83.56% CVAP NH White alone 211,235 40.41% CVAP NH Black or African American Alone 91,360 17.48% CVAP NH Asian Alone 105,899 20.26% CVAP NH American Indian and Alaska Native Alone 1,552 0.30% CVAP NH Native Hawaiian and Other Pacific Islander alone 2,334 0.45% CVAP NH Black or African American and White 6,082 1.16% CVAP NH Asian and White 10,614 2.03% CVAP NH American Indian or Alaska Native and White 1,568 0.30% CVAP NH American Indian or Alaska Native and Black or African American 1,111 0.21% CVAP NH Remainder of Two or More Race 4,841 0.93% CVAP DOJ NH Black or African American 97,442 18.64% CVAP DOJ NH Asian 116,513 22.29% CVAP DOJ NH American Indian and Alaska Native 3,120 0.60%
Counties In District Name Count Percent Alameda 760,064 45.15%
Places In District Name Count Percent ALAMEDA: Alameda(C) 78,353 100.00% ALAMEDA: Albany(C) 20,275 100.00% ALAMEDA: Berkeley(C) 124,432 100.00% ALAMEDA: Emeryville(C) 12,911 100.00% ALAMEDA: Oakland(C) 441,888 100.00% ALAMEDA: Piedmont(C) 11,274 100.00% ALAMEDA: San Leandro(C) 70,931 77.86%
Senate Office of Demographics 02/2026