This Congressional district was established by the voters of California with the passage of Proposition 50 (2025) on November 4, 2025 and will go into effect after the November 2026 elections and upon seating of the 120th Congress, January 3, 2027. This district will stay in use until the California Citizens Redistricting Commission draws new maps following the 2030 U.S. Census .
DISTRICT CD09 2020 Census Population 2020 Census Voting Age Population 2020 Census Housing Occupancy Status 2020 Census Group Quarters Population 2019-2023 ACS Citizen Population 2019-2023 ACS Citizen Voting Age Population Counties In District Places In District 2020 Census Population (adj Elec. §21003 - SWDB 9/27/2021) Name Count Percent Total Population (POP) 760,065 100.00% POP Hispanic or Latino 288,030 37.90% POP Not Hispanic or Latino (NH) 472,035 62.10% POP NH Population of one race 435,024 57.24% POP NH White alone 194,161 25.55% POP NH Black or African American alone 83,687 11.01% POP NH Asian alone 142,995 18.81% POP NH American Indian and Alaska Native alone 2,864 0.38% POP NH Native Hawaiian and Other Pacific Islander alone 6,571 0.86% POP NH Some Other Race alone 4,746 0.62% POP NH Population of two or more races 37,011 4.87% POP DOJ NH Black or African American 90,092 11.85% POP DOJ NH Asian 153,250 20.16% POP DOJ NH American Indian and Alaska Native 8,567 1.13% POP DOJ NH Native Hawaiian and Other Pacific Islander 7,548 0.99% POP DOJ NH Some Other Race 7,898 1.04% POP DOJ NH Balance of Population of two or more races 10,519 1.38%
2020 Census Voting Age Population (adj Elec. §21003 - SWDB 9/27/2021) Name Count Percent Total Voting Age Population (VAP) 564,934 100.00% VAP Hispanic or Latino 194,693 34.46% VAP Not Hispanic or Latino (NH) 370,241 65.54% VAP NH Population of one race 346,631 61.36% VAP NH White alone 163,944 29.02% VAP NH Black or African American alone 62,723 11.10% VAP NH Asian alone 109,352 19.36% VAP NH American Indian and Alaska Native alone 2,262 0.40% VAP NH Native Hawaiian and Other Pacific Islander alone 4,959 0.88% VAP NH Some Other Race alone 3,391 0.60% VAP NH Population of two or more races 23,610 4.18% VAP DOJ NH Black or African American 66,084 11.70% VAP DOJ NH Asian 115,363 20.42% VAP DOJ NH American Indian and Alaska Native 6,907 1.22% VAP DOJ NH Native Hawaiian and Other Pacific Islander 5,582 0.99% VAP DOJ NH Some Other Race 5,876 1.04% VAP DOJ NH Balance of Population of two or more races 6,485 1.15%
2020 Census Housing Occupancy Status Name Count Percent Total Housing Units 245,442 100.00% Occupied 236,192 96.23% Vacant 9,250 3.77%
2020 Census Group Quarters Population (adj Elec. §21003 - SWDB 9/27/2021) Name Count Percent Total Group Quarters Population: 10,519 100.00% Institutionalized population: 4,948 47.04% Correctional facilities for adults 1,361 12.94% Juvenile facilities 561 5.33% Nursing facilities/Skilled-nursing facilities 2,988 28.41% Other institutional facilities 38 0.36% Noninstitutionalized population: 5,571 52.96% College/University student housing 1,936 18.40% Military quarters 0 0.00% Other noninstitutional facilities 3,635 34.56%
2019-2023 ACS Citizen Population (adj Elec. §21003 - SWDB 7/16/2025) Name Count Percent Total Citizen Population (CITZ) 690,808 100.00% CITZ Hispanic or Latino 248,308 35.94% CITZ Not Hispanic or Latino (NH) 442,553 64.06% CITZ NH White alone 202,775 29.35% CITZ NH Black or African American Alone 77,965 11.29% CITZ NH Asian Alone 120,536 17.45% CITZ NH American Indian and Alaska Native Alone 2,142 0.31% CITZ NH Native Hawaiian and Other Pacific Islander alone 5,677 0.82% CITZ NH Black or African American and White 7,932 1.15% CITZ NH American Indian or Alaska Native and White 10,894 1.58% CITZ NH Asian and White 3,910 0.57% CITZ NH American Indian or Alaska Native and Black or African American 1,075 0.16% CITZ NH Remainder of Two or More Race 9,277 1.34% CITZ DOJ NH Black or African American 85,897 12.43% CITZ DOJ NH Asian 131,430 19.03% CITZ DOJ NH American Indian and Alaska Native 6,052 0.88%
2019-2023 ACS Citizen Voting Age Population (adj Elec. §21003 - SWDB 7/16/2025) Name Count Percent Total Citizen Voting Age Population (CVAP) 501,043 100.00% CVAP Hispanic or Latino 155,537 31.04% CVAP Not Hispanic or Latino (NH) 345,595 68.98% CVAP NH White alone 171,326 34.19% CVAP NH Black or African American Alone 58,831 11.74% CVAP NH Asian Alone 89,696 17.90% CVAP NH American Indian and Alaska Native Alone 1,469 0.29% CVAP NH Native Hawaiian and Other Pacific Islander alone 3,997 0.80% CVAP NH Black or African American and White 3,534 0.71% CVAP NH Asian and White 6,553 1.31% CVAP NH American Indian or Alaska Native and White 3,433 0.69% CVAP NH American Indian or Alaska Native and Black or African American 787 0.16% CVAP NH Remainder of Two or More Race 5,587 1.12% CVAP DOJ NH Black or African American 62,365 12.45% CVAP DOJ NH Asian 96,249 19.21% CVAP DOJ NH American Indian and Alaska Native 4,902 0.98%
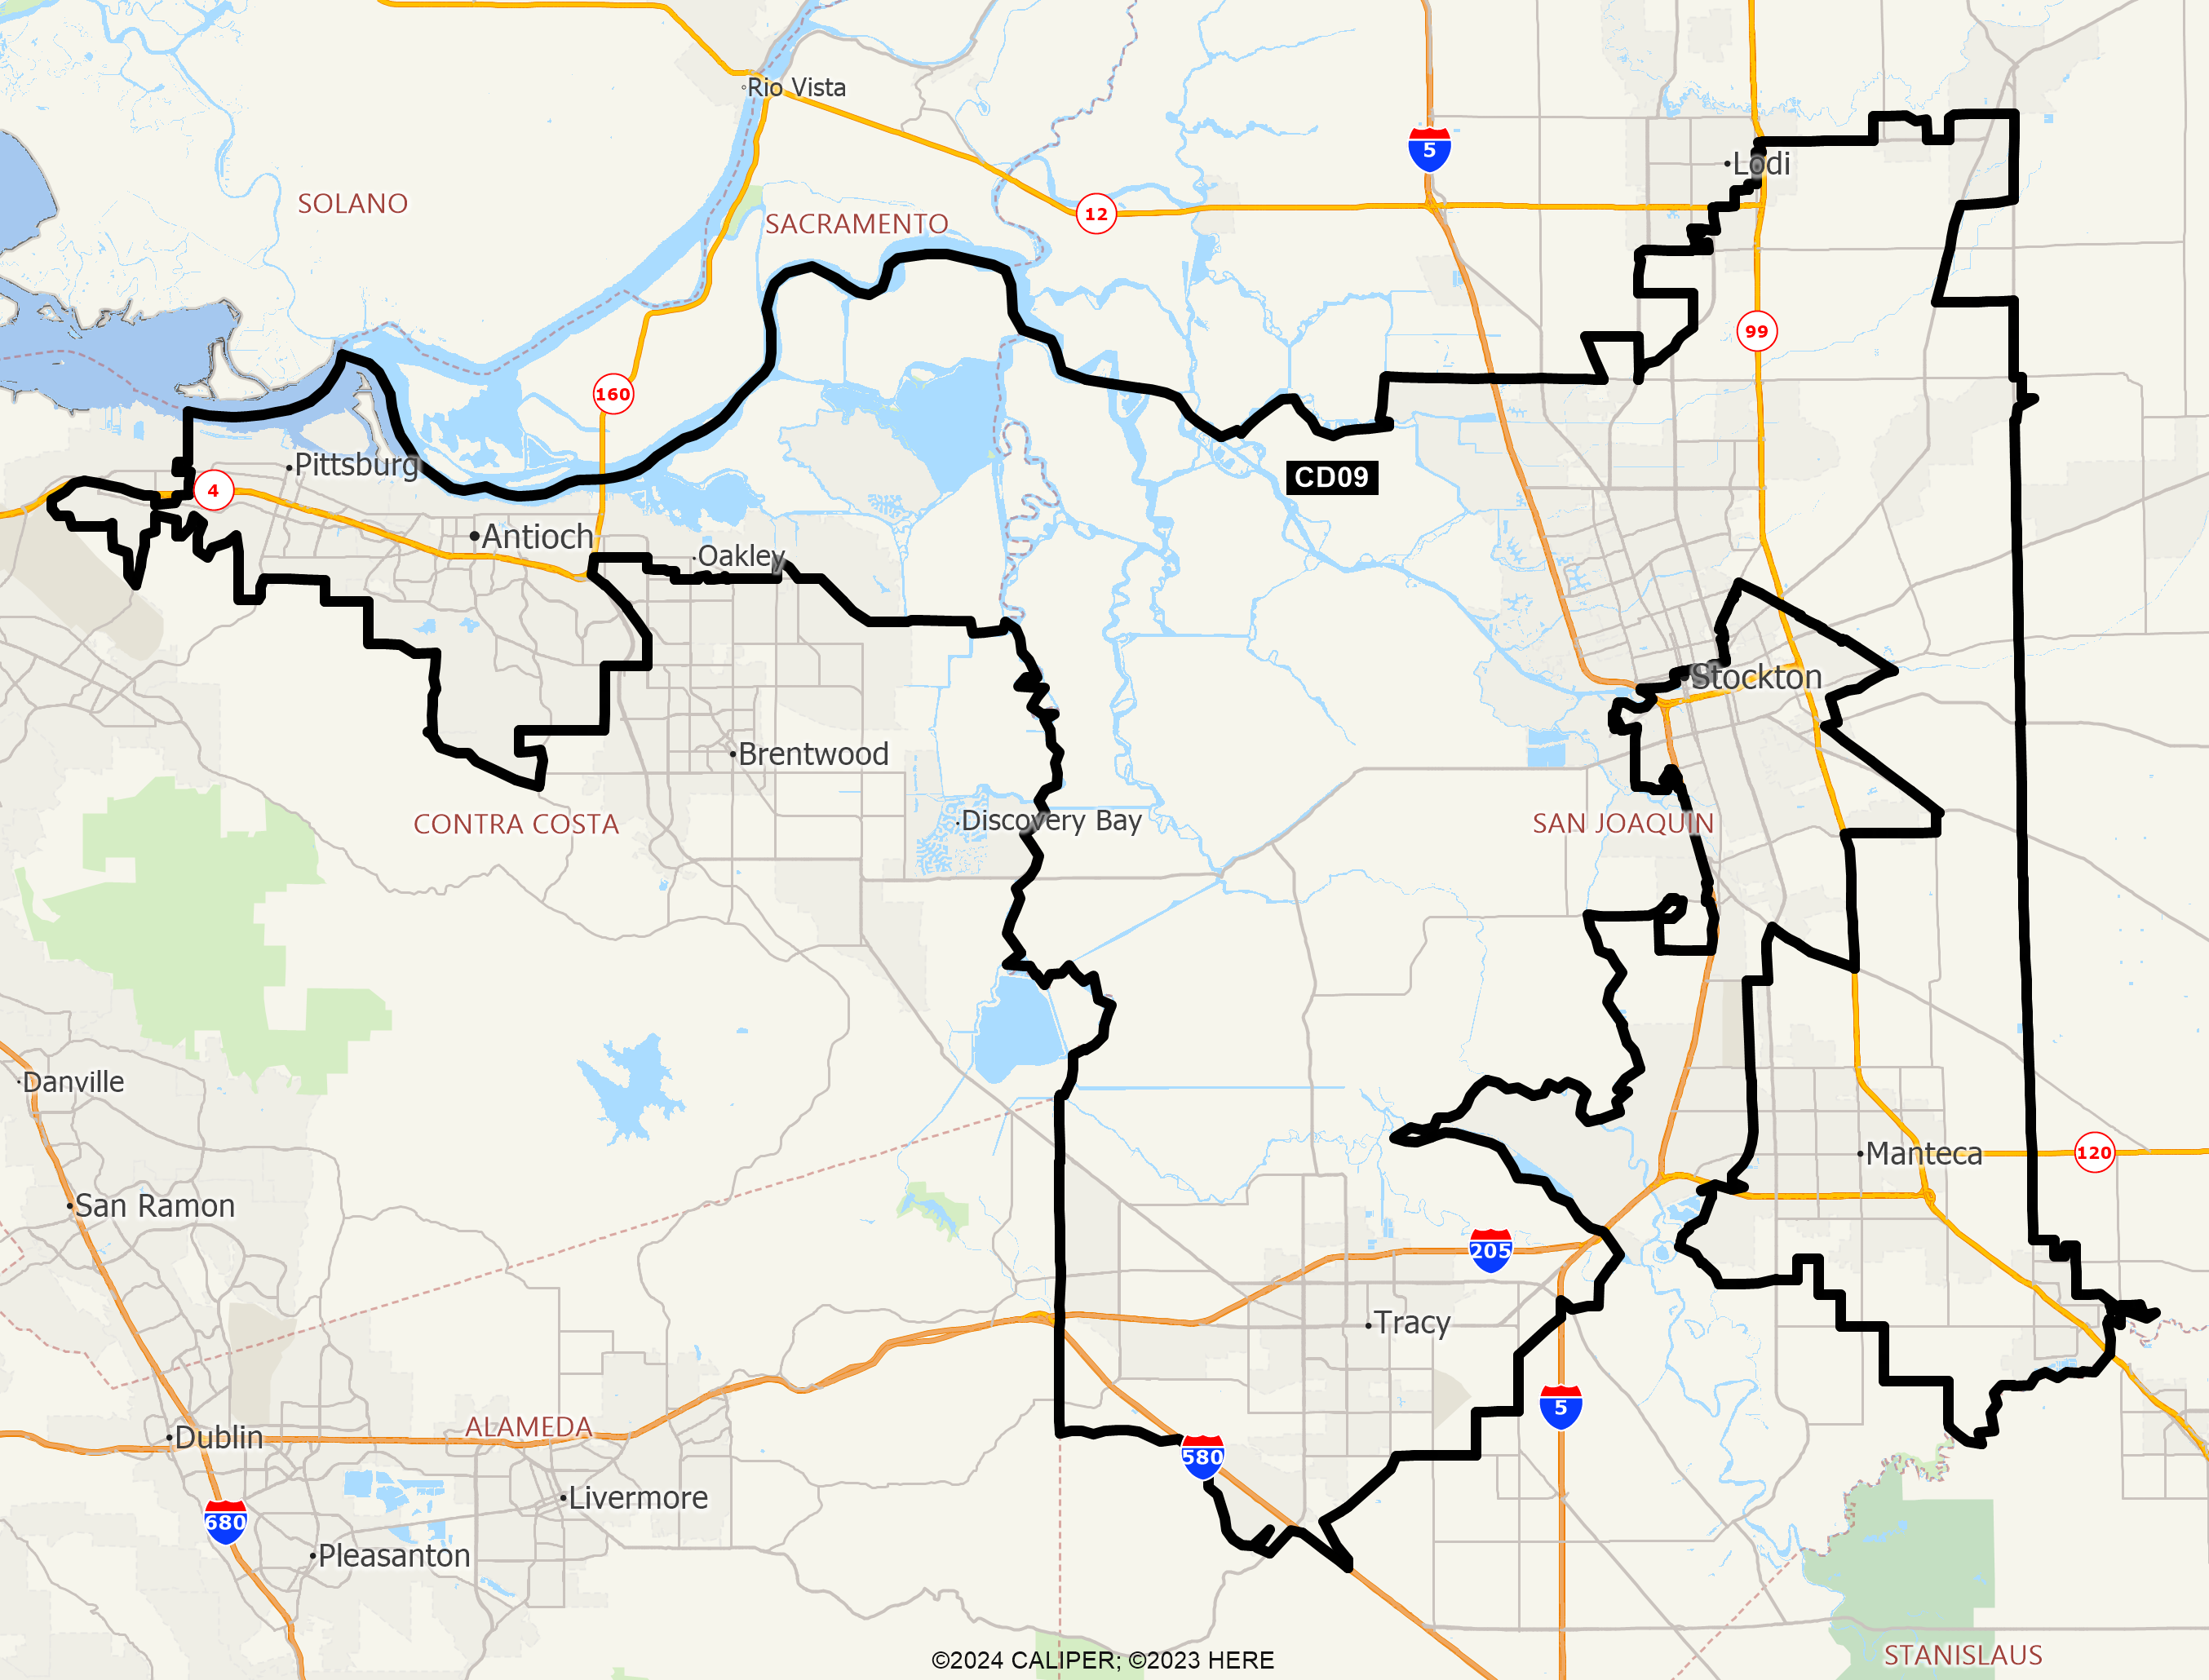
Counties In District Name Count Percent Contra Costa 214,635 18.38% San Joaquin 545,425 70.17%
Places In District Name Count Percent CONTRA COSTA: Antioch(C) 115,581 100.00% CONTRA COSTA: Bethel Island(U) 2,139 100.00% CONTRA COSTA: Oakley(C) 19,181 44.15% CONTRA COSTA: Pittsburg(C) 76,654 100.00% CONTRA COSTA: Remainder of Contra Costa(R) 1,080 10.25% SAN JOAQUIN: August(U) 618 7.11% SAN JOAQUIN: Country Club(U) 10,820 100.00% SAN JOAQUIN: French Camp(U) 1,850 48.89% SAN JOAQUIN: Garden Acres(U) 2 0.02% SAN JOAQUIN: Lincoln Village(U) 4,417 100.00% SAN JOAQUIN: Lockeford(U) 500 14.97% SAN JOAQUIN: Lodi(C) 15,190 22.82% SAN JOAQUIN: Manteca(C) 83,700 100.00% SAN JOAQUIN: Morada(U) 4,061 100.00% SAN JOAQUIN: Mountain House(U) 24,534 100.00% SAN JOAQUIN: Ripon(C) 16,049 100.00% SAN JOAQUIN: Stockton(C) 254,364 78.91% SAN JOAQUIN: Tracy(C) 93,225 100.00% SAN JOAQUIN: Victor(U) 314 100.00% SAN JOAQUIN: Waterloo(U) 537 100.00% SAN JOAQUIN: Remainder of San Joaquin(R) 35,244 51.01%
Senate Office of Demographics 02/2026