This Congressional district was established by the voters of California with the passage of Proposition 50 (2025) on November 4, 2025 and will go into effect after the November 2026 elections and upon seating of the 120th Congress, January 3, 2027. This district will stay in use until the California Citizens Redistricting Commission draws new maps following the 2030 U.S. Census .
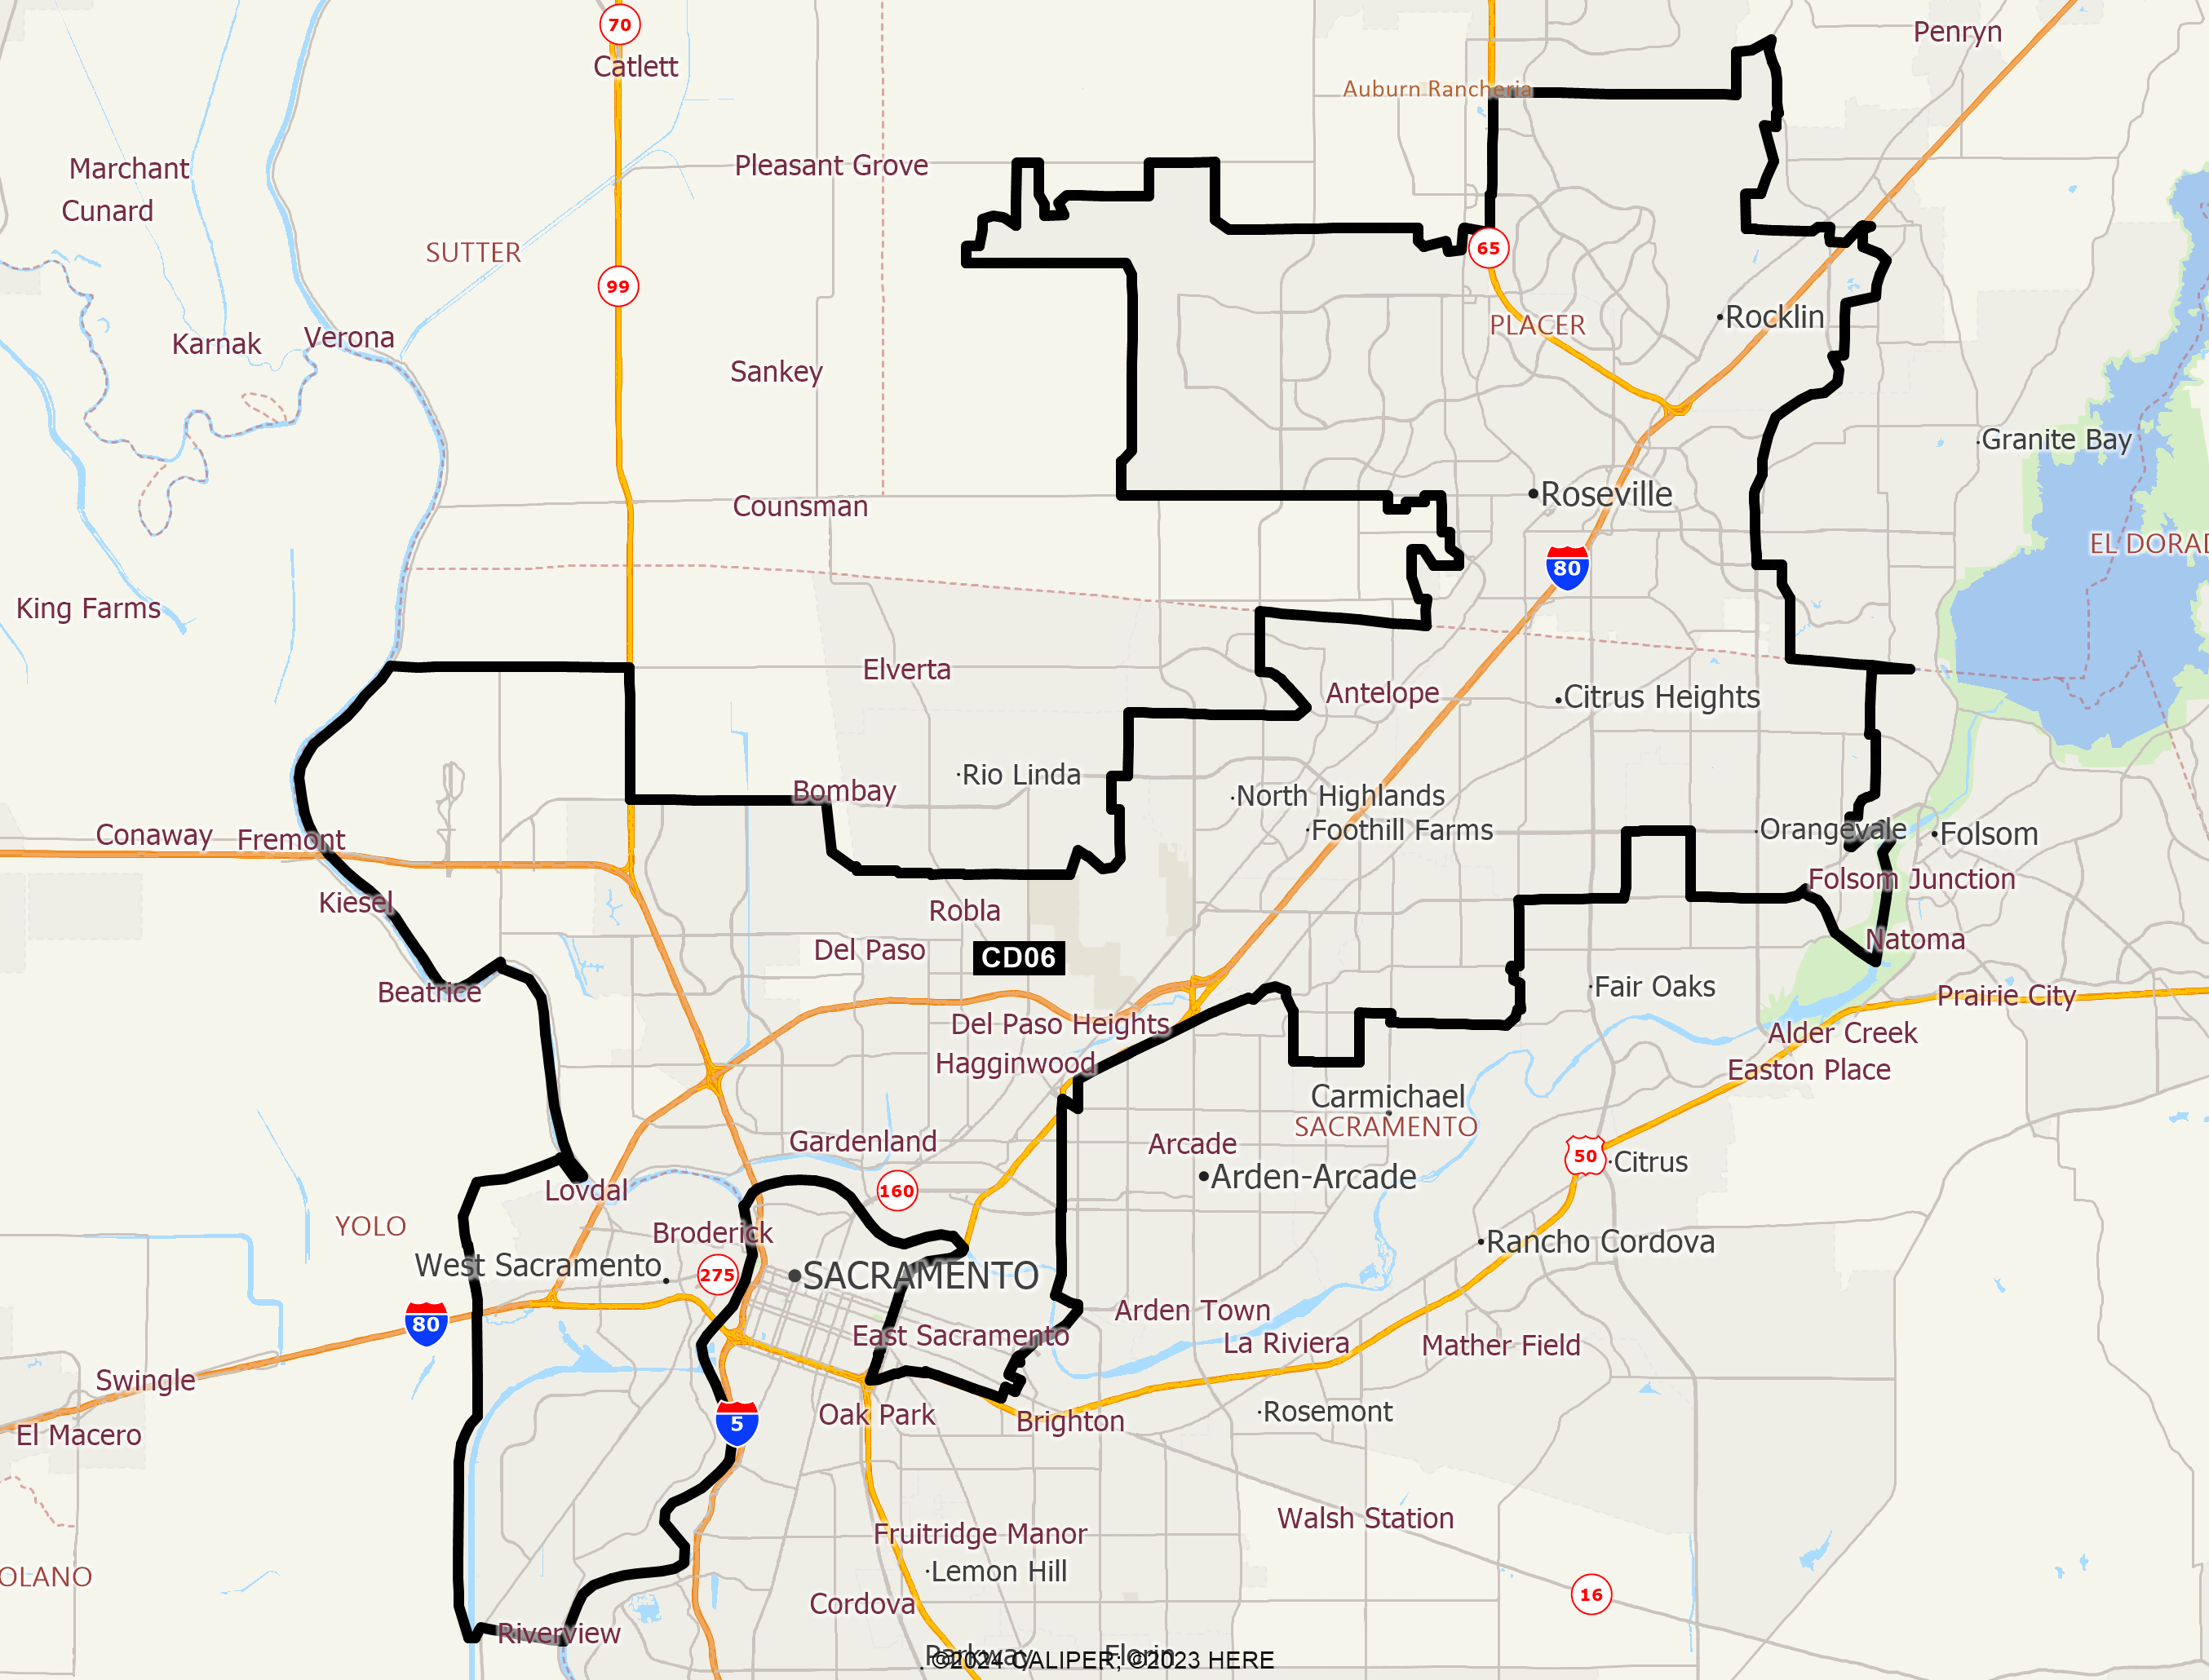
DISTRICT CD06
2020 Census Population (adj Elec. §21003 - SWDB 9/27/2021) Name Count Percent Total Population (POP) 760,067 100.00% POP Hispanic or Latino 169,635 22.32% POP Not Hispanic or Latino (NH) 590,432 77.68% POP NH Population of one race 540,240 71.08% POP NH White alone 386,058 50.79% POP NH Black or African American alone 50,818 6.69% POP NH Asian alone 89,139 11.73% POP NH American Indian and Alaska Native alone 3,784 0.50% POP NH Native Hawaiian and Other Pacific Islander alone 5,621 0.74% POP NH Some Other Race alone 4,820 0.63% POP NH Population of two or more races 50,192 6.60% POP DOJ NH Black or African American 59,299 7.80% POP DOJ NH Asian 103,712 13.65% POP DOJ NH American Indian and Alaska Native 13,296 1.75% POP DOJ NH Native Hawaiian and Other Pacific Islander 7,029 0.92% POP DOJ NH Some Other Race 11,187 1.47% POP DOJ NH Balance of Population of two or more races 9,851 1.30%
2020 Census Voting Age Population (adj Elec. §21003 - SWDB 9/27/2021) Name Count Percent Total Voting Age Population (VAP) 578,940 100.00% VAP Hispanic or Latino 114,779 19.83% VAP Not Hispanic or Latino (NH) 464,161 80.17% VAP NH Population of one race 432,973 74.79% VAP NH White alone 315,151 54.44% VAP NH Black or African American alone 38,647 6.68% VAP NH Asian alone 68,231 11.79% VAP NH American Indian and Alaska Native alone 3,057 0.53% VAP NH Native Hawaiian and Other Pacific Islander alone 4,393 0.76% VAP NH Some Other Race alone 3,494 0.60% VAP NH Population of two or more races 31,188 5.39% VAP DOJ NH Black or African American 42,744 7.38% VAP DOJ NH Asian 76,236 13.17% VAP DOJ NH American Indian and Alaska Native 10,503 1.81% VAP DOJ NH Native Hawaiian and Other Pacific Islander 5,239 0.90% VAP DOJ NH Some Other Race 8,289 1.43% VAP DOJ NH Balance of Population of two or more races 5,999 1.04%
2020 Census Housing Occupancy Status Name Count Percent Total Housing Units 285,359 100.00% Occupied 275,188 96.44% Vacant 10,171 3.56%
2020 Census Group Quarters Population (adj Elec. §21003 - SWDB 9/27/2021) Name Count Percent Total Group Quarters Population: 7,736 100.00% Institutionalized population: 2,753 35.59% Correctional facilities for adults 319 4.12% Juvenile facilities 142 1.84% Nursing facilities/Skilled-nursing facilities 2,142 27.69% Other institutional facilities 150 1.94% Noninstitutionalized population: 4,983 64.41% College/University student housing 457 5.91% Military quarters 0 0.00% Other noninstitutional facilities 4,526 58.51%
2019-2023 ACS Citizen Population (adj Elec. §21003 - SWDB 7/16/2025) Name Count Percent Total Citizen Population (CITZ) 702,238 100.00% CITZ Hispanic or Latino 151,505 21.57% CITZ Not Hispanic or Latino (NH) 550,815 78.44% CITZ NH White alone 382,703 54.50% CITZ NH Black or African American Alone 47,424 6.75% CITZ NH Asian Alone 75,088 10.69% CITZ NH American Indian and Alaska Native Alone 2,404 0.34% CITZ NH Native Hawaiian and Other Pacific Islander alone 3,311 0.47% CITZ NH Black or African American and White 10,198 1.45% CITZ NH American Indian or Alaska Native and White 14,252 2.03% CITZ NH Asian and White 6,057 0.86% CITZ NH American Indian or Alaska Native and Black or African American 1,641 0.23% CITZ NH Remainder of Two or More Race 7,629 1.09% CITZ DOJ NH Black or African American 57,622 8.21% CITZ DOJ NH Asian 89,340 12.72% CITZ DOJ NH American Indian and Alaska Native 8,461 1.20%
2019-2023 ACS Citizen Voting Age Population (adj Elec. §21003 - SWDB 7/16/2025) Name Count Percent Total Citizen Voting Age Population (CVAP) 531,282 100.00% CVAP Hispanic or Latino 98,792 18.60% CVAP Not Hispanic or Latino (NH) 432,494 81.41% CVAP NH White alone 310,301 58.41% CVAP NH Black or African American Alone 37,229 7.01% CVAP NH Asian Alone 57,197 10.77% CVAP NH American Indian and Alaska Native Alone 1,782 0.34% CVAP NH Native Hawaiian and Other Pacific Islander alone 2,834 0.53% CVAP NH Black or African American and White 5,346 1.01% CVAP NH Asian and White 7,819 1.47% CVAP NH American Indian or Alaska Native and White 4,612 0.87% CVAP NH American Indian or Alaska Native and Black or African American 1,046 0.20% CVAP NH Remainder of Two or More Race 4,058 0.76% CVAP DOJ NH Black or African American 42,575 8.01% CVAP DOJ NH Asian 65,016 12.24% CVAP DOJ NH American Indian and Alaska Native 6,394 1.20%
Counties In District Name Count Percent Placer 221,400 54.63% Sacramento 484,591 30.58% Yolo 54,078 24.93%
Places In District Name Count Percent PLACER: Rocklin(C) 71,685 100.00% PLACER: Roseville(C) 147,971 100.00% PLACER: Remainder of Placer(R) 1,744 2.94% SACRAMENTO: Antelope(U) 20,231 41.38% SACRAMENTO: Carmichael(U) 41,938 52.36% SACRAMENTO: Citrus Heights(C) 87,850 100.00% SACRAMENTO: Foothill Farms(U) 36,004 100.00% SACRAMENTO: McClellan Park(U) 930 100.00% SACRAMENTO: North Highlands(U) 49,615 100.00% SACRAMENTO: Orangevale(U) 35,658 100.00% SACRAMENTO: Sacramento(C) 211,914 40.25% SACRAMENTO: Remainder of Sacramento(R) 451 3.00% YOLO: West Sacramento(C) 54,071 100.00% YOLO: Remainder of Yolo(R) 7 0.08%
Senate Office of Demographics 02/2026