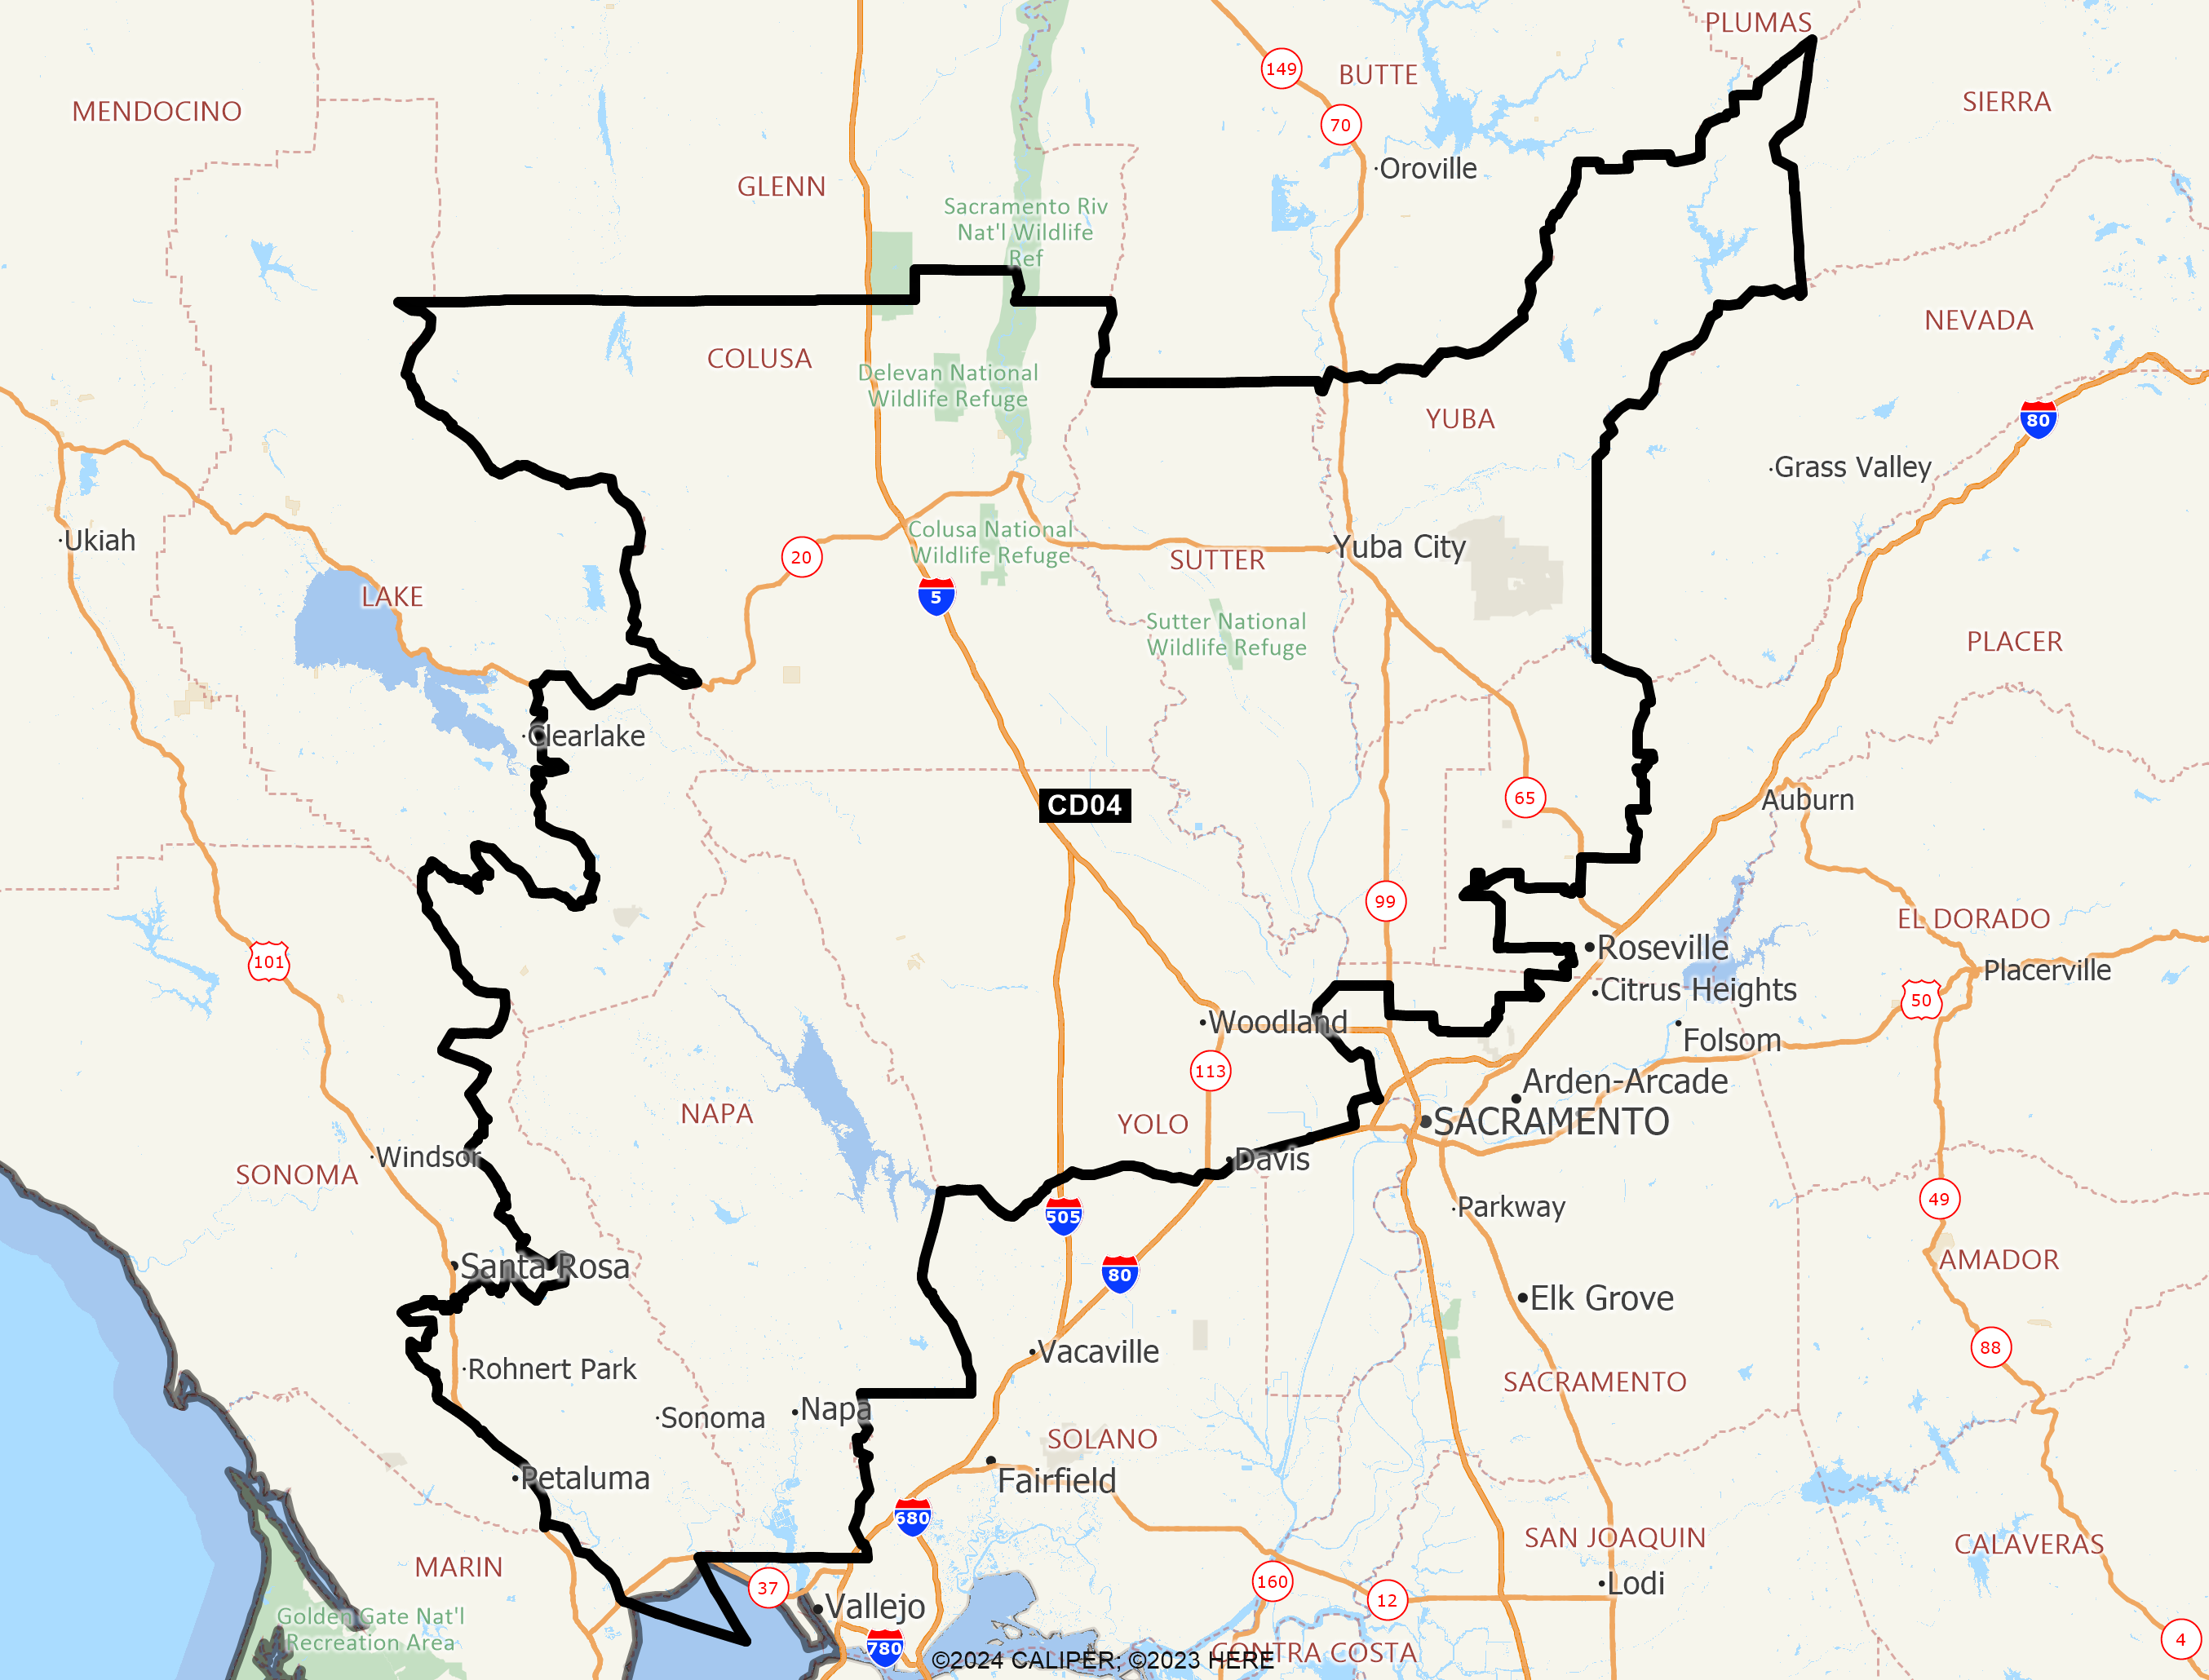
This Congressional district was established by the voters of California with the passage of Proposition 50 (2025) on November 4, 2025 and will go into effect after the November 2026 elections and upon seating of the 120th Congress, January 3, 2027. This district will stay in use until the California Citizens Redistricting Commission draws new maps following the 2030 U.S. Census .
DISTRICT CD04
2020 Census Population (adj Elec. §21003 - SWDB 9/27/2021) Name Count Percent Total Population (POP) 760,065 100.00% POP Hispanic or Latino 236,841 31.16% POP Not Hispanic or Latino (NH) 523,224 68.84% POP NH Population of one race 483,604 63.63% POP NH White alone 384,742 50.62% POP NH Black or African American alone 16,471 2.17% POP NH Asian alone 70,893 9.33% POP NH American Indian and Alaska Native alone 4,656 0.61% POP NH Native Hawaiian and Other Pacific Islander alone 2,390 0.31% POP NH Some Other Race alone 4,452 0.59% POP NH Population of two or more races 39,620 5.21% POP DOJ NH Black or African American 21,249 2.80% POP DOJ NH Asian 81,639 10.74% POP DOJ NH American Indian and Alaska Native 15,697 2.07% POP DOJ NH Native Hawaiian and Other Pacific Islander 3,490 0.46% POP DOJ NH Some Other Race 11,088 1.46% POP DOJ NH Balance of Population of two or more races 5,319 0.70%
2020 Census Voting Age Population (adj Elec. §21003 - SWDB 9/27/2021) Name Count Percent Total Voting Age Population (VAP) 592,951 100.00% VAP Hispanic or Latino 162,974 27.49% VAP Not Hispanic or Latino (NH) 429,977 72.51% VAP NH Population of one race 403,460 68.04% VAP NH White alone 323,585 54.57% VAP NH Black or African American alone 13,128 2.21% VAP NH Asian alone 57,731 9.74% VAP NH American Indian and Alaska Native alone 3,698 0.62% VAP NH Native Hawaiian and Other Pacific Islander alone 1,950 0.33% VAP NH Some Other Race alone 3,368 0.57% VAP NH Population of two or more races 26,517 4.47% VAP DOJ NH Black or African American 15,562 2.62% VAP DOJ NH Asian 64,082 10.81% VAP DOJ NH American Indian and Alaska Native 12,199 2.06% VAP DOJ NH Native Hawaiian and Other Pacific Islander 2,658 0.45% VAP DOJ NH Some Other Race 8,485 1.43% VAP DOJ NH Balance of Population of two or more races 3,406 0.57%
2020 Census Housing Occupancy Status Name Count Percent Total Housing Units 286,947 100.00% Occupied 267,722 93.30% Vacant 19,225 6.70%
2020 Census Group Quarters Population (adj Elec. §21003 - SWDB 9/27/2021) Name Count Percent Total Group Quarters Population: 21,087 100.00% Institutionalized population: 4,922 23.34% Correctional facilities for adults 1,006 4.77% Juvenile facilities 126 0.60% Nursing facilities/Skilled-nursing facilities 3,531 16.74% Other institutional facilities 259 1.23% Noninstitutionalized population: 16,165 76.66% College/University student housing 10,151 48.14% Military quarters 705 3.34% Other noninstitutional facilities 5,309 25.18%
2019-2023 ACS Citizen Population (adj Elec. §21003 - SWDB 7/16/2025) Name Count Percent Total Citizen Population (CITZ) 696,831 100.00% CITZ Hispanic or Latino 195,923 28.12% CITZ Not Hispanic or Latino (NH) 500,874 71.88% CITZ NH White alone 388,308 55.72% CITZ NH Black or African American Alone 18,832 2.70% CITZ NH Asian Alone 57,410 8.24% CITZ NH American Indian and Alaska Native Alone 2,832 0.41% CITZ NH Native Hawaiian and Other Pacific Islander alone 1,985 0.28% CITZ NH Black or African American and White 5,805 0.83% CITZ NH American Indian or Alaska Native and White 11,570 1.66% CITZ NH Asian and White 6,999 1.00% CITZ NH American Indian or Alaska Native and Black or African American 754 0.11% CITZ NH Remainder of Two or More Race 6,406 0.92% CITZ DOJ NH Black or African American 24,637 3.54% CITZ DOJ NH Asian 68,980 9.90% CITZ DOJ NH American Indian and Alaska Native 9,831 1.41%
2019-2023 ACS Citizen Voting Age Population (adj Elec. §21003 - SWDB 7/16/2025) Name Count Percent Total Citizen Voting Age Population (CVAP) 535,082 100.00% CVAP Hispanic or Latino 125,083 23.38% CVAP Not Hispanic or Latino (NH) 409,973 76.62% CVAP NH White alone 325,144 60.77% CVAP NH Black or African American Alone 14,912 2.79% CVAP NH Asian Alone 45,619 8.53% CVAP NH American Indian and Alaska Native Alone 2,276 0.43% CVAP NH Native Hawaiian and Other Pacific Islander alone 1,684 0.31% CVAP NH Black or African American and White 3,232 0.60% CVAP NH Asian and White 7,094 1.33% CVAP NH American Indian or Alaska Native and White 5,776 1.08% CVAP NH American Indian or Alaska Native and Black or African American 419 0.08% CVAP NH Remainder of Two or More Race 3,785 0.71% CVAP DOJ NH Black or African American 18,144 3.39% CVAP DOJ NH Asian 52,713 9.85% CVAP DOJ NH American Indian and Alaska Native 8,052 1.50%
Counties In District Name Count Percent Colusa 21,898 100.00% Lake 6,057 8.86% Napa 138,299 100.00% Placer 61,425 15.16% Sacramento 50,354 3.18% Sonoma 152,041 31.05% Sutter 99,930 100.00% Yolo 148,070 68.26% Yuba 81,993 100.00%
Places In District Name Count Percent COLUSA: Arbuckle(U) 3,494 100.00% COLUSA: College City(U) 295 100.00% COLUSA: Colusa(C) 6,430 100.00% COLUSA: Grimes(U) 299 100.00% COLUSA: Lodoga(U) 185 100.00% COLUSA: Maxwell(U) 1,068 100.00% COLUSA: Princeton(U) 309 100.00% COLUSA: Stonyford(U) 133 100.00% COLUSA: Williams(C) 5,550 100.00% COLUSA: Remainder of Colusa(R) 4,135 100.00% LAKE: Cobb(U) 129 9.95% LAKE: Hidden Valley Lake(U) 1,949 31.19% LAKE: Lower Lake(U) 788 61.56% LAKE: Middletown(U) 1,115 100.00% LAKE: Remainder of Lake(R) 2,076 14.63% NAPA: American Canyon(C) 21,881 100.00% NAPA: Angwin(U) 2,638 100.00% NAPA: Calistoga(C) 5,237 100.00% NAPA: Deer Park(U) 1,296 100.00% NAPA: Moskowite Corner(U) 239 100.00% NAPA: Napa(C) 79,414 100.00% NAPA: Oakville(U) 50 100.00% NAPA: Rutherford(U) 115 100.00% NAPA: St. Helena(C) 5,436 100.00% NAPA: Silverado Resort(U) 950 100.00% NAPA: Yountville(C) 3,442 100.00% NAPA: Remainder of Napa(R) 17,601 100.00% PLACER: Lincoln(C) 49,825 100.00% PLACER: Sheridan(U) 1,387 100.00% PLACER: Remainder of Placer(R) 10,213 17.22% SACRAMENTO: Antelope(U) 28,654 58.62% SACRAMENTO: Elverta(U) 5,467 100.00% SACRAMENTO: Rio Linda(U) 16,022 100.00% SACRAMENTO: Remainder of Sacramento(R) 211 1.40% SONOMA: Boyes Hot Springs(U) 6,227 100.00% SONOMA: Cotati(C) 7,593 100.00% SONOMA: Eldridge(U) 1,315 100.00% SONOMA: El Verano(U) 3,878 100.00% SONOMA: Fetters Hot Springs-Agua Caliente(U) 4,235 100.00% SONOMA: Glen Ellen(U) 717 100.00% SONOMA: Kenwood(U) 853 100.00% SONOMA: Penngrove(U) 2,641 100.00% SONOMA: Petaluma(C) 36,929 61.71% SONOMA: Rohnert Park(C) 44,464 100.00% SONOMA: Sonoma(C) 10,761 100.00% SONOMA: Sonoma State University(U) 2,680 100.00% SONOMA: Temelec(U) 1,500 100.00% SONOMA: Remainder of Sonoma(R) 28,248 33.55% SUTTER: East Nicolaus(U) 223 100.00% SUTTER: Live Oak(C) 9,123 100.00% SUTTER: Meridian(U) 307 100.00% SUTTER: Nicolaus(U) 176 100.00% SUTTER: Rio Oso(U) 372 100.00% SUTTER: Robbins(U) 349 100.00% SUTTER: Sutter(U) 3,005 100.00% SUTTER: Trowbridge(U) 230 100.00% SUTTER: Yuba City(C) 70,340 100.00% SUTTER: Remainder of Sutter(R) 15,805 100.00% YOLO: Brooks(U) 31 100.00% YOLO: Davis(C) 55,274 82.56% YOLO: Dunnigan(U) 1,387 100.00% YOLO: Esparto(U) 3,579 100.00% YOLO: Guinda(U) 245 100.00% YOLO: Knights Landing(U) 1,124 100.00% YOLO: Madison(U) 589 100.00% YOLO: Monument Hills(U) 1,703 100.00% YOLO: Rumsey(U) 91 100.00% YOLO: Tancred(U) 89 100.00% YOLO: University of California-Davis(U) 8,530 100.00% YOLO: Winters(C) 7,132 100.00% YOLO: Woodland(C) 61,233 100.00% YOLO: Yolo(U) 427 100.00% YOLO: Remainder of Yolo(R) 6,636 80.27% YUBA: Beale AFB(U) 1,306 100.00% YUBA: Camptonville(U) 160 100.00% YUBA: Challenge-Brownsville(U) 1,166 100.00% YUBA: Dobbins(U) 557 100.00% YUBA: Linda(U) 21,786 100.00% YUBA: Loma Rica(U) 2,421 100.00% YUBA: Marysville(C) 12,939 100.00% YUBA: Olivehurst(U) 16,676 100.00% YUBA: Plumas Lake(U) 8,151 100.00% YUBA: Smartsville(U) 187 100.00% YUBA: Wheatland(C) 3,724 100.00% YUBA: Remainder of Yuba(R) 12,920 100.00%
Senate Office of Demographics 02/2026