This Congressional district was established by the voters of California with the passage of Proposition 50 (2025) on November 4, 2025 and will go into effect after the November 2026 elections and upon seating of the 120th Congress, January 3, 2027. This district will stay in use until the California Citizens Redistricting Commission draws new maps following the 2030 U.S. Census .
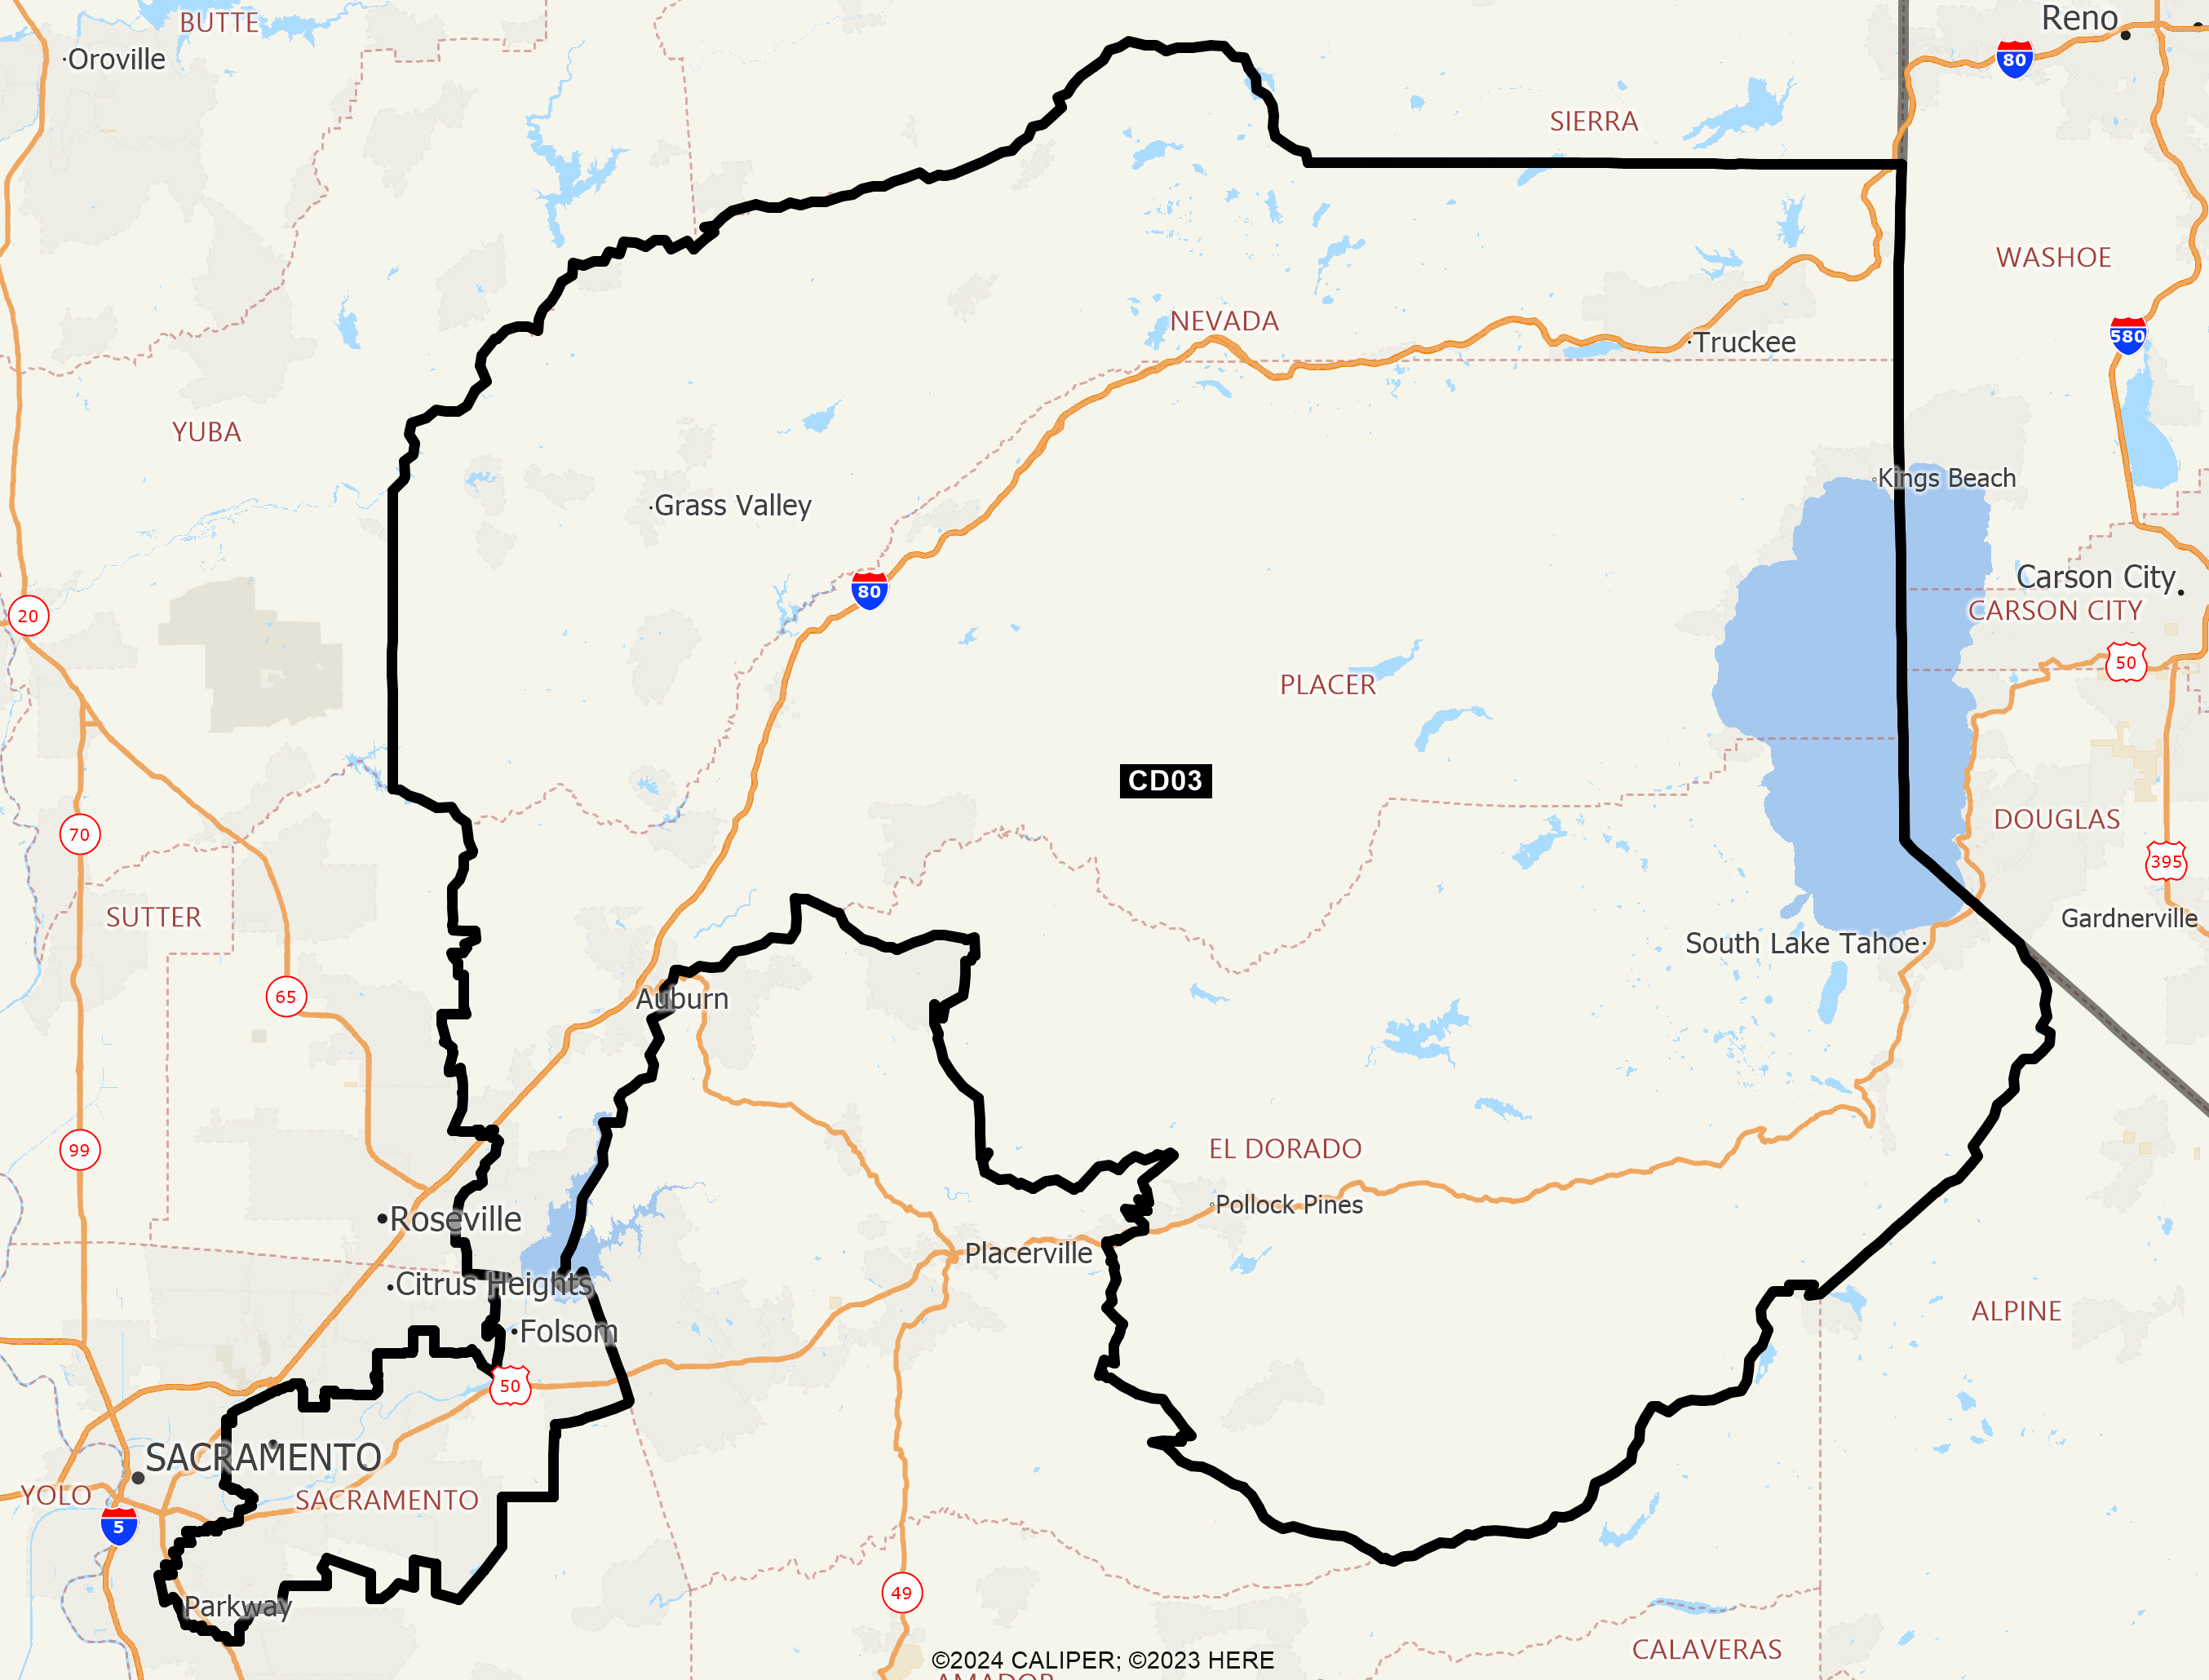
DISTRICT CD03
2020 Census Population (adj Elec. §21003 - SWDB 9/27/2021) Name Count Percent Total Population (POP) 760,067 100.00% POP Hispanic or Latino 141,407 18.60% POP Not Hispanic or Latino (NH) 618,660 81.40% POP NH Population of one race 571,047 75.13% POP NH White alone 435,208 57.26% POP NH Black or African American alone 39,035 5.14% POP NH Asian alone 82,986 10.92% POP NH American Indian and Alaska Native alone 4,055 0.53% POP NH Native Hawaiian and Other Pacific Islander alone 4,904 0.65% POP NH Some Other Race alone 4,859 0.64% POP NH Population of two or more races 47,613 6.26% POP DOJ NH Black or African American 45,551 5.99% POP DOJ NH Asian 96,818 12.74% POP DOJ NH American Indian and Alaska Native 14,959 1.97% POP DOJ NH Native Hawaiian and Other Pacific Islander 6,007 0.79% POP DOJ NH Some Other Race 12,741 1.68% POP DOJ NH Balance of Population of two or more races 7,376 0.97%
2020 Census Voting Age Population (adj Elec. §21003 - SWDB 9/27/2021) Name Count Percent Total Voting Age Population (VAP) 597,211 100.00% VAP Hispanic or Latino 97,241 16.28% VAP Not Hispanic or Latino (NH) 499,970 83.72% VAP NH Population of one race 468,702 78.48% VAP NH White alone 366,002 61.29% VAP NH Black or African American alone 29,791 4.99% VAP NH Asian alone 62,320 10.44% VAP NH American Indian and Alaska Native alone 3,293 0.55% VAP NH Native Hawaiian and Other Pacific Islander alone 3,630 0.61% VAP NH Some Other Race alone 3,666 0.61% VAP NH Population of two or more races 31,268 5.24% VAP DOJ NH Black or African American 33,352 5.58% VAP DOJ NH Asian 69,906 11.71% VAP DOJ NH American Indian and Alaska Native 11,830 1.98% VAP DOJ NH Native Hawaiian and Other Pacific Islander 4,345 0.73% VAP DOJ NH Some Other Race 9,838 1.65% VAP DOJ NH Balance of Population of two or more races 4,697 0.79%
2020 Census Housing Occupancy Status Name Count Percent Total Housing Units 342,465 100.00% Occupied 292,553 85.43% Vacant 49,912 14.57%
2020 Census Group Quarters Population (adj Elec. §21003 - SWDB 9/27/2021) Name Count Percent Total Group Quarters Population: 10,341 100.00% Institutionalized population: 4,537 43.87% Correctional facilities for adults 593 5.73% Juvenile facilities 242 2.34% Nursing facilities/Skilled-nursing facilities 3,521 34.05% Other institutional facilities 181 1.75% Noninstitutionalized population: 5,804 56.13% College/University student housing 158 1.53% Military quarters 0 0.00% Other noninstitutional facilities 5,646 54.60%
2019-2023 ACS Citizen Population (adj Elec. §21003 - SWDB 7/16/2025) Name Count Percent Total Citizen Population (CITZ) 702,044 100.00% CITZ Hispanic or Latino 122,624 17.47% CITZ Not Hispanic or Latino (NH) 579,350 82.52% CITZ NH White alone 435,225 61.99% CITZ NH Black or African American Alone 42,330 6.03% CITZ NH Asian Alone 62,314 8.88% CITZ NH American Indian and Alaska Native Alone 2,235 0.32% CITZ NH Native Hawaiian and Other Pacific Islander alone 3,280 0.47% CITZ NH Black or African American and White 7,425 1.06% CITZ NH American Indian or Alaska Native and White 12,420 1.77% CITZ NH Asian and White 6,786 0.97% CITZ NH American Indian or Alaska Native and Black or African American 1,070 0.15% CITZ NH Remainder of Two or More Race 6,443 0.92% CITZ DOJ NH Black or African American 49,755 7.09% CITZ DOJ NH Asian 74,734 10.65% CITZ DOJ NH American Indian and Alaska Native 9,021 1.28%
2019-2023 ACS Citizen Voting Age Population (adj Elec. §21003 - SWDB 7/16/2025) Name Count Percent Total Citizen Voting Age Population (CVAP) 546,805 100.00% CVAP Hispanic or Latino 79,213 14.49% CVAP Not Hispanic or Latino (NH) 467,519 85.50% CVAP NH White alone 363,764 66.53% CVAP NH Black or African American Alone 32,277 5.90% CVAP NH Asian Alone 46,441 8.49% CVAP NH American Indian and Alaska Native Alone 1,750 0.32% CVAP NH Native Hawaiian and Other Pacific Islander alone 2,390 0.44% CVAP NH Black or African American and White 4,288 0.78% CVAP NH Asian and White 6,381 1.17% CVAP NH American Indian or Alaska Native and White 5,672 1.04% CVAP NH American Indian or Alaska Native and Black or African American 751 0.14% CVAP NH Remainder of Two or More Race 4,023 0.74% CVAP DOJ NH Black or African American 36,565 6.69% CVAP DOJ NH Asian 52,822 9.66% CVAP DOJ NH American Indian and Alaska Native 7,422 1.36%
Counties In District Name Count Percent El Dorado 47,799 24.97% Nevada 102,284 100.00% Placer 122,481 30.22% Sacramento 487,503 30.76%
Places In District Name Count Percent EL DORADO: Grizzly Flats(U) 1,095 100.00% EL DORADO: Meyers(U) 2,165 100.00% EL DORADO: Pollock Pines(U) 7,141 100.00% EL DORADO: South Lake Tahoe(C) 21,394 100.00% EL DORADO: Tahoma(U) 675 100.00% EL DORADO: Remainder of El Dorado(R) 15,329 28.31% NEVADA: Alta Sierra(U) 7,211 100.00% NEVADA: Floriston(U) 80 100.00% NEVADA: Graniteville(U) 1 100.00% NEVADA: Grass Valley(C) 14,043 100.00% NEVADA: Kingvale(U) 126 100.00% NEVADA: Lake of the Pines(U) 4,302 100.00% NEVADA: Lake Wildwood(U) 5,166 100.00% NEVADA: Nevada City(C) 3,160 100.00% NEVADA: North San Juan(U) 245 100.00% NEVADA: Penn Valley(U) 1,596 100.00% NEVADA: Rough and Ready(U) 905 100.00% NEVADA: Soda Springs(U) 94 100.00% NEVADA: Truckee(C) 16,741 100.00% NEVADA: Washington(U) 103 100.00% NEVADA: Remainder of Nevada(R) 48,511 100.00% PLACER: Alta(U) 616 100.00% PLACER: Auburn(C) 13,820 100.00% PLACER: Carnelian Bay(U) 519 100.00% PLACER: Cedar Flat(U) 799 100.00% PLACER: Colfax(C) 2,000 100.00% PLACER: Dollar Point(U) 1,264 100.00% PLACER: Dutch Flat(U) 183 100.00% PLACER: Foresthill(U) 1,696 100.00% PLACER: Granite Bay(U) 21,270 100.00% PLACER: Kings Beach(U) 3,565 100.00% PLACER: Kingvale(U) 3 100.00% PLACER: Loomis(C) 6,846 100.00% PLACER: Meadow Vista(U) 3,265 100.00% PLACER: Newcastle(U) 1,328 100.00% PLACER: North Auburn(U) 13,474 100.00% PLACER: Penryn(U) 1,153 100.00% PLACER: Sunnyside-Tahoe City(U) 1,556 100.00% PLACER: Tahoe Vista(U) 1,393 100.00% PLACER: Tahoma(U) 363 100.00% PLACER: Remainder of Placer(R) 47,368 79.84% SACRAMENTO: Arden-Arcade(U) 95,070 100.00% SACRAMENTO: Carmichael(U) 38,163 47.64% SACRAMENTO: Fair Oaks(U) 32,612 100.00% SACRAMENTO: Florin(U) 26,137 49.64% SACRAMENTO: Folsom(C) 75,038 100.00% SACRAMENTO: Fruitridge Pocket(U) 6,164 100.00% SACRAMENTO: Gold River(U) 7,853 100.00% SACRAMENTO: La Riviera(U) 11,295 100.00% SACRAMENTO: Lemon Hill(U) 14,618 100.00% SACRAMENTO: Mather(U) 4,710 100.00% SACRAMENTO: Parkway(U) 16,049 100.00% SACRAMENTO: Rancho Cordova(C) 79,643 100.00% SACRAMENTO: Rosemont(U) 23,606 100.00% SACRAMENTO: Sacramento(C) 55,480 10.54% SACRAMENTO: Remainder of Sacramento(R) 1,065 7.08%
Senate Office of Demographics 02/2026